iPhone More Popular than Android, Especially at Work
People on the internet will continue to argue over which is better: Apple or Android, but there's not much room for debate about which is more popular. Over the past few years, Android phones have dominated the mobile market, accounting for 72% of the global market share.
But while the general public may prefer Android, how loyal are Americans to their smartphone brands? What demographics do these users fall under, how does it tie into their work life, and what might happen if another brand entered the scene?
To answer these questions, we surveyed over 1,000 Americans — half Android users, half iPhone users — about their preferred smartphones and how it affects their employment and work lives.
Key Takeaways
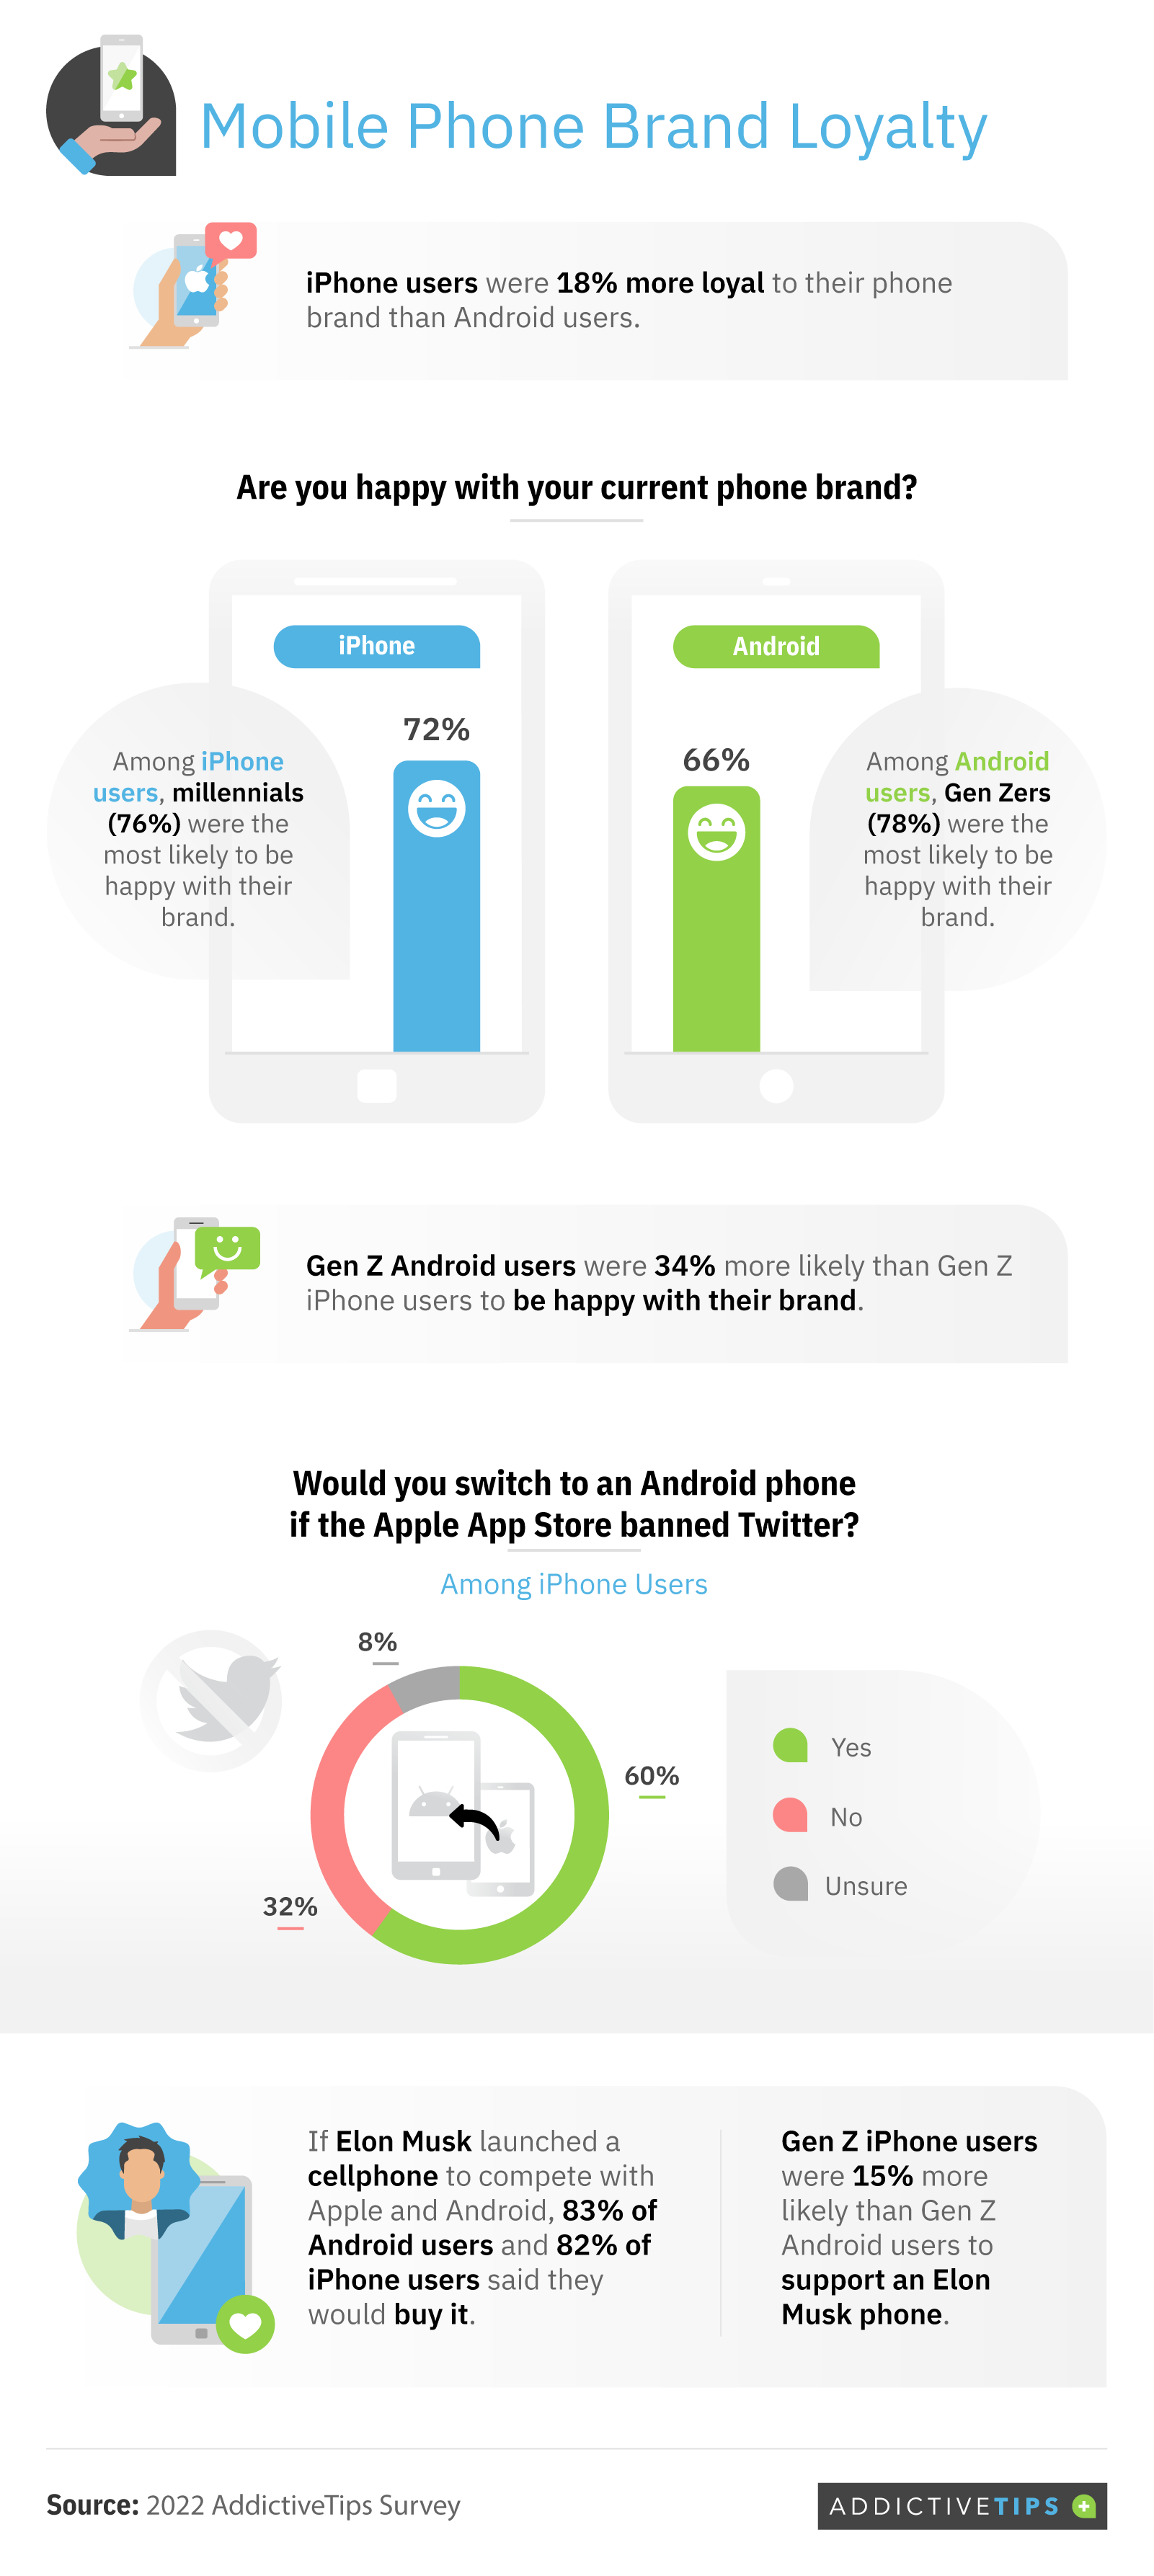
- iPhone users (94%) are more likely than Android users (80%) to be loyal to their phone brand.
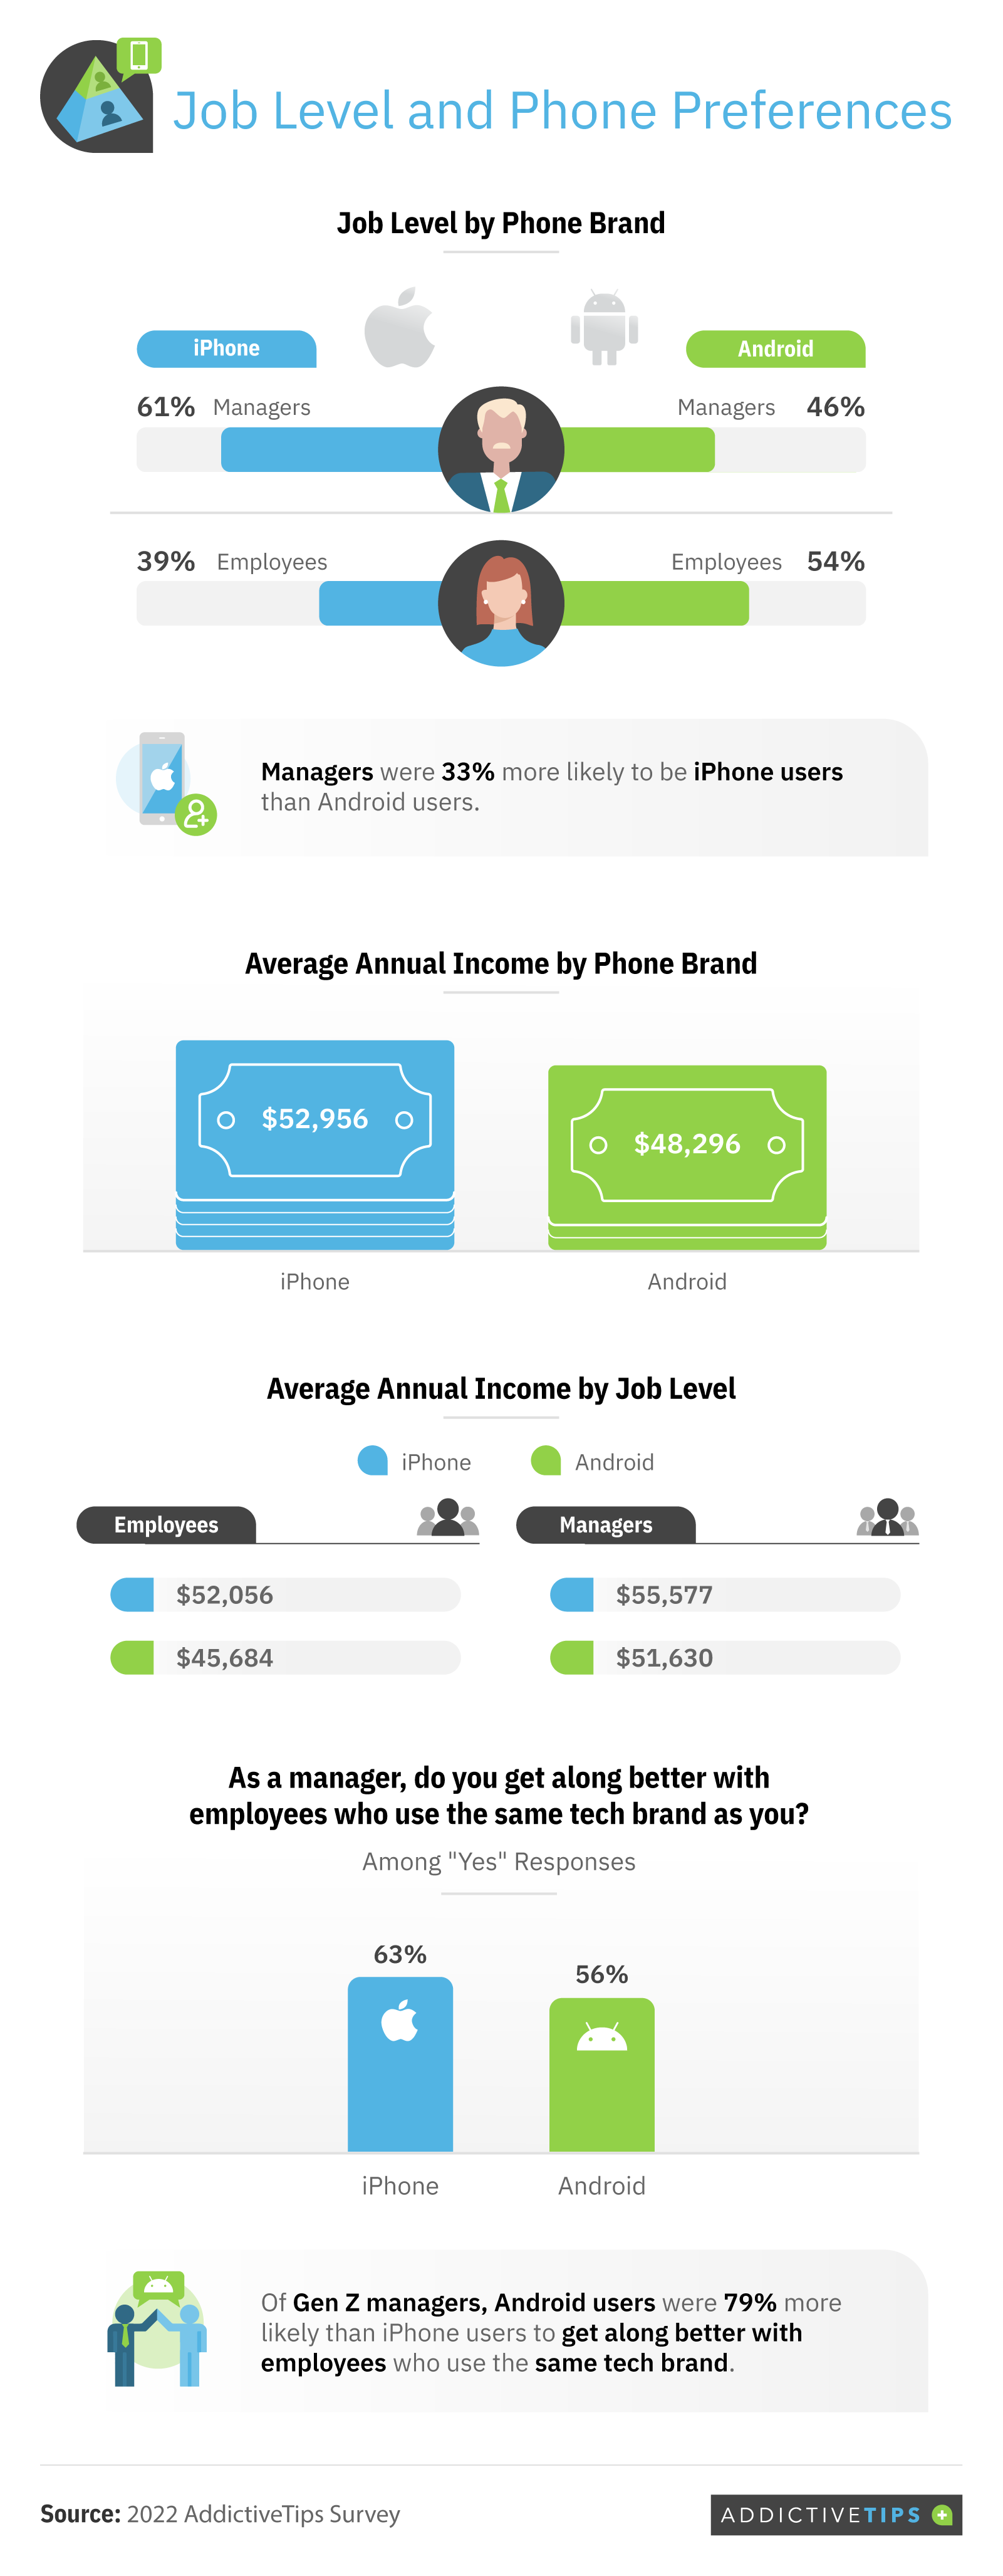
- Managers are 33% more likely to be iPhone users, and most of them (63%) get along better with employees who use the same brand.
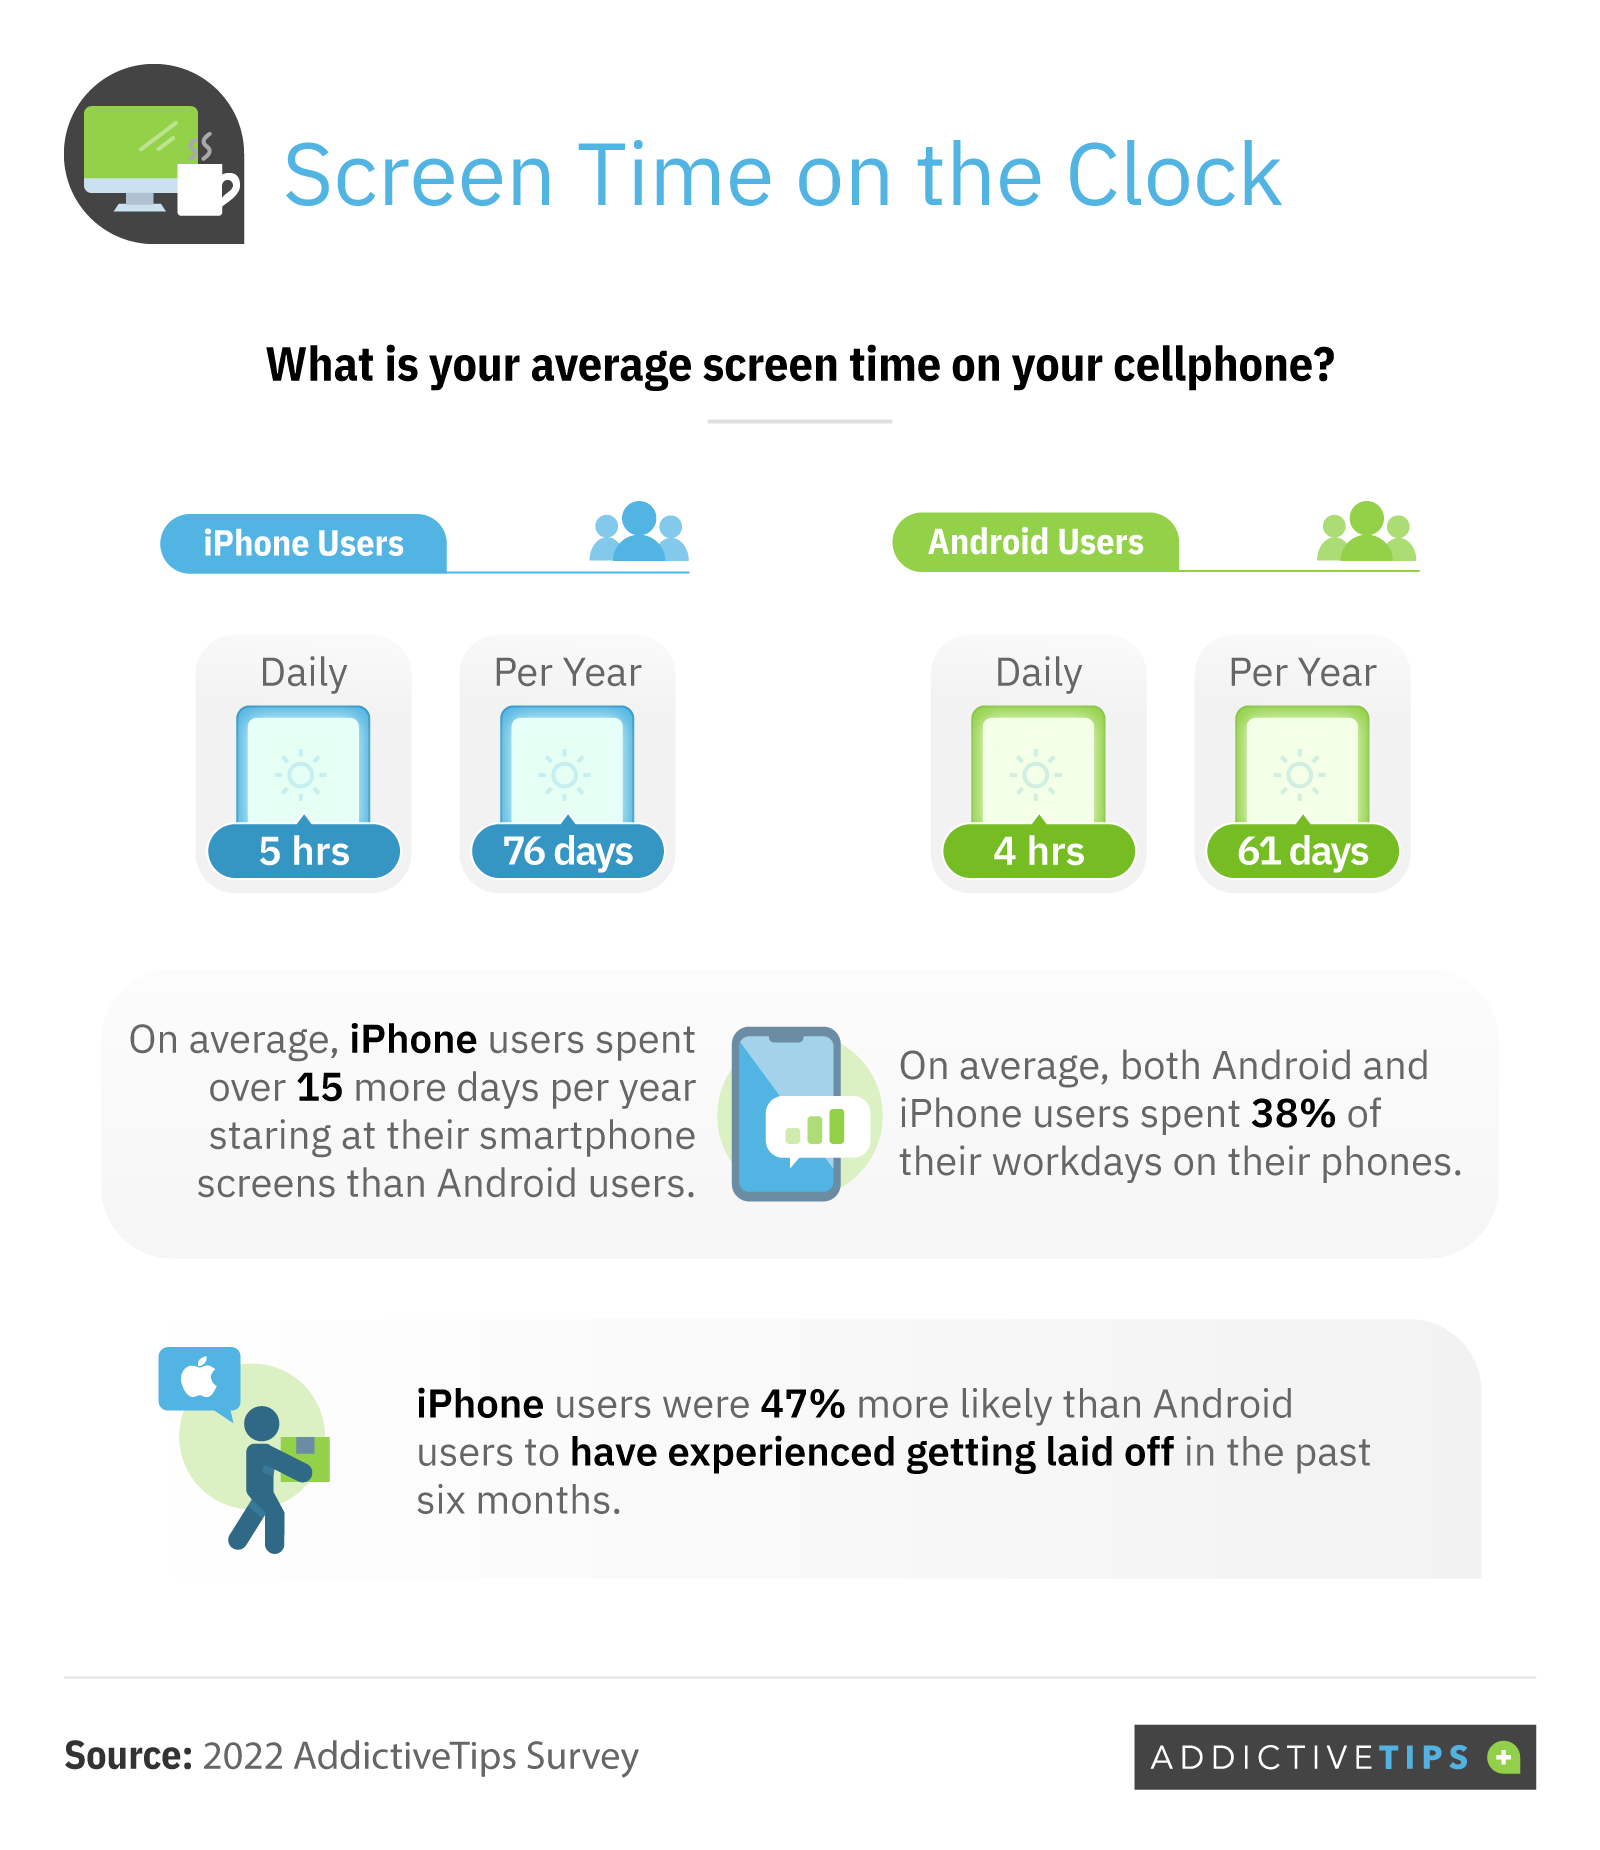
- On average, iPhone users spent over 15 more days per year staring at their smartphone screens than Android users.
- 60% of iPhone users would switch to Android if Twitter were removed from the App Store.
Brand Loyalty
How attached are Americans to their smartphone manufacturers and operating systems, how happy are they with their choices, and how likely are they to jump ship if given the chance?

Apple has some very devoted followers. Of the people we surveyed, iPhone users were 18% more loyal to their device's brand than Android users. They were also more satisfied with their current phone; 72% of iPhone users reported being happy with it compared to 66% of Android users. Maybe that's due to Apple's suite of devices that are designed to work together seamlessly.
But these results varied between generations. Most of the happy iPhone users were millennials (76%), while the happy Android users were mostly Gen Zers (78%). Gen Z Android users might also be more loyal to their brand than the iPhone users of this generation; if Elon Musk were to come out with a new smartphone, not all Gen Zers said they would hop on the trend, but the iPhone users among them would be 15% more likely to do so.
Job Impacts
We've established that iPhones garner the most brand loyalty (with the possible exception of Gen Z). But what does the split between iPhone and Android look like in the workplace, and how might it impact relationships there?

Overall, we found that employees and managers using iPhones were more loyal to their smartphone brand than Android users were. But professionals at each job level had different brand preferences: most Android users were employees (54%), while most iPhone users were managers (61%).
This might have to do with the many lower-priced options among devices with an Android operating system, but it seems even more likely when you look at the annual incomes of each brand's users. Android users earn an average of just over $48,000 each year, while iPhone users make nearly $53,000. That $5,000 difference might not sound like much over the course of a year, but that's over $400 a month, which could easily mean the difference between a top-of-the-line model and a budget-friendly option.
iPhones may point to slightly higher income, but might their operating system also breed an "in-crowd" mentality more often than Android's? We found that managers using iPhones work better with other iPhone users (63% of them said so). It's not hard to see why: For one thing, they get more functionality within group texts when everyone in the chat is using iMessage (an iPhone-only feature). Plus, the ability to AirDrop files between devices with just a few taps is sure to come in handy at work.
iPhone users might work better together overall, but Gen Z stood out from the crowd. Android users of this generation were 79% more likely than its iPhone users to say they get along better with coworkers who use the same brand they do. Maybe the younger Android users were more familiar with Android features like Beam, which hasn't gained as much of a foothold as Apple's AirDrop.
Work-life Impacts
We've seen which brands Americans at various job levels prefer. But how does smartphone choice correlate with screen time at work?

Although iPhone users may fare better at the office when it comes to communicating with coworkers, they were 47% more likely than Android users to have gotten laid off in the past six months. So, it doesn't seem like iPhone users' device of choice has improved their job security or career outlook.
However, we did see more screen time spent on iPhones than Androids. On average, iPhone screens were used an hour more per day than those of Androids, amounting to a difference of more than 15 days (365 hours) each year. At work, though, the average amount of screen time was roughly the same between device brands; users of each have spent about 38% of their workday on their smartphones.
The Divide Continues
Even while Android controls the market, Apple has had the most loyal users across nearly every generation. The one that stood out was Gen Z, who made up the majority of happy Android users and would be most likely to switch from an iPhone to a third brand, should one emerge.
Preferences of today's youngest smartphone users could define the future of the industry. But recently, higher-income working Americans and managers have tended towards iPhones. And since most of them prefer to work with other iPhone users, that might be the best device choice for employees as well.
Could we see a shift away from Apple devices at some point, based on what we've learned about Gen Z? Time will tell. For now, though, the iPhone reigns — at least in the workplace.
Methodology
We surveyed 1,003 employed Americans who owned an iPhone (50%) or an Android phone (50%). Among them, 62% were men and 38% were women. The generational breakdown is as follows: 17% Gen Z, 47% millennials, 24% Gen X, and 12% baby boomers.
About AddictiveTips
At AddictiveTips, we want you to make the best decisions when it comes to your tech purchases, but we're also here to troubleshoot any problems you may encounter afterward. Visit us today for answers to all your tech questions.
Fair Use Statement
Are you currently debating with someone about whether Apple or Android is better? Feel free to send them this article. We just ask that you use this information for noncommercial purposes and that you provide a link to this source.
