

SolarWinds NetFlow Traffic Analyzer – Review 2024
The SolarWinds name is familiar to most network and system administrators. The company has built a solid reputation for itself by making some of the very best network and system administration tools. And as if that wasn’t enough, it is also famous for making super-useful free tools such as its Advanced Subnet Calculator or its TFTP server, each addressing a specific need of network administrators.
Today, we’re reviewing one of SolarWinds’ most popular products, a tool called the NetFlow Traffic Analyzer, or NTA. As its name suggests this is primarily a network traffic analysis tool which relies on the Cisco NetFlow technology to perform its magic.

Despite the fact that its name seems to indicate that all this tool does is NetFlow analysis, this is far from true. In fact, the platform supports most modern flow analysis technologies. And since the tool is an add-on to the SolarWinds Network Performance Monitor, you also get all the advantages of this excellent product.
Before we have a thorough look at the SolarWinds NetFlow Traffic Analyzer, we’ll briefly sidetrack and explain—or, at least, try to explain—what NetFlow is and how it works. We’ll also talk about a few alternatives to NetFlow that are commonly encountered and supported by this product. We’ll then have a look at the product’s primary features followed by its requirements and its installation. Then, we’ll briefly introduce the SolarWinds Network Performance Monitor before taking you on a quick guided tour of the NetFlow Traffic Analyzer. And finally, we’ll present the product’s pricing and available purchasing options.
Flow Analysis In a Nutshell
Flow analysis can give you a detailed, qualitative view of your network’s traffic. It won’t just show you that an interface is congested, it will show you WHAT is causing this congestion. Flow Analysis relies on networking devices to send traffic information to systems called collectors and/or analyzers which can, in turn, interpret flow data and present it in meaningful ways. The technology that permits this is called NetFlow. It was created by Cisco Systems several years ago but it is now commonly used in one form or another on networking equipment from most major manufacturers.
About NetFlow
NetFlow was developed by Cisco Systems and was introduced on their routers to provide the ability to collect IP network traffic as it enters or exits an interface. The collected data is then analyzed by network administrators or by an automated system to help determine the source and destination of traffic, the class of service, and the causes of congestion.
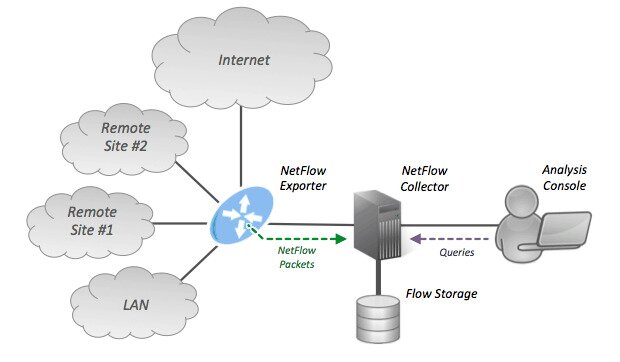
A typical NetFlow monitoring setup consists of three main components:
- The flow exporter aggregates packets into flows and exports flow records towards one or more flow collectors.
- The flow collector is responsible for reception, storage and pre-processing of flow data received from a flow exporter.
- Finally, the analysis application is used to analyze received flow data. Analysis can be used for traffic profiling, or for network troubleshooting.
How NetFlow Works
Routers, switches and any other device that supports NetFlow can be configured to output flow data in the form of flow records and send them to a NetFlow collector. A flow is a complete conversation in the IP sense. The device preparing flow records normally sends them to the collector when it determines that the flow is finished either through aging–there has not been any traffic within a specific timeout–or when it sees a TCP session termination.
The flow record contains a lot of information about the flow. It includes the input and output interfaces, the start and finish time stamps of the flow, the number of bytes and packets it contains, the layer 3 headers, the source and destination IP address and port number, the IP protocol, and the TOS value. Flow records don’t contain the actual data that made up the flow. The only contain information about the flow. This is important from a security standpoint.
Except in huge multi-site environment, the flow collectors where the records are sent are often also the flow analyzers. They use the information contained in flow records to present data about network traffic in a way that is useful to network administrators. Different NetFlow collectors and analyzers will have different ways of presenting data.
Some NetFlow Alternatives
As we’ve already hinted, NetFlow exists by several different names. But there are also alternatives to NetFlow, the two best-known are sFlow and IPFIX. The latter is heavily based on the latest version of NetFlow except that it is an IETF standard. We’re free to think that Cisco might even eventually replace NetFlow with IPFIX.
As for sFlow, it is a different, competing system. Its goal and general principles of operation are similar but different. Many NetFlow analyzers will also work with sFlow but, generally speaking, users of one don’t use the other.
The SolarWinds NetFlow Traffic Analyzer (FREE Trial Available)
The SolarWinds NetFlow Traffic Analyzer is simply one of the best flow analysis tools there are. It installs on top of the SolarWinds Network Performance Monitor, another great tool, and adds a unique set of information about your network’s traffic. You can use the tool for monitoring bandwidth usage by application, by protocol, and by IP address group. It will monitor Cisco’s NetFlow, IPFIX, Juniper’s J-Flow, sFlow, and Huawei’s NetStream flow data allowing it to identify which devices, applications, and protocols are the highest bandwidth consumers. It will also collect traffic data, correlating it into a usable format, and presenting it to the user through a web-based interface for monitoring network traffic. Furthermore, it can identify which applications and categories consume the most bandwidth for better network traffic visibility.

Main Features
Let’s have a deeper look at some of the SolarWinds NetFlow Traffic Analyser’s features
Network Usage Monitoring
The tool can identify users, applications, protocols, and IP address groups consuming the most bandwidth, as well as track conversations among internal and external endpoints. Its bandwidth monitoring and root cause identification is enhanced by using Cisco NBAR2 (next-generation Network-Based Application Recognition) to help identify common applications and application categories, Cisco WLC (Wireless LAN Controller) traffic monitoring to track the applications and users consuming wireless bandwidth, and the SolarWinds User Device Tracker to identify bandwidth hogs and their locations.
Traffic Patterns Analysis
The SolarWinds NTA collects traffic data, correlates it, and presents it on its web console. The tool can provide one-minute granularity and analyze historical data over months, days, and minutes. It supports drilling down to individual devices and interfaces.

Performance Analysis
The PerfStack performance analysis dashboard lets you drag and drop performance metrics onto a common timeline so you can visually correlate network behaviour across stacks and quickly find the root cause of many issues.
CBQoS Policy Optimization
When you depend on services like VoIP and cloud applications, intelligently prioritizing and managing traffic becomes critical. The SolarWinds NetFlow Traffic Analyzer lets you compare the effectiveness of pre- and post-policy traffic levels to determine if your QoS policies are working and prioritized traffic is flowing as planned.
Bandwidth Capacity Planning
Your capacity planning can be more insightful when you can see what your bandwidth utilization patterns are and identify key consumers. Reviewing history lets you identify patterns of peak usage. You can then adjust policies, forestall outages, and avoid buying additional bandwidth when it’s not needed.
Requirements
The SolarWinds NetFlow Traffic Analyzer is an add-on module to the SolarWinds Network Performance Monitor. It uses the NPM’s database and node management facilities. As such, the most important requirement is that you have the Network Performance Monitor installed and configured first.
NPM and NTA, as well a few other tools in SolarWinds’ network management suite, are built on a common back end, The Orion platform. It provides the unified user interface, centralized administration, and access control, and shared functionality for navigation, settings, alerts, and reports.
NTA and NPM both run on Windows. SolarWinds recommends using three servers:
- A Windows Server as the primary application server (also called the main poller). It hosts the web console and performs data collection.
- A Microsoft SQL Server for the Orion Database which stores collected performance, log, and configuration data.
- A Microsoft SQL Server for the Flow Storage Database which stores the flow data itself.
SolarWinds has a bunch of system requirements and best practices for good performance and best results on the website. This included recommendations for OS version, CPU speed and number of cores, amount of RAM, NIC speed, and disk-array configuration. The technical requirements vary depending on the number of network elements being monitored.
Product Installation
Installation of the NetFlow Traffic Analyzer is straightforward – once you have the prerequisites in place. As we just mentioned, for a production environment the recommendation is for three semi-dedicated servers with adequate hardware and certain system software pre-installed.
Since the NetFlow Traffic Analyzer is an add-on module of NPM, you must install that first. Once unzipped, the installer checks for prerequisites, installs missing system software and then launches the configuration wizard. The wizard will guide you through providing some required information, and it will then perform auto-discovery of the devices on your network.
Discovery will be more successful if the devices you want to monitor have already been configured to answer queries for metrics and periodically export flow data. You should enable SNMP and WMI on your network devices and monitored hosts. You’ll also want to enable the flow protocols supported by your various devices so they send flow data to the NTA.

Once discovery is complete, you need to select which of the discovered devices you want to import into the Orion database and begin monitoring. SolarWinds recommends you start with a limited number of key devices and servers, and then expand. (You can always see the list of known devices via navigating to My Dashboards > Network > Network Summary.)
Once the Network Performance Monitor is installed, you install the NetFlow Traffic Analyzer on the main application server following a similar process. A manual step is then required to move the flow storage database to its own server.
About The SolarWinds Network Performance Monitor
SolarWinds’ flagship product is the Network Performance Monitor or NPM. It is a full-featured network monitoring solution with great functionality. The SolarWinds Network Performance Monitor polls any enabled device using the SNMP protocol to read their operational metrics and interface counters. It stores the results in an SQL database and uses the polled data to build graphs showing each WAN circuit’s usage.
The SolarWinds Network Performance Monitor boasts a user-friendly GUI. With it, adding a device is as simple as specifying its IP address or hostname and SNMP community string. The tool then queries the device, lists all the SNMP parameters that are available, and allows you to pick those you want to monitor and display on your graphs.
A Guided Tour Of The SolarWinds NetFlow Traffic Analyzer
Most of the interaction with this tool is done through its web console. The home screen includes a list of tabs. The Home and Network tab are contributed by the underlying Network Performance Monitor while the other tabs come from the installed modules. For instance, the NetFlow Traffic Analyzer provides the NetFlow tab. Each tab boasts multiple views which use graphs, tables, and text to show details and statistics about the monitored elements of your network.
In the various views, network elements are colour coded. A red or partially red element needs attention; a yellow one indicates a warning. Also, several Top 10 lists (Network Top 10, Top 10 Interfaces by Percent Utilization, Top 10 Errors and Discards Today, etc) quickly highlight the elements of your network that suffer from issues. The Top Talkers lists are particularly useful for spotting potential bandwidth problems. The default view for the NetFlow Traffic Analyzer contains multiple sections like Top 5 Applications, Top 5 Endpoints, Top 5 Conversations, Top 10 Sources by % Utilization, etc.

Most graphics throughout the web console are interactive. Hovering over an element opens a popup with details about it. You can quickly filter out clutter to focus on relevant types of data and time ranges of interest. Such customized views can be saved for reuse.
Alerts are triggered when a problem is detected. They can be predefined alerts or custom ones manually configured. A node going down, for example, is a predefined alert. Alerts can also include things such as an interface going down or becoming overloaded. Triggered alerts show up in the Active Alerts section of the home screen. Alerts can also be sent out by email, SMS messaging or other means, depending on your personal preferences and operational needs. The ability to customize alerts is particularly useful for bandwidth. You can individually adjust the thresholds for receive and transmit percentage utilization and be notified of problems such as bandwidth hogs.

When investigating an element or alert, you can drill down into it to get more detailed status and metrics. This can help determine if this is a momentary problem or a persistent issue and will also help identify the root cause. For example. when a particular interface becomes a concern you can examine its details. You can also use Flow Navigator filters to create a custom view that focuses on devices, applications, and time periods of interest.
The SolarWinds NetFlow Traffic Analyzer makes it easy to identify users, applications, and protocols consuming the most bandwidth. You can sort the displays by port, source, destination, and protocols, and view traffic patterns spanning minutes, days or months.
The tool includes a wide array of predefined reports, as well as the possibility to create custom ones. These custom reports can process flow data into charts and tables showing how the network is being used and how that use is changing over time. Reports can be automatically run and delivered at a scheduled time.
Pricing
The SolarWinds NetFlow Traffic Analyzer is licensed based on the underlying Network Performance Monitor License. If you already own the Network Performance Monitor, you need to make sure the license level selection is the same for both products. If you do not already own NPM, keep reading for more options. Like NPM, NTA is available in five licensing tiers, based on the number of monitored nodes. Prices start at $1 945 for 100 nodes. If you don’t already have a SolarWinds Network Performance Monitor license, both products can be purchased together as the Network Bandwidth Analyzer Pack. If you want to give these two great products a test run and see first-hand what they can do for you, a free 30-day trial version is available from SolarWinds.