

6 Best Linux Monitoring Software & Tools for 2026
When Linus Torvalds released the first version of his Linux Kernel way back in 1991, nobody thought it would ever grow to what it has become. Today, Linux is everywhere and although it hasn’t made it very far as a mainstream desktop operating system, it is now commonplace on servers. Just like servers running any other operating systems, Linux servers need to be monitored. Today’s IT environments are so big and complex that monitoring tools are almost mandatory. But this post is not just about monitoring Linux servers, it is also about using Linux as a monitoring platform. We’ve searched the market for the best Linux monitoring tools and we’re glad to share the results of our efforts with our readers. Some of the best Linux monitoring tools can run on Linux — in fact, some won’t run on anything else.

We’ll start off our discussion by briefly talking about Linux, what it is, its history and its current state. Then, we’ll discuss the monitoring of Linux computers. We’ll try to determine if there are any differences between monitoring Linux hosts or computers running other operating systems. Since Linux is a popular platform for monitoring tools, this will be our next topic before we can finally get to the most interesting part, the best Linux monitoring software and tools.
A Word About Linux
Linux, in its most elementary form, is just an operating system kernel. That is the core component of an operating system which provides various services—such as memory, files, and task management—to other processes. By extension, it is the name we commonly give to operating systems based on the kernel but made of several extra modules that make it a complete computer operating system, one that can be used by humans. It is important to understand the difference between the Linux kernel and a Linux operating system. The Linux kernel is used in other operating systems such as Android, the most-used smartphone operating system.
As an operating system, Linux is not, functionally speaking, very different from any others such as Windows or OS X. The main difference between Linux and other popular operating systems is the fact the Linux is an open-source product. Many people tend to confuse open-source and free. It is true that open source software is often free but it is not necessarily the case. For instance, the Red Hat Enterprise Linux OS is not free. To add to the confusion, actors of the open-source movement often refer to open-source software as free software with free implying freedom rather than the absence of cost.
Over the years, Linux, which was once a rather marginal operating system installed by freaks and computer science students—I recall spending weeks downloading it one diskette image at a time over a 1200 baud connection; I guess I was one of those freaks—has grown to be a popular option as a server operating system.
Best Linux Monitoring Tools: Monitoring Linux Systems
Monitoring Linux, in its most basic expression, is very similar to monitoring any other operating system. After all, Linux is an operating system like any other (although it is also unlike any other). And when you consider that typical server monitoring has more to do with the hardware than the operating system, it’s easy to see why it is not too different.
However, the operating system is what monitoring tools use to read the hardware status. Some monitoring tools, for instance, use SNMP to fetch operational metrics from operating systems. Monitoring a Linux system via SNMP requires that the snmpd package is installed and running on it. snmpd is an SNMP agent which sits and waits for requests from SNMP monitoring tools. Upon receiving a request, it processes it, collects the requested information and returns it to the requester.
Other monitoring systems use a local agent to gather data. When selecting such a system to monitor Linux servers, it is important to ensure that an agent is available for your particular Linux distribution. Some agent-based monitoring tools can also use other data gathering methods and are often the best options in hybrid networks containing a mix of Windows computers which can be monitored with a custom agent and Linux ones that are monitored via standard means such as SNMP.
What to Monitor on a Linux System
Knowing which tool to use is only half the equation — you also need to know what to watch. Good Linux monitoring covers the following key metric categories:
- CPU utilization and load average: Track both instantaneous CPU usage and the 1/5/15-minute load averages. A load average persistently higher than your CPU core count signals a bottleneck.
- Memory and swap: Monitor RAM consumption and swap usage. Heavy swap activity is a strong indicator that the system is starved for physical memory.
- Disk space and disk I/O latency: Watch free space on all mount points and track read/write latency. A filesystem quietly filling to 100% will crash services with no warning.
- Network throughput and packet loss: Measure inbound and outbound bandwidth per interface, and flag any meaningful packet loss, which often points to hardware or upstream issues.
- Process count, thread count, and zombie processes: An unusual spike in process or thread counts, or accumulating zombie processes, frequently signals a misbehaving application.
- Systemd service health: Confirm that critical services are in an active/running state. A failed service may not produce any visible error unless you are actively checking unit status.
- Hardware sensors — temperature, fan speed, and power: On physical hardware, thermal readings and fan status are early indicators of impending hardware failure.
- Security signals — failed logins and firewall logs: Repeated SSH authentication failures or sudden spikes in firewall-dropped packets can indicate a brute-force attempt or a misconfigured application.
Setting Up Meaningful Alerts
Collecting metrics is only useful if someone is notified when something goes wrong. Below are concrete alert thresholds you can adapt to your environment as a starting point:
- CPU above 90% sustained for 5 minutes — a single spike is normal; sustained high usage rarely is.
- Root filesystem above 80% full — this gives you time to react before the system becomes write-locked at 100%.
- Critical service stopped or in a failed state — any service defined as essential should trigger an immediate page or notification.
- Five or more failed SSH login attempts within one minute from the same source IP — a reliable indicator of a brute-force attempt worth investigating.
- Disk I/O latency above 100ms consistently — abnormal disk latency degrades every service relying on storage and is worth catching early.
- Swap usage above 50% — by the time swap is fully exhausted, the system is already severely degraded.
Most of the monitoring platforms covered in this article support configurable thresholds for all of the above. The built-in Linux command-line tools in the next section let you verify these metrics on-demand without any additional software.
Linux As A Monitoring Platform
While Linux is a popular operating system for servers of all kind, it is even more so when it comes to running specific tools. In particular, there are several free and open-source network monitoring tools that will only run on Linux. And even if your tool of choice could run on Windows, wouldn’t it make more economic sense to run it on a free OS rather than waste money on a costly operating system?
Some people still don’t trust free and open-source software for mission-critical applications. They wouldn’t, for instance, put their precious corporate data on a SQL server running on Linux. But these people don’t usually have any objections to using the platform for running network administration tools.
One big advantage of using Linux as the underlying platform for the best Linux monitoring tools is that it is easy to set up a Linux server with only the required packages. While this can be done with Windows, it is considerably more complicated.
Our Top Best Linux Monitoring Software And Tools
Enough said about Linux, let’s have a look at the best tools we’ve found. As mentioned, our list has a combination of tools that can be used to monitor Linux servers and networks as well as network monitoring software that runs on Linux. Some of the tools combine both and can monitor Linux hosts while running on Linux. They are ideal for Linux-only shops.
1. SolarWinds Server And Application Monitor (Free Trial)
SolarWinds has been making some of the best network administration tools for some twenty years. It is highly regarded and its flagship product, the SolarWinds Network Performance Monitor, consistently receives top reviews as one of the best network bandwidth monitoring tools. SolarWinds is also famous for its free tools, smaller products each addressing a specific need of network administrators. The SolarWinds Advanced Subnet Calculator and the Kiwi Syslog Server are two good examples of those free tools.
As SolarWinds self-describes it, the Server And Application Monitor is a Windows-based “server monitoring software built to find and resolve application problems”. Using this tool, you will be able to monitor any server running any application, anywhere. It can be used to proactively monitor the performance, capacity, and health of Linux and Windows servers and applications across data centers, remote offices, and in the cloud.

The Linux server monitoring components of the Server and Application Monitor allow you to monitor, alert, and report on performance issues in your Linux servers. You can monitor resource utilization on your Linux servers. Receive alerts about CPU overloads, insufficient RAM, and storage issues, such as disks running out of capacity.
You’ll also be able to monitor the health of the hardware components in your Linux server, including temperature, fan speed, power supply, and more. You can receive alerts when server hardware components are in warning or critical states, potentially reducing server downtime due to hardware failure.
This comprehensive server monitoring platform features an easy to use and customizable web-based dashboard from where you can monitor over 1200 vendor applications, servers, databases, and storage. The SolarWinds Server and Application Monitor provides automated discovery and mapping of applications and infrastructure. It also has customizable monitoring templates, and pre-built alerts and reports.
Pricing for the SolarWinds Server and Application Monitor is based on the number of components, nodes, and volumes monitored and changes regularly — visit the SolarWinds website for current licensing costs. A free 30-day trial version is available for download, should you want to give the product a test run before purchasing it. As one of the best Linux monitoring tools available commercially, it’s worth evaluating for enterprise environments.
2. PRTG
The Paessler Router Traffic Grapher (PRTG) is another Windows-based tool which is ideal for monitoring Linux resources. It is one of the easiest and fastest tools to set up and Paessler claims you could be up and running within minutes. It is true that setting up the product is impressively fast, thanks in part to its auto-discovery feature which scans your network and automatically adds the components it finds.
The user interface (or rather interfaces) is another one of the software’s strong suits. You can choose between a native Windows console, an Ajax-based web interface, or mobile apps for Android and iOS. One of the unique mobile apps features will let you scan a QR code label affixed to your equipment to quickly view its status.
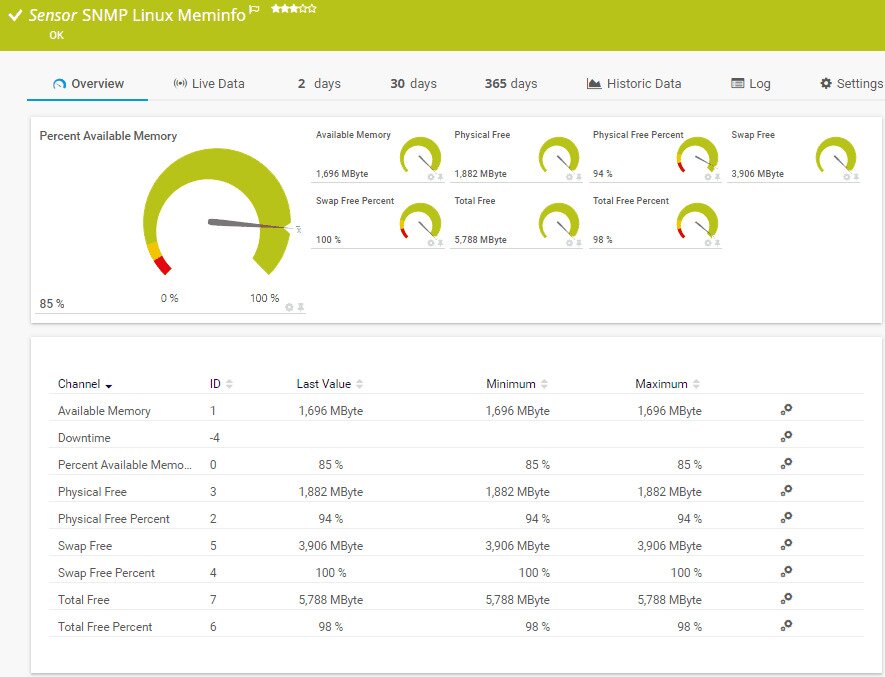
PRTG can monitor almost anything thanks to its innovative sensor architecture. You can think of sensors as add-ons to the product. However, the sensors are already built into the product. Customized Linux and Unix sensors are used to monitor Linux hosts without the need to install or modify anything. Linux servers are monitored using a combination of WBEM and SSH protocols. Data is sent via a secure connection to prevent sensitive information from being compromised during the sending of monitoring data.
PRTG‘s pricing is based on the number of sensors you’re using where a sensor is any parameter or metric you need to monitor. For instance, each interface monitored via SNMP uses up one sensor. Similarly, each Linux host uses a sensor. The product is available in a full-featured free version which is limited to monitoring 100 sensors. For more sensors, paid licenses are required, with pricing varying by sensor capacity — check the Paessler website for current rates. A free, sensor-unlimited 30-day trial is available for download.
3. Zabbix
Zabbix is a free and open-source product which can be used to monitor anything. Among the best Linux monitoring tools in the open-source category, Zabbix runs on a handful of Linux distributions—including Raspbian, the Raspberry Pi version of Linux—and it will monitor networks, servers, applications and services, and cloud-based environments. It features a highly professional look and feel, much like you’d expect from a commercial product.
Good looks are not enough to be on our list, though. Fortunately, this product also boasts a broad feature set, unlimited scalability, distributed monitoring, strong security, and high availability. It is a true enterprise-grade product.
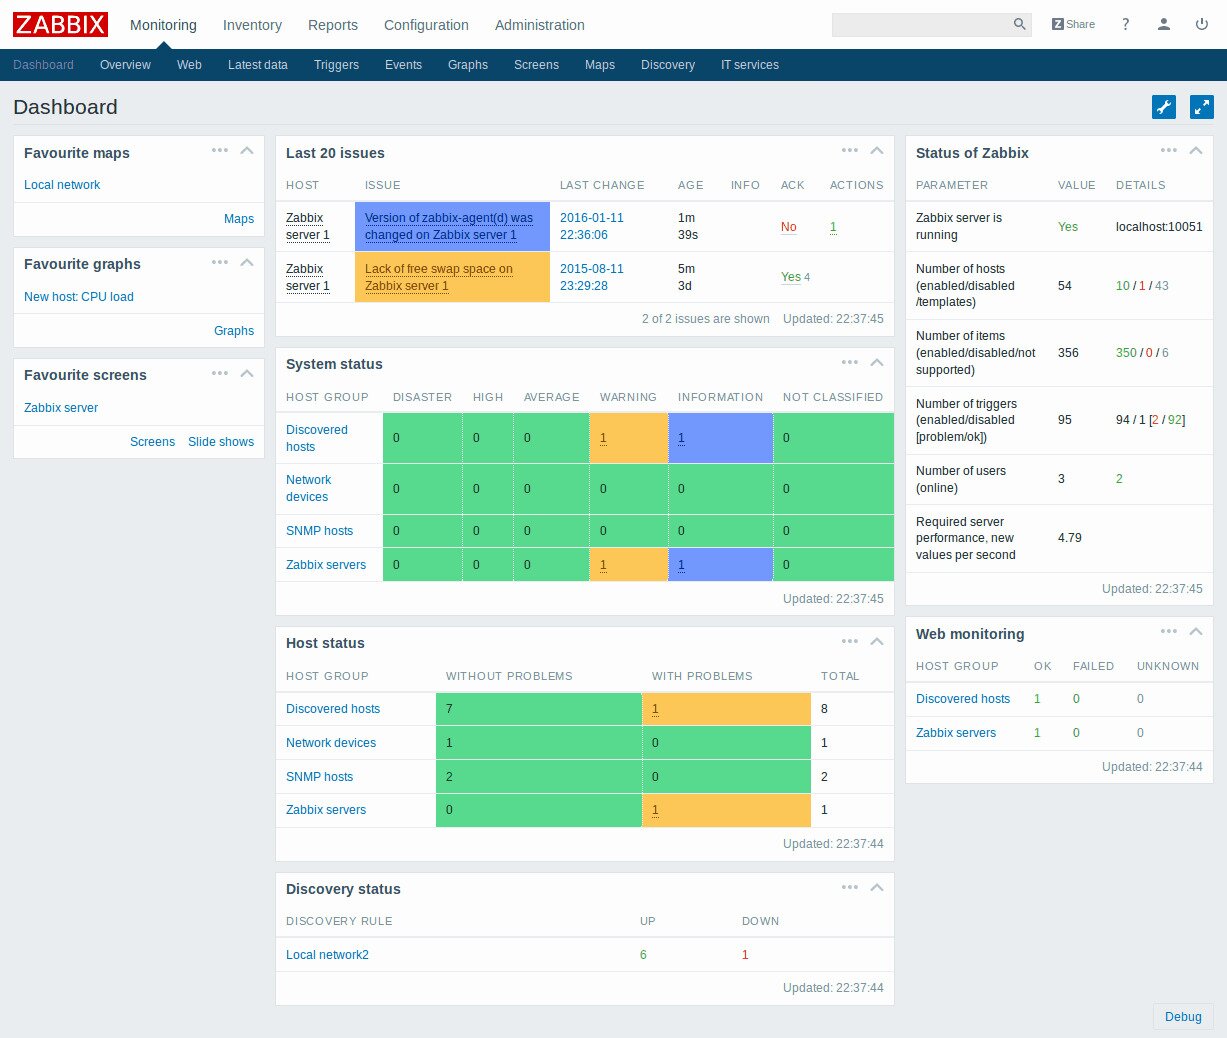
Zabbix uses a combination of monitoring technologies. It supports SNMP monitoring as well as the Intelligent Platform Monitoring Interface (IMPI). It can also do agent-based monitoring with agents available for most platforms. For easy setup, there’s auto-discovery as well as out-of-the-box templates for many devices. The tool’s web-based user interface has several advanced features such as widget-based dashboards, graphs, network maps, slideshows, and drill-down reports.
The product also features a highly customizable alerting system which will not only send out notification messages which contain runtime and inventory information but can also be customized based on the recipient’s role. It can as well escalate problems according to flexible user-defined Service Levels. You can even let Zabbix fix some issues automatically.
4. Nagios
There are two competing versions of Nagios available. There’s the free and open-source Nagios Core and there’s the paid Nagios XI. Both share the same underlying engine but the similarity stops there. Nagios Core is an open-source monitoring system that runs on Linux. The system is completely modular with the actual monitoring engine at its core. The engine is complemented by dozens of available plugins which can be downloaded to add functionality to the system. Each plugin adds some features to the core.
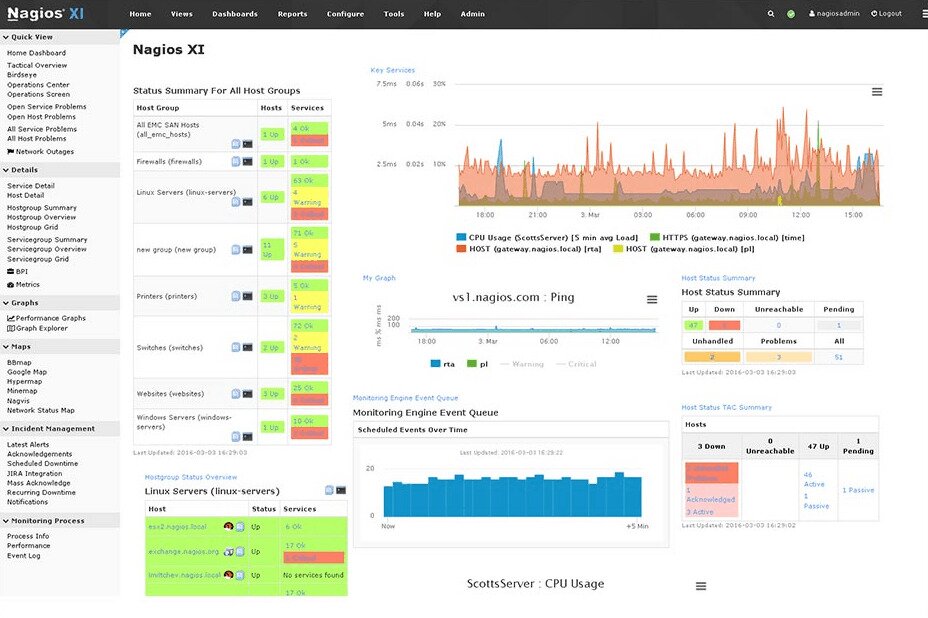
Preserving the modular approach, the tool’s front-end is also modular and several different community-developed options are also available for download. The Nagios Core, the plugins and the front end combine and make for a rather complete monitoring system. Considering that, it probably won’t surprise you much when I tell you that setting up Nagios Core can be a daunting task.
Nagios XI is a commercial product based on the Nagios Core engine. However, it is a complete self-contained monitoring solution. The product targets a wide audience from small businesses to large corporations. It is much easier to install and configure than Nagios Core, thanks to its configuration wizard and auto-discovery engine. Licensing is tiered by node count — visit the Nagios website for current pricing on the edition that fits your environment.
5. Netdata
Netdata is one of the most actively maintained real-time monitoring tools available for Linux today, making it a strong replacement for older community platforms that have since lost momentum. It installs in seconds with a single command and immediately begins collecting thousands of metrics — CPU, memory, disk I/O, network, processes, and systemd services — with no additional configuration required.
What sets Netdata apart is its per-second granularity. Where most monitoring tools poll every minute or more, Netdata updates its dashboards every second, which makes it exceptionally useful for diagnosing short-lived performance spikes that traditional tools would miss entirely. The interactive web dashboard is clean, fast, and requires no external database to get started.
Netdata also supports alerting out of the box, with hundreds of pre-built health checks that cover the most common failure scenarios on Linux hosts. For teams operating at scale, Netdata Cloud provides centralized visibility across multiple nodes. Whether you are running a single homelab server or a fleet of cloud instances, Netdata is one of the fastest paths to genuine Linux observability currently available.
6. Cacti
We had to include Cacti on this list of best Linux monitoring tools. After all, it is one of the oldest free and open-source monitoring platforms. And it is still quite popular to this day. While it might not be as feature-rich as some commercial—and even some open-source—products, it is still an excellent tool. Its web-based user interface has somewhat of a vintage feel—don’t expect any HTML 5 animations—but it is well laid out and easy to understand and use. Cacti is comprised of a fast poller, advanced graphing templates, and multiple acquisition methods. While the tool primarily relies on SNMP polling, custom scripts can be devised to get data from virtually any source.
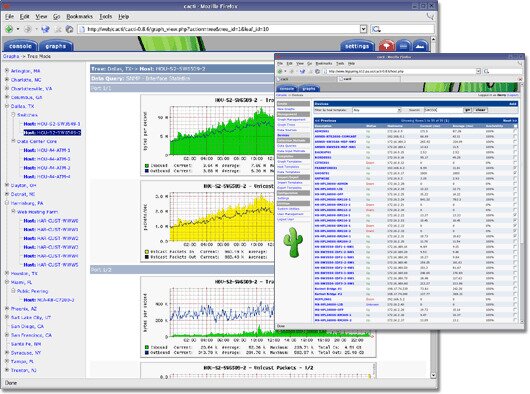
This tool’s main strength is in polling devices to fetch their metrics and graphing the collected data on web pages. It truly does an excellent job of that but that’s about all it will do. However, if you don’t need alerting, fancy reports or other extras, the product’s simplicity might be just what you need. And if you need more, Cacti is entirely written in PHP, making it highly customizable. You could easily adapt it to your specific needs and add the missing features you require.
Cacti makes extensive use of templates which account for an easier configuration. There are device templates for many common types of devices as well as graph templates. There’s also a huge online community of users who write custom templates of all kinds and make them available to the community. Many equipment manufacturers also offer downloadable Cacti templates, making it one of the most community-supported best Linux monitoring tools available today.
Linux Monitoring Tools by Use Case
Not every monitoring situation calls for a full-stack platform. Sometimes you need answers in thirty seconds, not a dashboard. The tools below are grouped by the job they are best suited for, so you can reach for the right one immediately.
Command-Line and Live Troubleshooting Tools
These are the utilities built into or easily installable on virtually every Linux distribution. They require no server infrastructure, no database, and no configuration file — just a terminal session. When something goes wrong at 2 a.m., these are what you reach for first.
- top / htop: Both display a real-time, sortable view of running processes alongside overall CPU and memory usage. htop adds color coding, mouse support, and per-core CPU bars, making it the preferred choice for interactive troubleshooting. Use it when you need to identify which process is consuming the most CPU or memory at a glance. Example: a web server has gone unresponsive — open htop, sort by CPU, and you will immediately see if a runaway PHP-FPM worker or database process is the culprit.
- vmstat: Reports on virtual memory, CPU scheduling, block I/O, and system activity in a compact, continuously-updating table. It is particularly good at showing you whether your CPU time is being lost to I/O wait, which points to a storage bottleneck rather than a compute one. Run
vmstat 2to get a new reading every two seconds. - iostat: Part of the sysstat package, iostat breaks down read and write throughput and latency per disk or partition. Use it when vmstat shows high I/O wait but you need to know which specific device is the bottleneck. Example:
iostat -xz 2will show you per-device utilization and average service time in milliseconds, making it easy to spot a degraded drive. - iotop: Think of iotop as top, but for disk I/O. It shows you per-process read and write rates in real time. This is the tool to reach for when iostat confirms that disk throughput is saturated but you need to identify exactly which process is responsible. Example: a backup job running at the wrong time may silently saturate your disk I/O and degrade every other service — iotop will surface it in seconds.
- iftop / ss: iftop provides a live, per-connection view of network bandwidth consumption, showing which hosts your server is talking to and how much data is flowing. ss (the modern replacement for netstat) is better suited to investigating connection states. Example: use
ss -tnpto quickly see all established TCP connections and the processes that own them — invaluable when you are investigating a sudden spike in open connections or trying to confirm that a service is actually listening on the expected port. - df / du: df reports free and used space on every mounted filesystem with a single command (
df -h). du drills down into directory trees to show where space is actually being consumed (du -sh /var/*is a common starting point). Use these together when a disk-full alert fires and you need to find the offending directory quickly. - journalctl: The primary interface to systemd’s journal log, journalctl lets you query logs by service, time range, priority, and more. Example:
journalctl -u nginx --since "1 hour ago"will show you everything the nginx service has logged in the last hour. Usejournalctl -p err -bto see all error-level messages from the current boot — a fast way to triage a system that has just been restarted after an unexpected crash.
Full-Stack Server Monitoring Platforms
When you need persistent visibility across multiple hosts with historical data, dashboards, and alerting, the platforms covered earlier in this article — SolarWinds SAM, PRTG, Zabbix, and Nagios — fit this role. They are designed to run continuously, poll metrics on a schedule, store history, and notify teams when thresholds are crossed. Choose this category when you are responsible for more than a handful of servers and need a centralized view of your infrastructure’s health over time.
Metrics and Log Dashboards
This category covers tools that specialize in ingesting, storing, and visualizing large volumes of metric and log data — often across distributed or containerized environments. See the next section for a dedicated look at these modern options.
Modern Linux Monitoring for Containers, Cloud, and Logs
The classic approach to Linux monitoring — polling a server every minute for CPU and memory — works well for a static fleet of bare-metal machines, but it starts to break down in containerized and cloud-native environments where workloads are short-lived, services scale horizontally, and the volume of log data is orders of magnitude higher. Modern Linux monitoring increasingly means tracking service-level metrics, short-lived container processes, and structured log streams alongside the traditional host-level checks. The tools below have become the standard answer to that challenge.
Prometheus and Grafana
Prometheus is an open-source time-series metrics database and scraping engine that has become the de facto standard for monitoring Linux hosts, Kubernetes clusters, and containerized workloads. It works by pulling metrics from instrumented targets at regular intervals and storing them in a high-efficiency local database. Prometheus ships with a powerful query language (PromQL) that lets you slice and aggregate metrics in ways that static dashboards cannot match.
Grafana is almost always deployed alongside Prometheus as its visualization layer. It connects to Prometheus (and dozens of other data sources) and lets you build rich, interactive dashboards that update in real time. Together, Prometheus and Grafana form the backbone of the modern Linux observability stack. They are especially well-suited to environments where you need to track per-container resource usage, custom application metrics, and service-level indicators across a dynamic fleet of hosts. Both tools are free and open-source, with hosted cloud options available if you prefer not to manage the infrastructure yourself.
Netdata
Already covered in the tools list above, Netdata deserves a second mention here because it occupies a unique position in the modern monitoring stack. Unlike Prometheus, which requires you to set up scraping targets and write PromQL queries before you see meaningful data, Netdata delivers a fully populated, per-second-resolution dashboard immediately after installation — with zero query writing required. For teams that want rapid visibility into a Linux host without committing to a full Prometheus/Grafana deployment, Netdata is often the fastest path to actionable monitoring.
Graylog and the ELK Stack
Host metrics tell you about resource consumption, but logs tell you what your applications are actually doing. Graylog is an open-source centralized log management platform that ingests, indexes, and searches log data from any number of Linux hosts or containers. It ships with a clean web interface, structured search, stream-based alerting, and dashboards. For organizations already invested in the Elastic ecosystem, the ELK stack (Elasticsearch, Logstash, and Kibana) provides a similar capability with greater flexibility and a larger community of plugins and integrations.
Both options shine in environments where systemd journal logs, application logs, and security logs from dozens or hundreds of systems need to be correlated in one place. Running journalctl on a single host is fine for quick triage, but when you need to search across your entire fleet for a specific error message or trace a security incident, a centralized log platform is essential.
Monit for Process and Service Monitoring
Monit is a lightweight, standalone process and service monitoring daemon that fills a gap the larger platforms often leave: automatic remediation. Where Prometheus and Zabbix will alert you that a service has stopped, Monit will attempt to restart it automatically based on rules you define. It can monitor processes, files, directories, filesystems, network connections, and system resources, and it can execute corrective actions — restarting a service, sending an alert, or running a custom script — without any external dependency. Monit is particularly popular in smaller deployments and homelabs where a full-stack monitoring platform would be overkill but basic self-healing behavior is still valuable.