

9 Best Network Troubleshooting Tools We Reviewed in 2026
It seems like everyone blames the network for any possible issue they encounter with computers. There’s a reason for that though: It often IS the network. The fact is that networks are complex and a lot happens on a typical network. And with a lot happening, a lot can go wrong. So, when something does go wrong–and it eventually will–you need to start troubleshooting. And just like with any other task, efficient troubleshooting requires the use of the proper tools. Today, we’re discussing the best network troubleshooting tools.

We’ll start off with a general discussion on network troubleshooting. What it is, why it’s necessary and how to approach the task. The, we’ll jump right in and introduce our top nine best network troubleshooting tools. As you will see, not all of our favorite tools are elaborate, multi-thousand dollar tools. Some are plain old command-line tools included with most operating systems. In fact, we’ve tried to keep a good balance of command-line vs GUI tools. Our selection of tools work together to form what we believe to be a great toolset that will help you with most troubleshooting scenarios.
About Network Troubleshooting
Efficient network troubleshooting requires a systematic approach. You start with basic symptoms or user complaints and work your way in to pinpoint the source of the problem. Once you do find it, fixing it is often a piece of cake. The main difficulty is usually finding the issue. Networks are big and complex things so, where to start?
Your best bet is often to look at recent changes. Assuming that your network is properly set up, it won’t break by itself. Unlike a car or other mechanical device, a network is not subject to wear and tear that could cause it to eventually break. Most of the time, when something starts going wrong, it’s because something has changed. That doesn’t necessarily mean that the network has changed. It could be its usage that is different. For instance, a single user could be downloading a huge file from the Internet and cause everyone else to experience degraded Internet performance.
The most basic golden rule of troubleshooting anything–not just networks–could save you a lot of time and grief: Make no assumption. In particular, don’t assume that users are telling you everything–or even that what they’re telling you is true. Verify everything yourself.
The 9 Best Network Troubleshooting Tools
As for the tools one can use to troubleshoot networking issues, there are so many of them that we could write an entire book about them. In fact, numerous books have been written on the subject. For today, we’ll concentrate on what we’ve found to be the most useful tools. You probably already know a few of them but might not have realized how they can help with troubleshooting. Other tools on our list have no other purpose than to help with troubleshooting.
1. SolarWinds Engineer’s Toolset
Our first entry is the Engineer’s Toolset from SolarWinds. In case you don’t know the company, SolarWinds makes some of the best network and system administration tools. Its flagship product, the Network Performance Monitor, is one of the very best network monitoring tools. SolarWinds is also famous for making a handful of excellent free tools a few of which were recently reviewed when we discussed the best subnet calculators or the best TFTP servers.
But today, we’re talking about the SolarWinds Engineer’s Toolset. As its name implies, this is not a tool but rather a complete set of tools. The Engineer’s Toolset includes over 60 different tools. It has a bit of everything. Through automated discovery, the tool will discover all your networking devices including in-depth details such as switch port mappings. While this won’t help you much with your troubleshooting efforts once issues arise, they can improve your knowledge of the network which can prove invaluable when troubleshooting.

This toolset has some great dedicated troubleshooting tools. Tools like Ping Sweep, DNS Analyzer and TraceRoute can be used to perform robust network diagnostics and quickly resolve complex network issues. And if your concerns are with security, you can use some of the toolset’s tools to simulate attacks on your network and help identify vulnerabilities.
The Engineer’s Toolset also has some excellent monitoring and alerting features. It will monitor your devices and raise alerts when it detects availability or health issues. This can often give you time to react before users start calling to complain. And if that ain’t enough, you can also use some of the included tools for configuration management and log consolidation.
With all these features, the SolarWinds Engineer’s toolset is not free. Pricing starts at $1 495 and is per seat, requiring one license per named user. If you’d want to give this toolset a try, a free 30-day trial is available from SolarWinds.
A Handful Of Useful Command-line Tools
Some of the most useful network troubleshooting tools are built right into most operating systems. They might not strike you as troubleshooting tools but, as we’re about to see, each can provide some valuable insight onto what could be wrong with your network.
2. Ping
Ping is really the most basic of all troubleshooting commands. It doesn’t do much but what it does is so useful that it is included with every single operating system. Technically speaking, Ping just sends ICMP echo request packets to the target and waits for it to respond by sending back ICMP echo reply packets. This process is repeated a certain number of times–5 by default on windows and until it is stopped by default under most Unix/Linux implementations–allowing it to collect statistics. Ping calculates the delay between each request and its reply and displays as the round trip time. On Unix variants, it usually also displays the value of the reply’s TTL field, Providing an indication of the number of hops–or routers–between the source and the destination.
As a troubleshooting tool, Ping can be your first step. Say, for example, that a user complains of slow response from the corporate intranet. By running a Ping of the intranet web server from that user’s workstation, you can quickly have a first diagnostic. If the Ping statistics show a slow response time, chance are you have a network problem. On the other hand, it pings are normal, perhaps it’s the server that is not responding quickly enough. No matter what, it give you a starting point for further debugging.
3. Tracert/Traceroute
Depending on whether you’re coming from the Windows or the *nix world, you’ll know this command-line tool as either Tracert or Traceroute. They’re almost identical and serve the exact same purpose. The command, which you launch by giving it a destination IP address, will display a list of every router that has to be traversed between the computer you’re issuing the command from and the destination IP address.
As a troubleshooting tool, Tracert is just as useful as Ping. Modern networks are often built with resiliency and redundancy with multiple paths between any two points. When one of several paths go down for whatever reason, traffic will automatically be rerouted through a different path. This different path may degrade performance.
Another useful feature of Traceroute is that, just like Ping, it will display some response time statistics for each hop. This makes it an invaluable tool to use to pinpoint the location of any network slowness or congestion. For each hop, Traceroute will show you the minimum, average, and maximum response times.
4. Ipconfig
Ipconfig is another command-line tool that is included with most operating systems. The command is used to display information on the IP protocol stack of the computer where you run it. Various switches or command-line options will allow you to display more or less details.
By default, the command will list display the IP address, subnet mask and default gateway associated with each network interface installed on a computer. Adding the /all option will display considerably more information. It will, for instance, give you the MAC address of each interface. It will also indicate if the IP address and configuration was done manually or through DHCP. And in the case of DHCP, it will tell you the details about the DHCP server and lease.
Ipconfig has another utility beyond providing information about the local machine. Some of Ipconfig’s command-line switches will cause some parameters to be reset or modified. DHCP leases can be modified by using the commands ipconfig /release and ipconfig /renew. The former will release the current DHCP lease while the latter will request a new IP address from the DHCP server. As another example, the command ipconfig /flushdns can be used to clear the DNS name resolution cache.
5. Netstat
One of the problems with troubleshooting TCP/IP connectivity issues comes from the huge number of connections and services on any system. Netstat can help you identify the status of each connection and which services are running, helping you you narrow down the search. Netstat, which is available on most operating systems, can quickly provide details about client services and TCP/IP communications.
Issuing the command displays all active connections on the local computer, both incoming an outgoing. Furthermore, Netstat can also display listening ports on the computer where it’s run. Netstat is a command that accepts many options. And to make thing more confusing, options differ between platforms. For instance, Netstat -b on Windows would display the name of the executable associated with each connection whereas on OS X or BSD, it is used in conjunction with -i to display statistics in bytes.
The best way to learn about all the available parameter of your specific version on Netstat is to run it with the -? option to display the tool’s help screen. On *nix systems, you can display the Netstat man page to get the same information.
6. Nslookup (And Dig)
The last of our command-line tools are called Nslookup and Dig. Why two different tools? We’re about to explain. Nslookup and Dig are used to verify DNS resolution. The Domain Name Service, or DNS, is a service used by computers to resolve hostnames such as www.microsoft.com to IP addresses. Incorrect DNS resolution—where a DNS server will return an erroneous IP address—is a common problem although it is often overlooked.
The Nslookup command is usually followed by a hostname and will return the corresponding IP address. One of the drawbacks of Nslookup as a troubleshooting tool is that, although it will by default interrogate the DNS server configured locally, it doesn’t use the operating system’s name resolution libraries. Therefore, Nslookup could return correct information even when the computer’s name resolution system won’t work.
To circumvent this problem, Dig was created. Although its syntax is somewhat different–especially when using advanced options, Dig serves essentially the same purpose as Nslookup but it uses the operating system’s libraries. The main drawback of Dig is that it’s not included in most operating systems although it comes with Bind–the ISC DNS server software–which can be downloaded from the ISC’s website.
7. Sysinternals Tools
Sysinternals is not really a product. It’s a website that is now part of Microsoft TechNet. Sysinternals is on our list because it has a handful of useful network troubleshooting tool. Overall, the site has over 60 different tools that can be downloaded but not all of them are for network troubleshooting.
Among the most interesting tools from Sysinternals is Piping which is an improve version of Ping that you can use to measure network performance. This is a command-line tool just like Ping but it offers more options such as the possibility to do Pings using TCP packets instead of ICMP. This could prove to be a better test than the standard Ping as ICMP requests are not always treated the same was as TCP.
Another useful tool from Sysinternals is called TCPView, a Windows program that will show you detailed listings of all TCP and UDP endpoints on your system, including the local and remote addresses and state of TCP connections. On older versions of Windows, TCPView also reports the name of the process that owns the endpoint. TCPView is similar to Netstat discussed above. However, it offers a more informative and conveniently presented subset of Netstat.
8. Wireshark
Packet sniffers are a special kind of troubleshooting tool that let you examine network traffic in great depth. They are the microscopes of network troubleshooting tools. Packet sniffers do two things. First, they capture every single packet that comes in or goes out of a network interface. But more importantly, packet sniffers offer powerful analysis tools that will decode packet headers, reassemble conversations and provide a welcome insight on what is going on on your network.
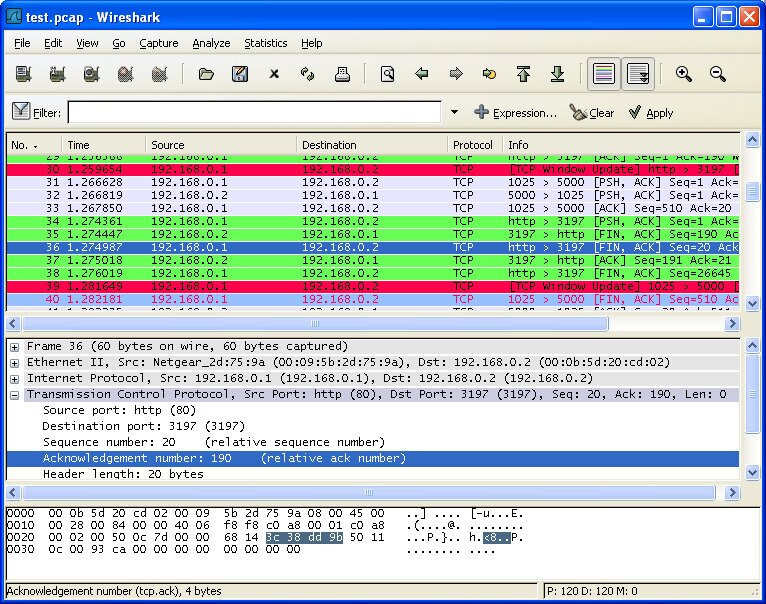
When talking about packet sniffers, Wireshark, a free and open-source tool, seems to be the reference. It has become the standard that many other tools—even commercial ones—want to emulate. The tool is particularly famous for its powerful analysis capabilities. Many administrators use command-line utilities such as tcpdump or Windump to capture traffic because they are already present on the systems where they want to capture traffic. They then load the capture file into Wireshark for analysis. In addition to its analysis capabilities, Wireshark’s filters are another impressive feature of the product. Using filters, one can zero in on exactly the data they’re interested in, making analysis simpler.
Wireshark has a steep learning curve but it is well-worth learning. It is one of the most useful of troubleshooting tools. It’s been around for almost twenty years and has been ported to most major platforms.
9. Nmap/Zenmap
Nmap, which stands for Network Mapper, is a scanning tool used to discover hosts and services, thus building a “map” of the network, hence its name. Nmap works by sending specially crafted packets to the target host(s)–sort of like Ping–and analyzing the responses.
Nmap’s primary use is in analyzing what services are available on a computer. It will discover hosts and their services and detect their operating system. Through scripting, the tool can be used for advanced service detection, vulnerability detection, and more.
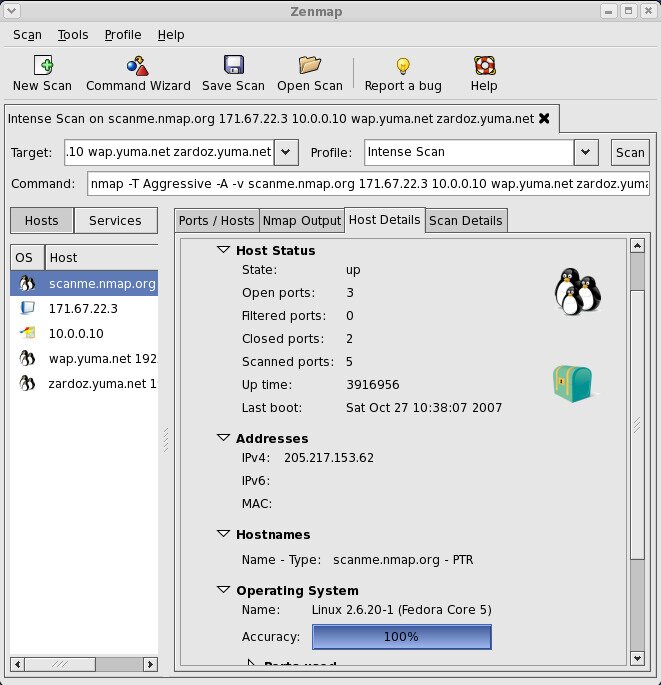
Nmap, which is a command-line tool started as a Linux-only utility but it has since been ported to several other operating systems including Windows, Solaris, HP-UX, most BSD variants including OS X, AmigaOS, and IRIX. If you prefer graphical user interfaces, several GUI front-ends to Nmap have been released. The best one goes by the name Zenmap and it is from the same team as Nmap. Zenmap, when compared to Nmap is much easier to learn and master, thanks to its well-designed user interface. It might not be the prettiest tool but it has some great functionality.
Conclusion
This was just a sample of what we found to be the best–or the most useful–network troubleshooting tools. There are plenty of other tools available and to be totally honest, we didn’t try them all. In fact, there are possibly a lot of tools we don’t even know. And the best tool for one troubleshooting scenario might not be the best in a different context. So, there is not one best tool that will fit all needs. Your best bet is to have as many as possible available and to learn how to use them before you need to.