

6 Best PingPlotter Alternatives for Network Troubleshooting
PingPlotter is a nifty network troubleshooting utility that definitely enjoys a lot of popularity among network administrators. To summarize the tool in one sentence, we could say that it is a network diagnostic tool that graphs latency and packet loss between your computer and a target. Visualizing the information accelerates your troubleshooting process and can help build a case if you ever need to convince someone that a problem exists on their end. There are, however, many tools which, although they are different, provide the same type of information and/or let you achieve the same goals. This is what this post is all about. We’ve assembled a list of some of the best PingPlotter alternatives and we’re about to briefly review each one.

Before we begin, though, and reveal what the best alternatives are, we’ll spend some time looking at PingPlotter in greater details. After all, it helps to know what we’re trying to find alternatives for, doesn’t it? Once we’re done with the introductions, we’ll discuss the traceroute utility. Despite its name and as you’re about to see, PingPlotter is more of a traceroute than a ping tool and so are its alternatives. We’ll explain what traceroute is, where it’s coming from and how it works. This background knowledge will you help better appreciate our upcoming reviews. With all this behind us and once we’re all on the same page, we’ll be ready for the interesting part, the actual PingPlotter alternatives. We’ll introduce you to our top pick and present their main features.
About PingPlotter
As we just said, despite its name, PingPlotter is actually a traceroute utility. The confusion is understandable, though, as traceroute is somewhat of an extension of ping. I might be oversimplifying things but you’ll understand when we discuss traceroute in a moment. Back to PingPlotter, it is a tool whose primary purpose is to find out if network problems are caused by local networks, the service provider you’re working with, or something in between.
Concretely, PingPlotter is a graphical traceroute software which can help solve network problems. It will graph network performance at every hop between your computer and a target website, server, or device. If it’s on the network, PingPlotter can ping it. The real usefulness of this tool is how it shows you where traffic starts getting worse, thereby saving you a ton of diagnostic time.

The tool will also let you explore performance history. Contrary to most network performance monitoring tools which only tell you the network failed–or didn’t fail–during the test. PingPlotter’s timelines provide a deeper level of understanding. They show exactly when issues occur. This enables you to distinguish between consistent failure throughout the test and a short period of severe failure, something standard network monitoring tools can’t do.
Another common use for the tool is collecting and presenting compelling evidence. Sometimes, telling a service provider about a network problem on their end isn’t enough to get their help. PingPlotter can help strengthen your case by proving an issue is located within your supplier’s domain. And the tool’s built-in sharing ability makes it easy to get information in front of anyone
Traceroute In A Nutshell
The definition of traceroute from Wikipedia is pretty straightforward: “Traceroute is a computer network diagnostic tool for displaying the route (path) and measuring transit delays of packets across an Internet Protocol (IP) network”. As good as that description is, it fails to give much detail on what it is concretely. Let’s explain. Traceroute will tell you the IP address of every router located between your computer and the remote computer. In addition to that, traceroute will also report on the response time of each of these routers.
Traceroute is a very old tool. The first version was released back in 1987. That is over 30 years ago. This is an eternity in computer years. Despite its venerable age, it is also—and still—a very common tool. First introduced on the Unix operating system, it is now present on every Unix-like OS including Linux and OS X. It even eventually got ported to the Windows platform where it was renamed to tracert when filenames couldn’t be more than eight characters long.
Traceroute is a tool that almost every network administrator understands and uses. However, some users don’t completely understand how it works and can, therefore, run into some of the utility’s pitfalls. For example, a network path could be asymmetrical with traffic in taking a different route than traffic out and the traceroute wouldn’t see it.
How Does It Work?
Any IP network, including the Internet, is made of interconnected routers. They talk to each other, exchanging information about what networks they know how to reach. They use this information to build routing tables. Whenever a data packet reaches a router, it looks up its destination in its routing table and proceeds to send it to the next router on the path. The router only knows about the next router and has no idea of the complete path. It doesn’t have to.
In order to limit propagation delays due to excessive routing hops—and protect against routing loops, the header of every data packet contains a field of data called the TTL or Time To Live. Oddly, the TTL is not at all a measure of time but of distance instead. When a packet leaves its origin, the TTL is set to 32. From then on, every router that handles it decrements the TTL by one before routing the packet. When the TTL value reaches zero, the router will not route the packet and will instead return an ICMP “Time Exceeded” message back to the origin.
Traceroute exploits this error detection and reporting mechanism to perform its magic. Traceroute first sends a packet to the destination with the TTL set to 1. The very first router on the path will decrement the TTL and return the Time Exceeded message, allowing traceroute to learn about the IP address of that first router–or hop, as it is often referred to. Traceroute will then send another packet with the TTL set to 2 and learn about the second hop. And it will keep doing that, incrementing the TTL each time until it eventually gets a response from the destination, telling it that it has been reached.
Traceroute typically also calculates the time it takes to get each successive response, allowing it to build a table of the response time for each hop. It will often also do a reverse DNS lookup of each hop’s IP address and display each host’s FQDN instead of IP address in its results.
The Best PingPlotter Alternatives
We’ve scoured the market for the best PingPlotter alternatives. What we’ve come up with is a list of advanced traceroute tools. Some of the products on our list are radically different from PingPlotter. Others offer more minor improvements. We have found plenty of tools out there. Those that made our list either have the best feature set and/or reputation or are the most used.
1. SolarWinds Engineer’s Toolset (Free Trial)
SolarWinds is a well-known name in the field of network management tools. The company makes some of the best monitoring tools, starting with its flagship product, the Network Performance Monitor. It is a complete network monitoring solution with numerous bells and whistles that consistently receives rave reviews. SolarWinds also has a solid reputation for making great free tools that address specific needs of network administrators. The SolarWinds TFTP server or the Kiwi Syslog Server are tow examples of these free tools.
The SolarWinds Engineer’s Toolset is actually a bundle of over 60 different network and system administration tools. It includes an excellent traceroute tool that will trace the route of a network path to diagnose response-time problems and isolate segment failures, display the domain names and response time for each hop, and use ICMP to diagnose performance issues along the network path in real-time. It can use SNMP to fetch additional data including information such as machine type, ISO level, and boot time on each device on a network path. Finally, it will help you diagnose a problem between source and destination and see the detailed, real-time response at each point on the path.

The Engineer’s Toolset features a centralized dashboard lets you easily access any of the included tools. Among the different tools you’ll find, some—such as the advanced traceroute—can be used to perform network diagnostics and help resolve complex network issues quickly. Other tools that can be used to simulate attacks on your network and help identify vulnerabilities.
The SolarWinds Engineer’s Toolset also includes several monitoring and alerting tools including, for instance, one that will monitor your devices and raise alerts when it detects availability or health issues. This will often give you enough time to react before users even notice the problem. To complete an already feature-rich suite of tools, configuration management and log consolidation tools are also included.
While this might not be the place to go in details on each tool, here’s a list of some of the best ones you’ll find in the SolarWinds Engineer’s Toolset besides traceroute.
- Port Scanner
- Switch Port Mapper
- SNMP sweep
- IP Network Browser
- MAC Address Discovery
- Ping Sweep
- Response Time Monitor
- CPU Monitor
- Interface Monitor
- Ping
- Router Password Decryption
- SNMP Brute Force Attack
- SNMP Dictionary Attack
- Config Compare, Downloader, Uploader, and Editor
- SNMP trap editor and SNMP trap receiver
- Subnet Calculator
- DHCP Scope Monitor
- IP Address Management
- WAN Killer
The SolarWinds Engineer’s Toolset—including traceroute—sells for $1495 per administrator seat. If you consider that it includes over 60 different tools, it is quite a reasonable price. If you want to see for yourself what this toolset can do for you and your organization, a free 14-day trial available from SolarWinds.
2. SolarWinds Traceroute NG (Free Download)
If you’re not ready to shell out over a thousand dollars, SolarWinds has another tool you might want to try called TracerouteNG. It is one of the free tools we mentioned before. It leverages the SolarWinds Netpath technology to offer continuous TCP and ICMP tracing. It claims to be faster than other traceroute utilities and to return results in mere seconds. Of course, this mostly depends on the network.
But Traceroute NG not only improves on the speed of traceroute. It also returns quite a bit more information, giving you a deeper insight into the situation. As such, it compares favourably to PingPlotter and offers similar functionality. For each hop, this tool uses ping to return the packet loss percentage, the current and average response time as well as a latency bar graph. It also performs a reverse DNS lookup to find and display the Fully Qualified Domain Name, or FQDN, of each hop.

Another great feature Traceroute NG has is the automatic detection of path changes. And if there are multiple paths to a given host, the tool will figure it out and display each path individually. This is very useful—if not essential—when troubleshooting load-balanced environments. The tool will also let you choose to perform the test using either TCP or ICMP packets. This can come in handy when some device along the path blocks ICMP. And last but not least, Traceroute NG will write the results of its test to a .txt log file. Although Traceroute NG runs on Windows only, it is mostly a text-based tool. But then again, would a GUI increase the tool’s usefulness? Probably not.
The tool, which is downloaded as a .zip file requires no installation but it relies on Winpcap which must be installed if it’s not already present on your computer. Traceroute NG, however, will detect its absence when it starts and will automatically launch the Winpcap installer which is included in the downloaded .zip file.
3. Open Visual Traceroute
If what you’re after is a true GUI-based traceroute tool, Open Visual Traceroute is what you need. The tool, which is available for Windows, most Linux distributions or Mac OS X is simply amazing. The tool is free and open-source, released under the LGPL V3 license.
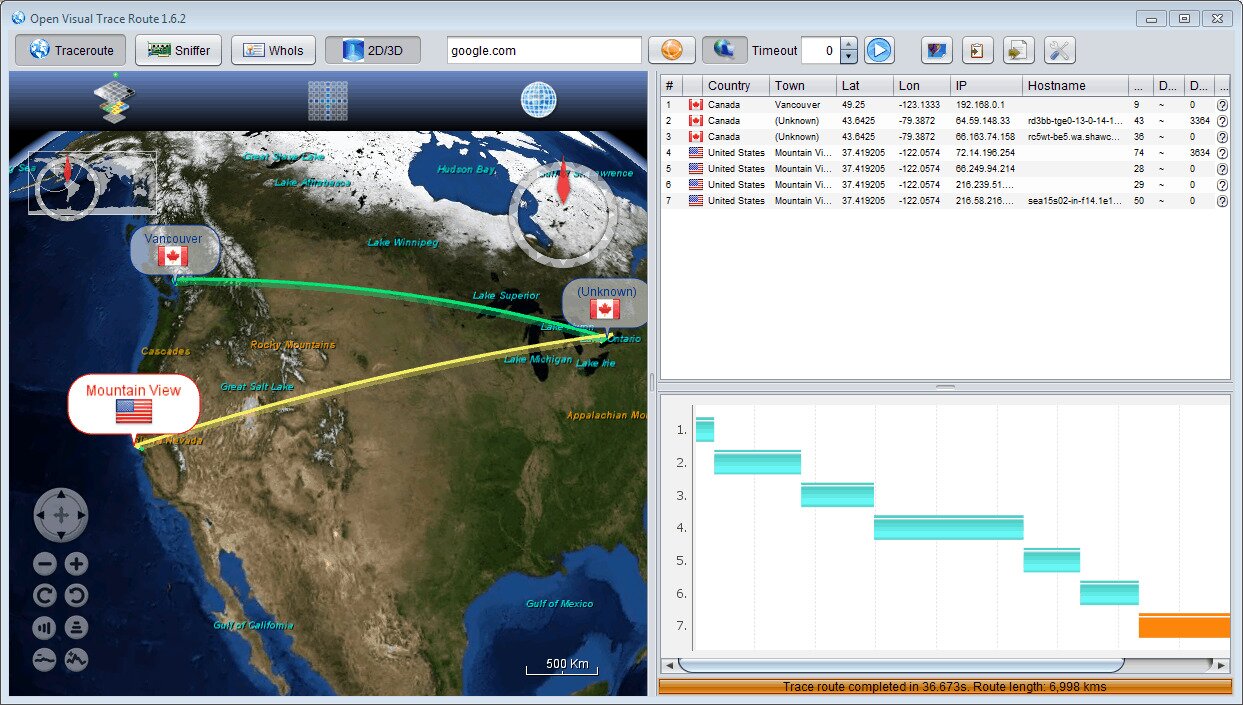
The main component of this software is the Visual Traceroute tool itself. It is a visual, GUI-based utility that will let you see on a World 3D map–or 2D if you prefer–what path the data is taking to go from your computer to the target host. The map can be zoomed and scrolled at will, providing any level of detail you might want.
Open Visual Traceroute also comes with a few more tools, making it an even more useful product. There is, for instance, a “packet sniffer”. This is not a packet sniffer like Wireshark, though. Its purpose is mainly to allow you to see what data is being sent back and forth from the local system to the Internet. There is also a Whois feature that will pull information about domain names from the Internet’s Whois servers.
4. MTR (My Traceroute)
MTR (AKA My Traceroute) was first developed by a developer named Mike (same say his name was Matt) and the acronym then stood for Mike’s (or Matt’s) Traceroute. Someone else has taken over the maintenance and development of the tool and renamed it to My Traceroute but it’s still the same product. It has been around since 1997. If longevity is a testament to quality, this ought to be a pretty good tool.
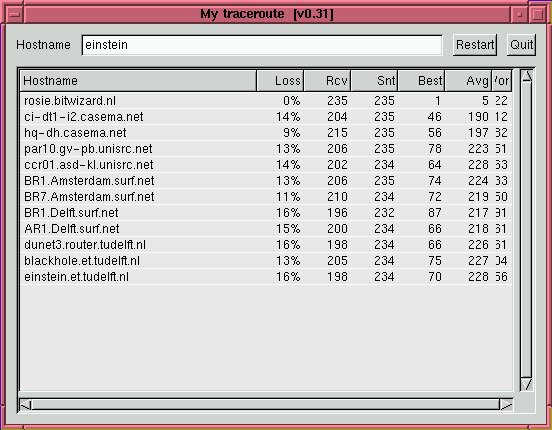
And it is. Functionally, it is almost identical–or at least very similar–to Traceroute NG that we just reviewed. The main differences between the two are that while Traceroute NG only runs on Windows, MTR only runs on Linux. Another difference is that this tool can be used with a GUI or run from the command line.
MTR combines the functionality of traceroute and ping in one network diagnostic tool. When you first run the tool, it operates exactly like traceroute to learn the network path to a specified host. Once it knows the path, though, MTR goes a bit further. It will send a sequence of ICMP ECHO requests to each hop to measure the quality of the link to each router. And as it does that, it displays the measured statistics on the screen. In fact, it prints it to the standard output, meaning that it can be redirected to a file.
5. WinMTR
WinMTR is a port of the MTR tool we just introduced. As such, its functionality is quite similar. As other traceroute tools, it is based on ICMP Time Exceeded packets and ICMP Echo Reply packets. It also features a UDP mode that sends UDP packets—instead of ICMP—with the TTL field in the packet header.
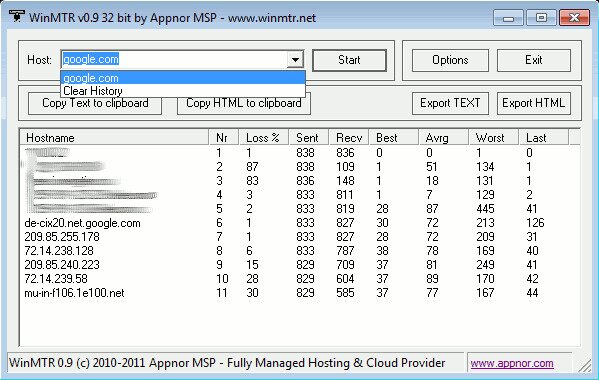
The tool, which supports IPv6 in addition to IPv4 will display a list of routers traversed by the packet, the average time for the round-trip and the packet loss of each router. It helps to identify the links between routers and it can provide a crude assessment of network overuse problems. It operates by keeping track of response times of each and every hop along the path.
This free and open-source tool can run on both 32-bit and 64-bit versions of Windows and installing it is very simple. Using the tool is not any harder, though, thanks to its intuitive user interface. If you prefer, the tool can also be used from the command line.
6. SmokePing
Last on our list—but certainly not least—is a great tool called SmokePing This is a free and OpenSource tool written in Perl by Tobi Oetiker, the creator of MRTG and RRDtool, the grandparents of all SNMP network monitoring tools. The tool offers best of breed latency visualization, an interactive graph explorer and a wide range of latency measurement plugins.
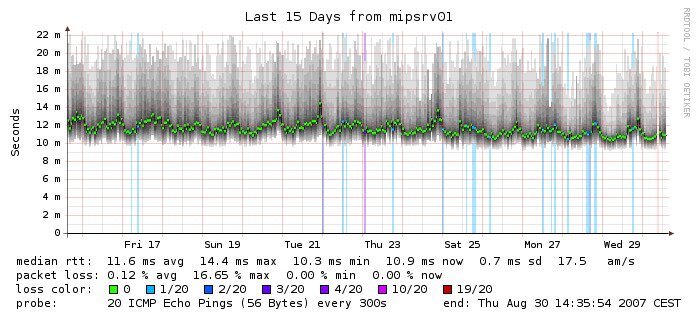
SmokePing supports multi-site deployments and distributed measurement in a master/slave configuration. Furthermore, the tool also features a highly configurable alerting system—with support for your own mail server, an uncommon sight in similar tools. Its live latency charts can give you a real-time view of your network’s performance. The tool can be run in debug mode at any time to help identify any problems associated with it. It will also detect issues automatically as they happen. And finally, this tool stores issues and keeps their history, letting you review it and analyze issues at a later time.