

6 Best IPFIX Collectors and Analyzers
Networks are often likened to highways, with data packets representing cars traveling from point A to point B. However, there’s a significant difference between the two. While it’s simple to observe cars passing by on a highway, monitoring traffic on a network is considerably more challenging. Similarly, traffic congestion or increased density is easily noticeable on a highway, but it remains unseen on a network, with only its effects being observable. This is where network monitoring tools, such as network analyzers, come into play, providing some visibility into the network’s activities.
IPFIX, an industry-standard network analysis protocol, offers this kind of visibility. It is one of the key bandwidth monitoring tools that help in managing network traffic. Flow analysis tools, like IPFIX, are essential for understanding the intricacies of network traffic.
To help you gain better control and understanding of your network, we’re introducing our top IPFIX collectors and IPFIX analyzers. These include the SolarWinds NetFlow Traffic Analyzer, PRTG Network Monitor, and ManageEngine NetFlow Analyzer. These tools not only provide visibility into your network but also help in managing and optimizing your network’s performance.

We’ll start off by discussing network monitoring in general. We’ll introduce the two main types of monitoring tools typically used by network administrators to monitor their network and identify issues before they have too much impact. We’ll explain what IPFIX is and how it works, trying to keep it as non-technical as possible. We will then be ready to dive into the core of the subject and review the very best IPFIX collectors and IPFIX analyzers we could find.
Network Monitoring Tools
One of the most important responsibilities of network administrators is to ensure everything is running smoothly, that there are no slowdowns and that all network traffic gets to its destination within an acceptable time. Unfortunately, what happens on a network happens inside cables, routers, switches and other equipment where it is normally impossible to see what’s going on. Network monitoring tools were invented to give administrators the visibility they need to ensure all is running well at all times. While there are several different types of network monitoring tools available, two specific types are most commonly found: bandwidth monitoring tools and flow analysis tools.
Bandwidth Monitoring Tools
The most elementary type of network traffic monitoring tool is the bandwidth monitor. It is a system which polls network devices at regular intervals (typically five minutes) and read their interface byte counters. It uses that information to compute the average bandwidth usage and plots its evolution on a graph. These tools typically use the Simple Network Management Protocol to connect to devices and read their counters without requiring any extra software to be installed on them. What you get is a quantitative view of network traffic. The tool will show you how much traffic is going by at a precise location on the network but it won’t tell you what that traffic is.
Flow Analysis Tools
For a more detailed view of what’s going on, flow analysis what you need. It relies on the networking devices themselves to send detailed traffic information to flow collectors and/or analyzers which can, in turn, interpret the data and present it in meaningful ways. A few different protocols exist for flow analysis but most, including IPFIX, are based on Cisco’s NetFlow technology. NetFlow was created by Cisco Systems many years ago but it is now commonly used in one form or another on networking equipment from most major manufacturers.
About IPFIX
IPFIX—which is an acronym of IP Flow Information eXport—is, in a nutshell, the IETF-standardized version of the latest version of NetFlow. Initially developed by Cisco Systems, it was introduced on their routers to provide the ability to collect IP network traffic as it enters or exits an interface. The collected data is then processed by flow analysis systems and used by network administrators to help determine the source and destination of traffic, the class of service, and the causes of congestion.
A typical flow monitoring setup consists of three main components:
- The flow exporter aggregates packets into flows and exports flow records towards one or more flow collectors. This is the component which is built into compatible devices.
- The flow collector is responsible for reception, storage and pre-processing of flow data received from one or many flow exporters.
- Finally, the flow analyzer is used to analyze flow data collected by the flow collector. Analysis can be used for traffic profiling or for network troubleshooting. In most flow monitoring tools, the functions of the collector and analyzer are combined on a single system.
How IPFIX Works
Routers, switches and any other device that supports IPFIX or any other flow analysis protocol are configured to output flow data in the form of flow records and send them to a flow collector. A flow is a complete conversation in the IP sense, from the initial establishment of the session to its final termination. Flow records are normally sent to the collector when devices determine that the flow is finished either through aging–there has not been any traffic within a specific timeout–or when it sees a TCP session termination.
The flow record contains pertinent information about the flow. This includes the input and output interfaces, the start and finish time stamps of the flow, the number of bytes and packets it contains, the layer 3 headers, the source and destination IP address and port number, the IP protocol, and the TOS value. Flow records don’t contain the actual data that made up the flow, they only contain information about the flow. This is an important security feature of the protocol.
Flow analyzers use the information contained in flow records to present data about network traffic in a way that is useful to network administrators. Different IPFIX collectors and analyzers will have different ways of presenting data. Typical displays include top talkers and listeners, top protocol or top applications, and top users, a feature which is available on advanced tools that connect to the AD or LDAP servers and can determine which user is using which IP address.
The Best IPFIX Collectors And Analyzers
There are plenty of options available when looking for an IPFIX collector and analyzer tool. We’ve scoured the market and found the best ones. We have a mix of commercial software and free and/or open-source offerings. As you’ll see, you don’t necessarily have to shell out huge amounts of money to get started with flow analysis.
1. SolarWinds NetFlow Configurator (Free Tool)
SolarWinds NetFlow Configurator offers you a seamless solution for enabling NetFlow on your network devices, all without any cost. This tool empowers you to swiftly and remotely activate NetFlow across your network infrastructure. However, if you want the capability for multi-vendor network traffic monitoring, encompassing fault detection, availability tracking, and performance analysis across thousands of devices, alongside simultaneous examination of NetFlow, NBAR, sFlow, J-Flow, IPFIX, and NetStream, as well as real-time viewing of performance metrics through dynamic, drillable network maps, then it’s time to consider an upgrade.
The enhanced and advanced iteration of SolarWinds NetFlow Configurator goes by the name of SolarWinds NetFlow Traffic Analyzer.
2. SolarWinds NetFlow Traffic Analyzer (FREE TRIAL)
SolarWinds is one of the best-known makers of network and system administration tools. Its flagship product, called the Network Performance monitor is viewed by many as the best network bandwidth monitoring tools. Likewise, the SolarWinds NetFlow Traffic Analyzer—which installs on top of the Network Performance Monitor—is one of the best IPFIX collector and analyzer you can find.

Some of the SolarWinds NetFlow Traffic Analyzer’s best features include:
- Monitoring Bandwidth use by application, by protocol, and by IP address group.
- Monitoring IPFIX, Cisco NetFlow, Juniper J-Flow, sFlow, and Huawei NetStream flow data allowing it to identify which devices, applications, and protocols are the highest bandwidth consumers.
- Collecting traffic data, correlating it into a usable format, and presenting it to the user through a web-based interface for monitoring network traffic.
- Identifying which applications and categories consume the most bandwidth for better network traffic visibility (including Cisco NBAR2 support).
The SolarWinds NetFlow Traffic Analyzer is an add-on to the Network Bandwidth monitor. You can save by acquiring both at the same time as the SolarWinds Network Bandwidth Analyzer Pack. Prices start at $1,168 for monitoring up to 100 elements and vary according to the number of monitored devices. While this may seem a bit expensive, keep in mind that you’re getting not one but two of the best monitoring tools available. If you’d prefer to try the product before purchasing it, a free 30-day trial can be downloaded from SolarWinds.
3. The SolarWinds Real-Time AppFlow Analyzer (FREE DOWNLOAD)
In addition to making some of the best network administration tools. SolarWinds is also famous for its free tools. They are smaller tools addressing a specific need of network administrators. One of these free tools is the Real-Time AppFlow Analyzer and if you need a smaller-scale solution, it might be just what you need. Of course, this product is far from being as feature-rich as the NetFlow Traffic Analyzer, yet it gives you some the same basic functionality.

This tool can capture and analyze IPFIX, NetFlow, JFlow, and sFlow data in real time. It will show you exactly the types of traffic on your network, where it’s is coming from, and where it’s going to. You can also use it to diagnose traffic spikes and troubleshoot bandwidth issues.
Some of the product’s primary features include:
- Identifying which users, devices, and applications are consuming the most bandwidth
- Isolating network traffic by conversation, app, domain, endpoint, and protocol
- Viewing network traffic by type and specified time periods
This free tool can’t compare to its bigger brother. It is severely limited yet it could be all you need to see if flow analysis is what you need. The tool’s primary focus is the current and recent state of your network. It will only collect data from one flow exporter and will only keep and analyze the last 60 minutes of data.
Installing the SolarWinds Real-Time AppFlow Analyzer is easy and fast, thanks to its setup wizard. Once installed, a NetFlow Configurator module is included to help you configure devices that support various NetFlow variants, including IPFIX.
If your networking equipment supports IPFIX and you need a quick and dirty view on your bandwidth usage, the free SolarWinds Real-Time AppFlow Analyzer might be for you.
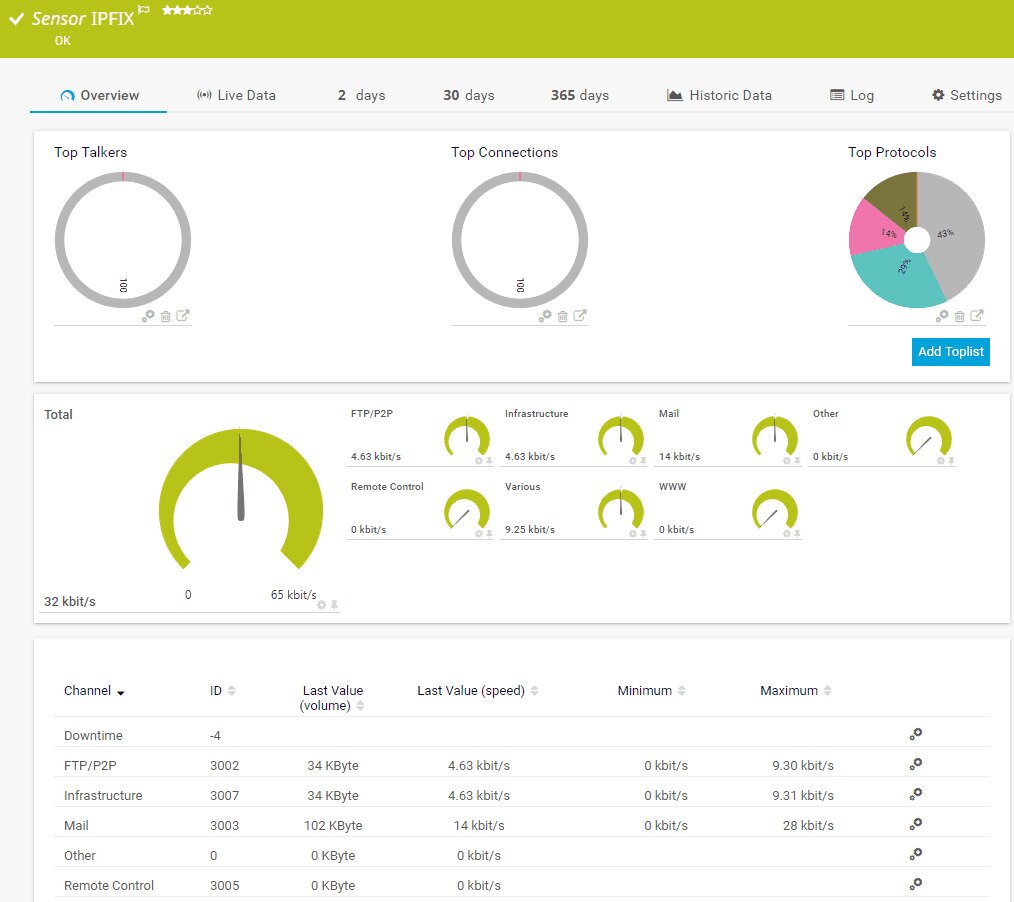
4. PRTG Network Monitor
The PRTG Network Monitor, from Paessler AG, is an all-in-one solution whose primary purpose is monitoring bandwidth utilization. It’s also used to monitor the availability and health of different network resources. As such, it’s another very useful tool for network administrators. PRTG can monitor multiple sites and it can monitor LAN, WAN, VPN and Cloud Services.
The strength of PRTG mainly comes from its sensors. You can think of them as add-ons except that they are included with the product. One such add-on is the IPFIX sensor which receives traffic data from an IPFIX-compatible device and shows traffic by type. Several filter options are available to divide traffic into different channels.
Installing PRTG is quick and easy. In fact, Paessler claims you could start monitoring within a couple of minutes. Setup speed is partly due to the auto-discovery process which will discover devices and set up sensors.
PRTG only runs on Windows but its user interface is web-based and it can be accessed from any browser. There’s also a mobile app that you can install on your smartphone. The PRTG mobile app takes full advantage of the underlying platform. It has, for instance, a unique feature in the form of QR labels that you can print and affix on your devices. Then, it’s a simple matter of scanning the code from the mobile app to quickly view the device’s sensor data.
Two versions of PRTG are available. There’s a free version that is limited to 100 sensors. While this limit might seem pretty high, keep in mind that a sensor, in PRTG parlance, is the most basic element that can be monitored. For instance, monitoring each port of a 48-port switch uses up 48 sensors. For IPFIX, you’ll need to allocate one sensor per flow source.
If you need more than 100 sensors, you’ll need to purchase a license. Prices vary according to the number of required sensors and start at $1 600 for 500 sensors. The free version will allow unlimited sensors for the first 30 days so you can thoroughly test-drive the product.
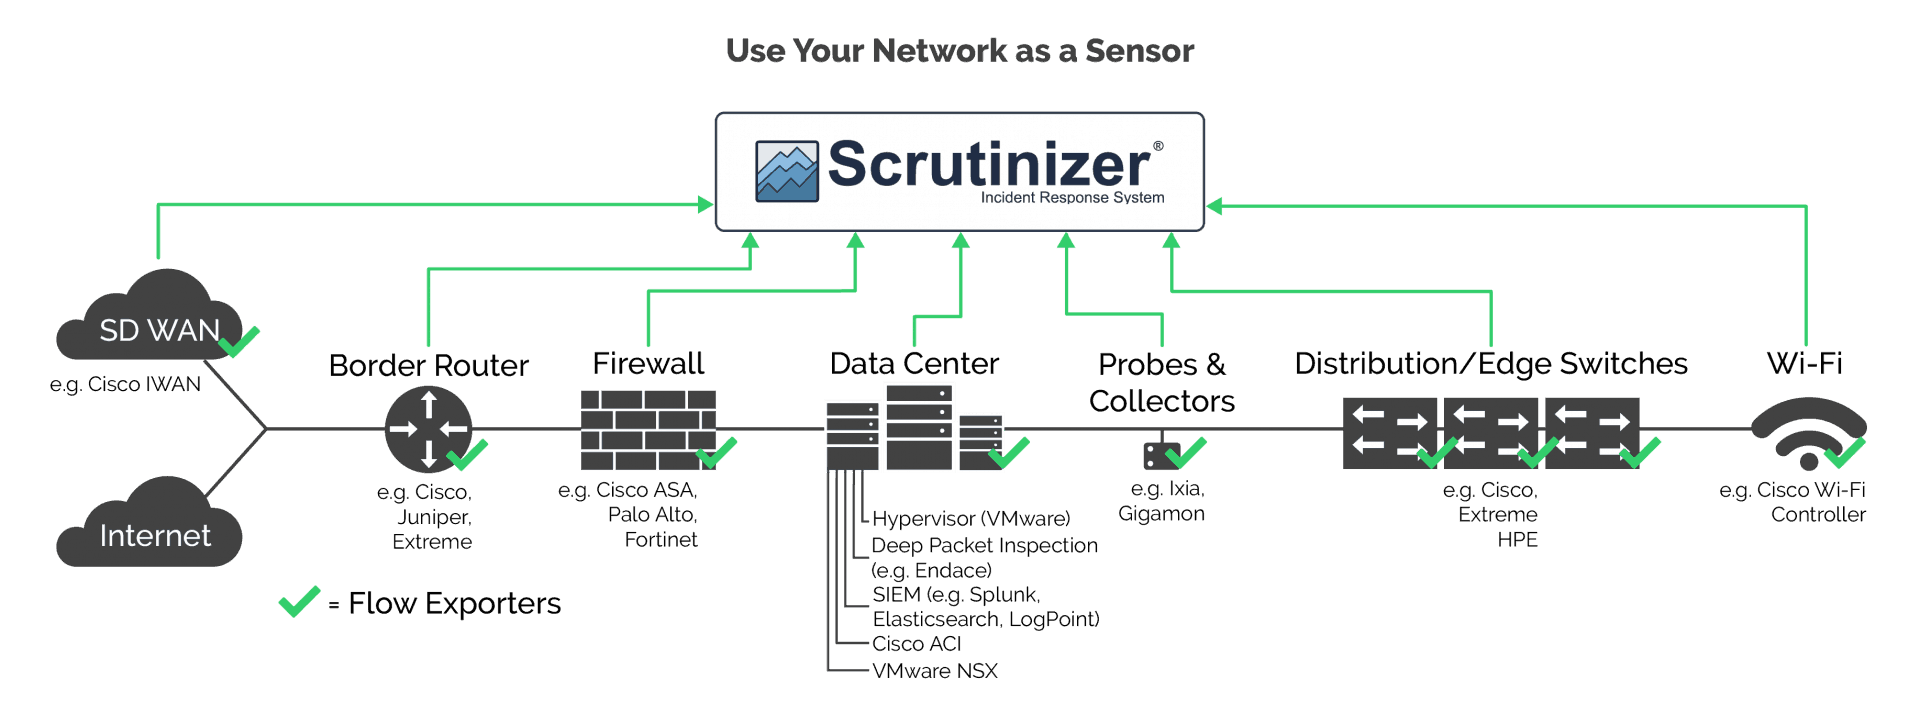
5. Scrutinizer
Scrutinizer from Plixer is another great IPFIX analyzer. It is actually quite a bit more than that and many view it as a full incident response system. When it comes to flow analysis, it can analyze different flow types such as IPFIX, NetFlow, J-flow, and NetStream.
Scrutinizer is built on a hierarchical design which offers streamlined and efficient data collection and allows you to start small and easily scale up to several million flows per second. Even though the network is often first blamed whenever something goes wrong, This tool can help you quickly find the real cause of most network issues. Scrutinizer works in both physical and virtual environments and boasts some advanced reporting and alerting features.
Scrutinizer comes in four license tiers that go from the basic free version to the full-fledged SCR level which can scale up to over 10 million flows per second. The free version is limited to 10 thousand flows per second and it will only keep raw flow data for 5 hours but it should be more than enough to troubleshoot network issues. Pricing information is not readily available and can be obtained by a formal quote from Plixer. You can also try any license tier for 30 days after which it will revert back to the free version.
6. ManageEngine NetFlow Analyzer
The next on the list of the best IPFIX collector and IPFIX analyzer is the ManageEngine NetFlow Analyzer. This tool gives the network administrator a detailed view of network bandwidth utilization as well as traffic patterns. The product is controlled from a web-based user interface and offers an impressive number of different views on your network. The tool will let you, for instance, view traffic by application, by conversation, by protocol, and several other options. You can set alerts to warn you of any potential issue. You could, for instance, set a traffic threshold on a specific interface and be alerted whenever traffic exceeds it.
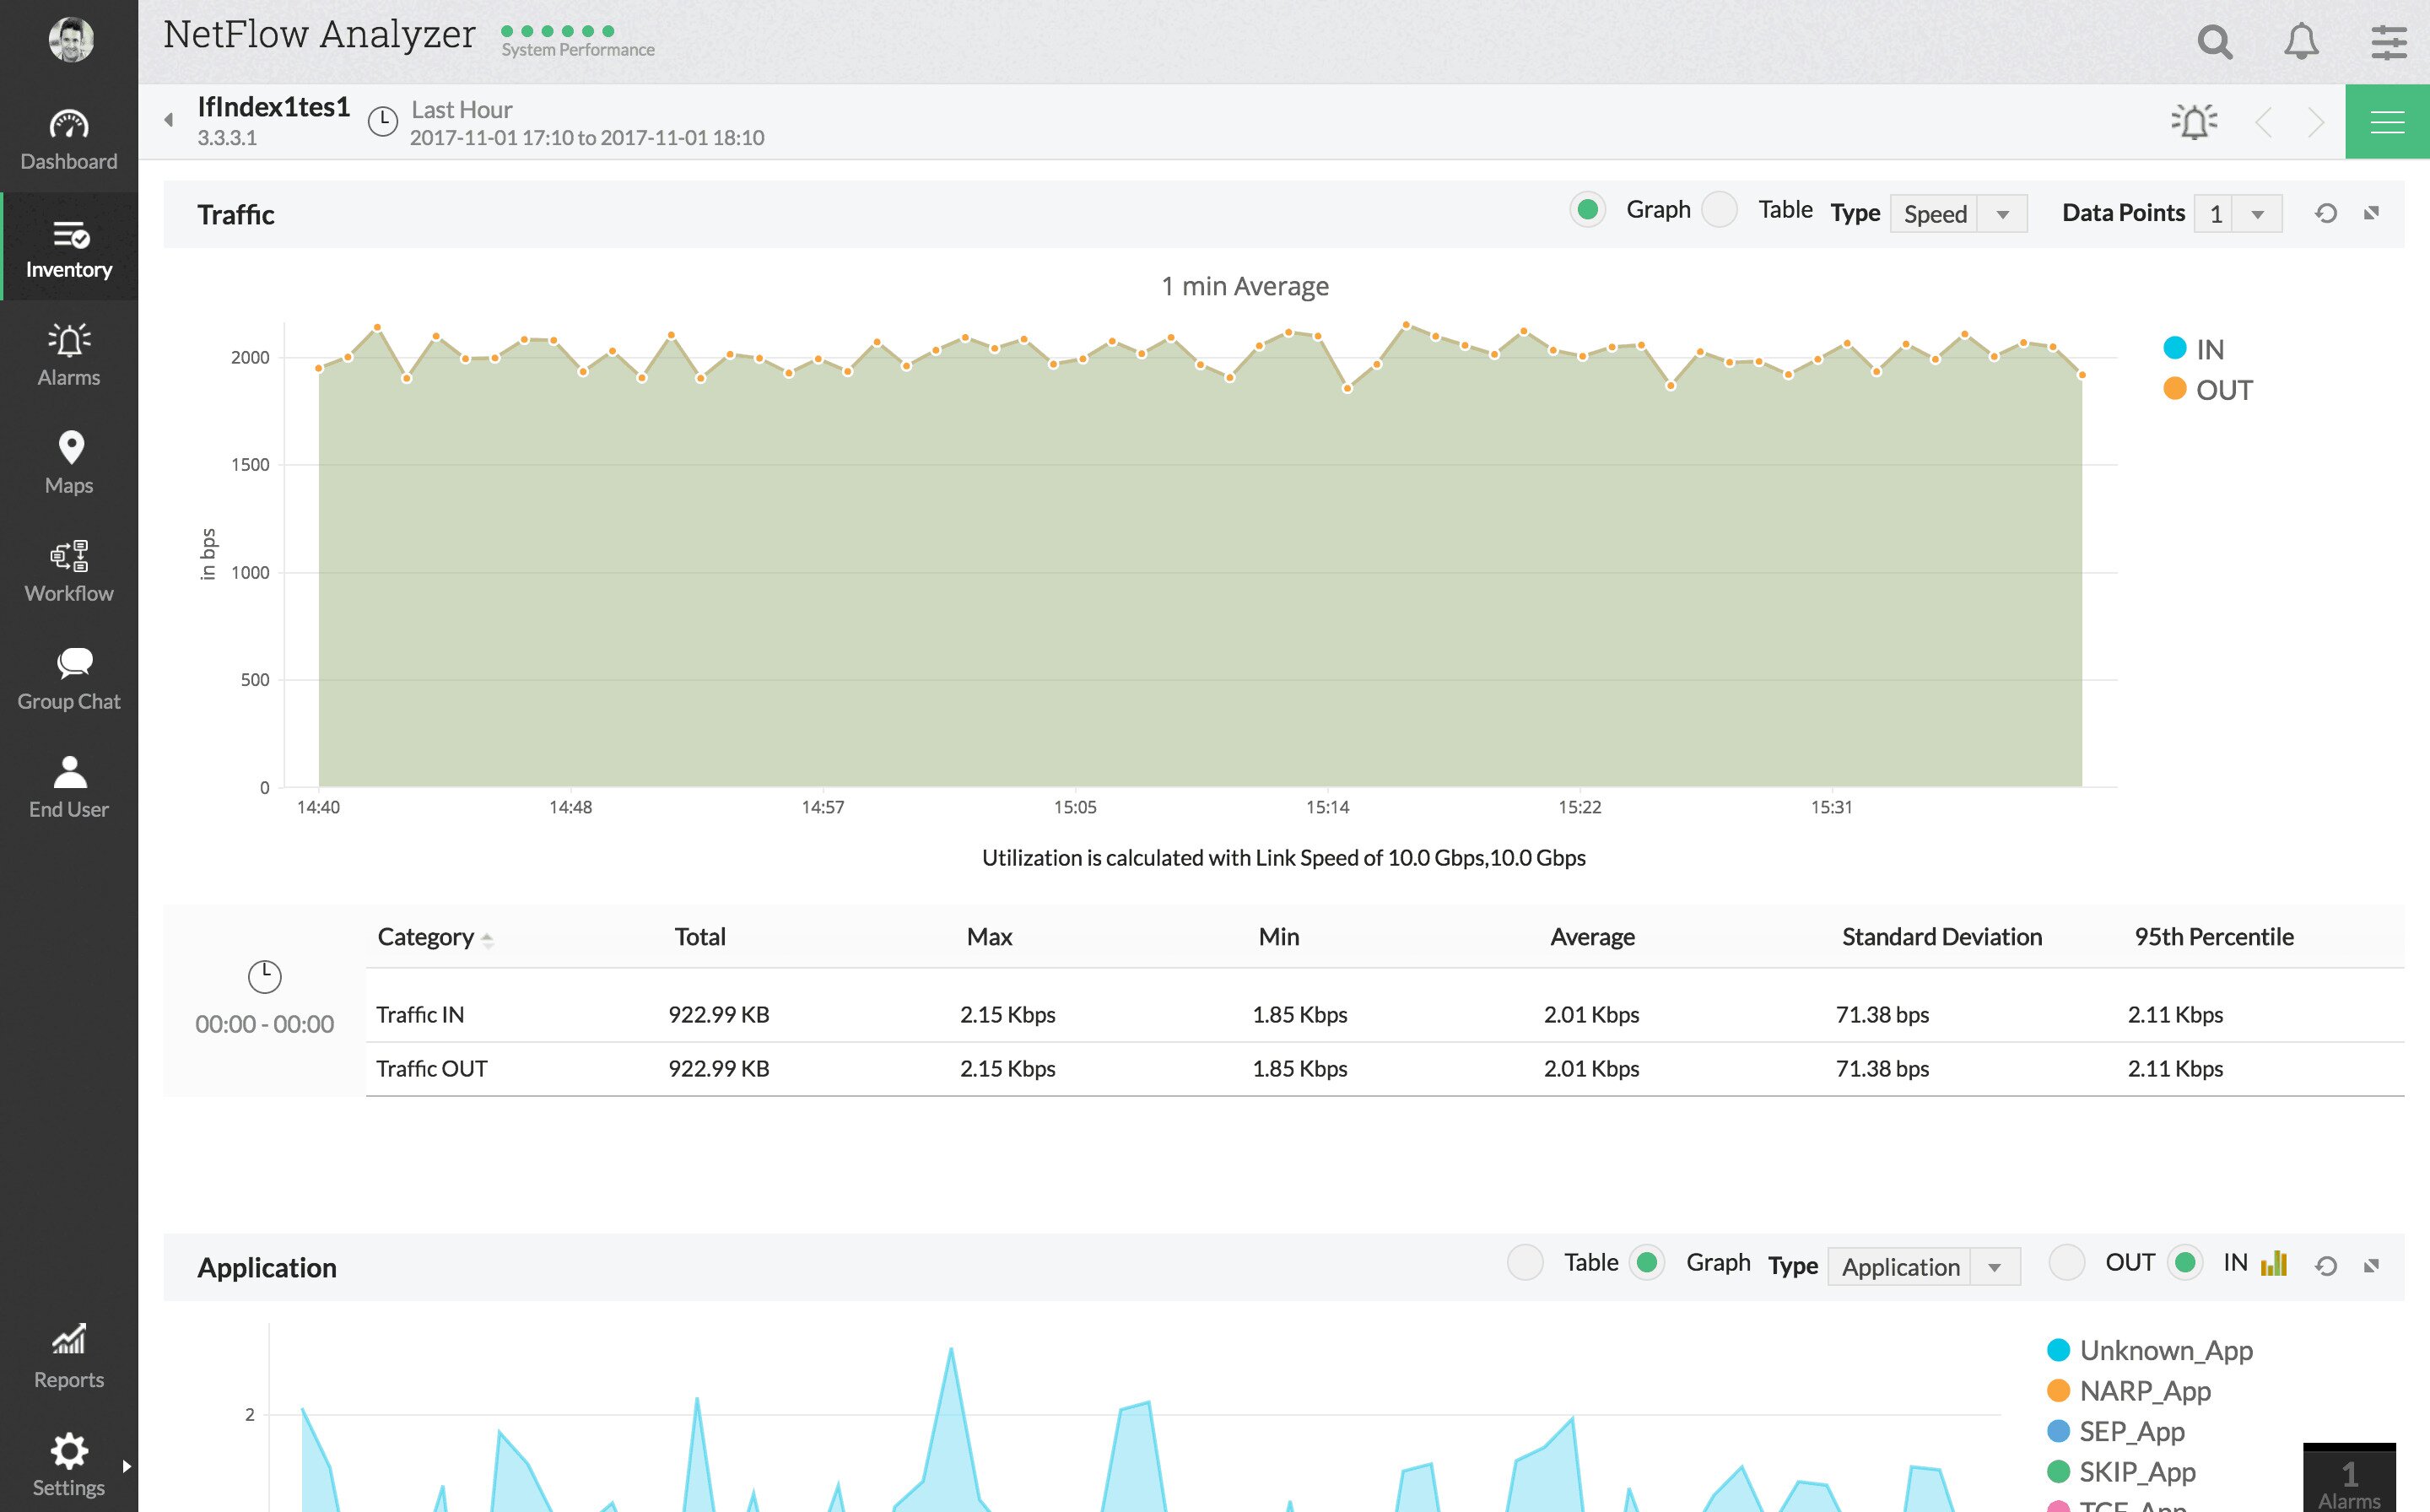
However, most of the strength of the product comes from its reports and dashboard. The tool comes with several very useful pre-built reports that are custom-tailored for specific purposes such as troubleshooting, capacity planning or billing. But you’re not stuck with built-in reports. The tool also allows administrators to create custom reports to their liking.
Let’s get back to the tool’s dashboard mentioned earlier as it is just as impressive as its reports and deserves a closer look. It includes several pie charts with things such as top applications, top protocols or top conversations. It can also display a heat map with the status of the monitored interfaces. For an even better monitoring experience, dashboards can be fully customized to include all the information you find useful and none of what you don’t need. The dashboard is also where alerts are displayed in the form of pop-ups. For the on-the-go network administrator, there’s even a smartphone app that will let you access the dashboard and reports from wherever you may be.
The ManageEngine NetFlow Analyzer supports most flow technologies including NetFlow (of course), IPFIX (or it wouldn’t be on this list), J-flow, NetStream, and a few others. As a bonus, the tool has excellent integration with Cisco devices, with support for adjusting traffic shaping and/or QoS policies right from the dashboard.
Like many similar products, the ManageEngine NetFlow Analyzer comes in two versions. The free version is identical to the paid one for the first 30 days but it then reverts to monitoring only two interfaces of flows. For more capacity, you’ll need the paid version. Licenses are available in several sizes from 100 to 2500 interfaces or flows with prices varying starting at about $600 plus annual maintenance fees.
Sponsored by Salix Pharmaceuticals
Learn how you can find IBS-D relief.
Focus on what matters.
7. nProbe and ntopng
nProbe and ntopng are somewhat more advanced–and more complicated–open-source tools. Ntopng is a web-based traffic analysis tool for monitoring networks based on flow data while nProbe is an IPFIX and NetFlow exporter and collector. Used together, they make for a very flexible network analysis package. If you’re familiar with Linux administration, you might be already familiar with ntop. ntopng is the “next-generation” GUI version of this ageless tool.
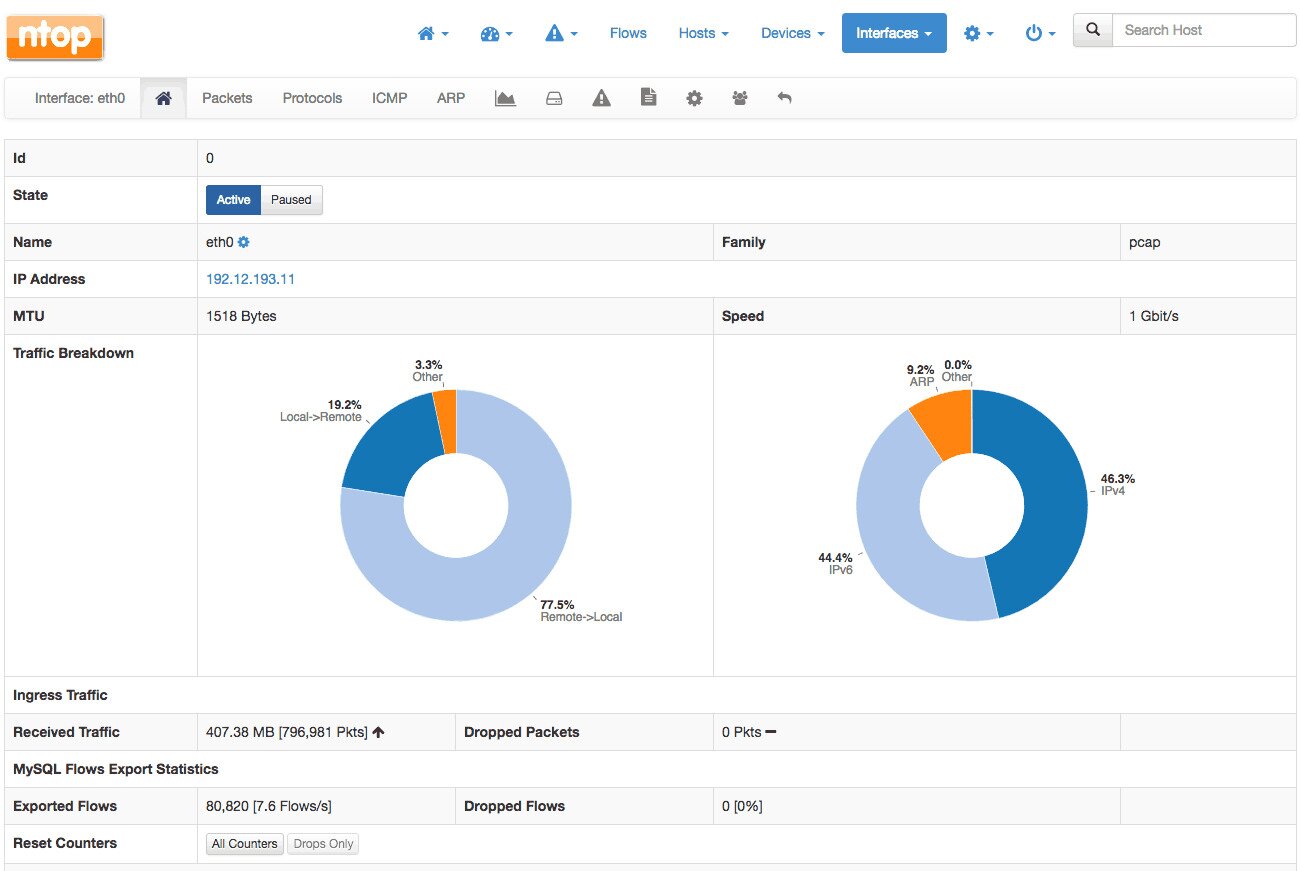
Like most modern network analysis tools, ntopng features a web-based user interface which can present data according to various criteria such as top talkers, flows, hosts, devices, and interfaces. The tool offers a mix of charts, tables, and graphs, most featuring drill-down options that let you explore in greater depth. The interface is very flexible and it allows for a lot of customization. If you’re wondering why this tool is ranked 6th on our list of the best IPFIX collector and IPFIX analyzer, it is important to know that its position at the end doesn’t indicate it’s less capable.
Moreover, there’s a free community version of ntopng and you can also purchase pro and enterprise versions. Their prices are currently 149,95 euros and 499,95 euros, respectively. Free licenses are available for educational and non-profit organizations. As for nProbe, you can try it for free but it is limited to a total of 25 000 exported flows. To go beyond that, you’ll need to purchase a license which is available in standard and pro versions for 149,95 euros and 299,95 euros.
Conclusion
For The Best IPFIX Collectors And Analyzers, SolarWinds offers three standout solutions.
SolarWinds NetFlow Configurator (Free Tool) is a cost-free tool for the activation of NetFlow on network devices. It’s an excellent starting point for basic flow analysis.
The next product is SolarWinds NetFlow Traffic Analyzer, which is considered one of the best IPFIX collectors, this tool enhances flow analysis significantly. It offers comprehensive bandwidth monitoring, supports various flow types, and presents data via a user-friendly web interface. Prices start at $1,168.
The last product is SolarWinds Real-Time AppFlow Analyzer. If you need a simpler, free solution, this tool captures and analyzes IPFIX, NetFlow, JFlow, and sFlow data in real-time. It’s perfect for quick bandwidth usage insights.
While other options have their merits, SolarWinds’ suite of tools stands out for its versatility, robust features, and ease of use, making it our top recommendation for effective flow analysis.