

Best Nagios Alternatives for Network Monitoring 2026
Through more than 15 years since it first saw the light, Nagios — which was formerly called NetSaint — has remained one of the best-known network monitoring platform. It used to be best suited to monitor system up or down status and provide alerting whenever something went down but it has grown into a true full-featured monitoring platform. Today, there are two competing versions of Nagios. There’s the free and open-source Nagios core and there’s the Nagios XI, a paid monitoring tool based on Nagios Core with added features. Today, we’re having a look at some of the top Nagios alternatives for network monitoring. This is a very active field of information technology and many alternatives are now available.

Before we have a look at the available Nagios alternatives, we’ll begin by talking about Nagios itself, what its best features are and why it has become the popular tool that it is. We’ll then have a look at the tool’s drawbacks, at the reasons why anyone would want to replace it with an alternative solution. And then, we’ll briefly discuss network monitoring in general. We’ll have a look at how most tools do it using the Simple Network Management Protocol. And finally, we’ll be ready for the big reveal and we’ll review some of the best Nagios alternatives for network monitoring.
About Nagios
Nagios was originally known as NetSaint. This open-source tool is the brainchild of Ethan Galstad and a group of developers. The Nagios name is a recursive acronym of “Nagios Ain’t Gonna Insist On Sainthood”, with “Sainthood” making reference to the original name, NetSaint, Interestingly, Agios is also the Greek word “saint”. The name was changed in response to a legal challenge by owners of a similar trademark.
Nagios is a very good monitoring tool for networks and servers. It will run on CentOS or RedHat Enterprise Linux. It could also run as a virtual machine on a Windows host but it is essentially a Linux piece of software. Unlike most other network tools on this list, Nagios doesn’t rely solely on SNMP to monitor network devices. It has its own proprietary system built right into its core engine, which communicates with devices to gather status reports. The metrics, which are gathered on a regular basis by the monitor, appear as live data in the tool’s dashboard and you can also opt to store data for later analysis. This combination makes for a rather powerful tool.
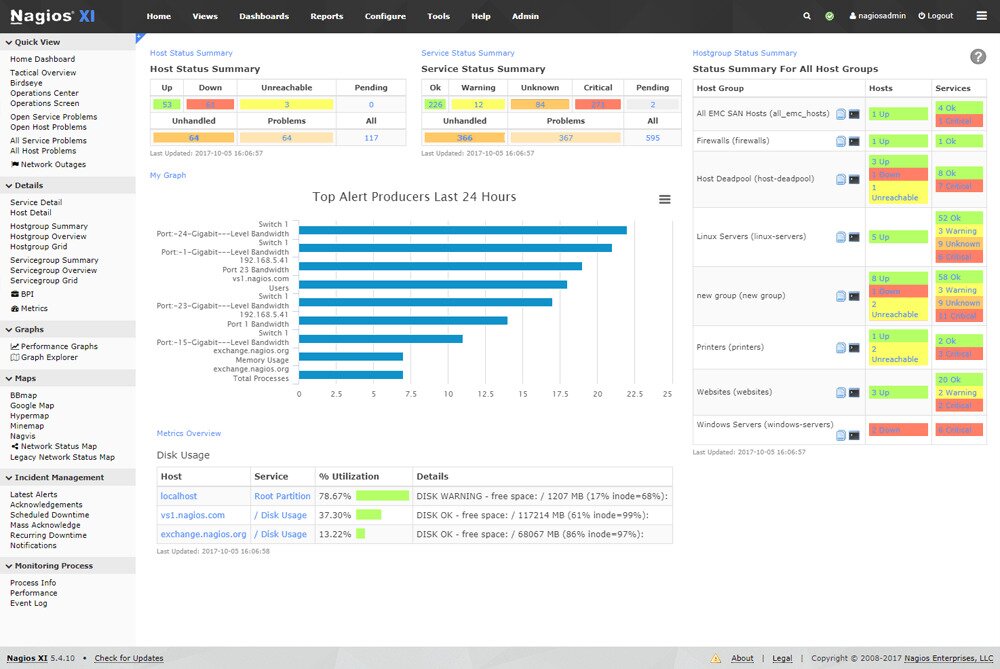
Despite its use of a proprietary data gathering scheme, Nagios will provide all the data you need to perform network monitoring and capacity planning. It has a very comfortable dashboard where you can quickly view the status of your network. This product also has one of the best alerting systems to notify administrators when something odd is detected. After all, that was the tool’s first goal to provide alerting for abnormal situations and it still is one of its strengths.
Nagios benefits from a huge community that supports the open-source Nagios Core version and provides development of many advanced plugins, giving the tool an impressive breadth in terms of monitoring capabilities.
What’s Wrong With Nagios?
This article’s title could lead many readers to wonder what could be wrong with Nagios to warrant replacing it with an alternative tool. Well, there’s actually nothing wrong with Nagios per se. It’s been there for almost 20 years and it’s still going strong. But the fact that nothing’s wrong with Nagios does not necessarily mean that there are no other excellent products out there that you should consider. And if you’re still shopping for a monitoring platform and have heard of Nagios, perhaps you’d like to know what other options there are.
Another reason why you might be looking at replacing Nagios is if you’ve been using the free Nagios Core and want to know, before investing in Nagios XI, what other options are available. No matter why you’re here, we’re about to reveal what our top picks are but first, let’s have a brief look at how network monitoring typically works.
How Does Network Monitoring Work?
When it comes to monitoring networks, there are several ways you can go about it. The method you use largely depends on the level of detail you want, the efforts you’re willing to put and the money you can spend. Details-wise Most administrators are specifically interested in the operational parameters of networking equipment such as CPU load or memory usage and the bandwidth utilization–in bits per second–of the various interfaces.
Most network monitoring tools use the Simple Network Management Protocol, or SNMP, to accomplish their feat. SNMP is a feature that is built into most network equipment. SNMP-enabled devices have counters and gauges that can be remotely read by monitoring systems. For instance, there are gauges for processor and memory utilization and bytes in and out counters for each interface.
While avoiding much of the unnecessary technicalities, let’s try to explain how it works. For gauge-type parameters like CPU and memory utilization, it’s a simple matter of reading them using SNMP. For counter-type parameters, things can be a little bit more elaborate. Network devices typically don’t have bandwidth utilization gauges for their interfaces. What they have are bytes in and bytes out counters that keep incrementing as traffic passes. They have one of these pair of counters for each interface. By the way, networking devices also have similar errors in and errors out counters that some monitoring tools can use to monitor an interface’s error rate, often a good indicator of an interface’s general health.
The SNMP network monitoring tool polls each device it monitors at a known interval—typically 5 minutes—and reads the bytes in and bytes out counters of each monitored interface. The rest is just maths. The tool subtracts the previous values of the counter from the current value. The result is the number of bytes—or errors—in or out in five minutes. It then multiplies the number by 8 (as there are 8 bits in a byte) and divides them by 300 (as there are 300 seconds in five minutes) to get the average bandwidth usage in bits per second over the past five minutes.
It’s important to realize that, while this method has been used for as long as monitoring tools have existed, it has some limitations. In particular, any short peak in network traffic will be completely invisible to the monitoring tool. Take, for example, a 100 Mbps interface. If it carries no traffic for 75 seconds, then 100 Mbps for 30 seconds and the no traffic again for another 75 seconds, an SNMP monitoring tool would should its utilization as 50% although it was maxed out for half of the 5 minutes interval.
The Best Nagios Alternatives
A quick search using Google or any other search engine will reveal dozens of network monitoring tools. Some are commercial products, others are open-source. Our list of the top Nagios alternatives contains mostly paid tools as they often offer a richer feature set. All the paid tools on our list have a free trial version which is either limited in time or capabilities, enabling you to try any of them. Since some of these tools require considerable efforts to set them up correctly, you might want to avoid trying too many, though.
1. SolarWinds Network Performance Monitor
SolarWinds is famous for its excellent network administration tools and for its numerous free tools. Its flagship product, the SolarWinds Network Performance Monitor, or NPM, is a complete network monitoring solution which consistently scores among the top in its class. The tool features a user-friendly GUI interface that administrators can use to monitor devices and to configure the tool. SolarWinds is also famous for its free tools, each addressing a specific aspect of network administration.
Back to the Network Performance Monitor, let’s see what it has to offer. Adding a device to the Network Performance Monitor is easy. You simply specify the device’s IP address or hostname and SNMP connection parameters. The system will query the device and list all the monitorable SNMP parameters. All you have to do is pick those you want to include on your dashboard, graphs and reports. And talking about adding devices, there’s virtually no limit to the number of devices you can add. This tool’s scalability is one of its best features. From a handful of devices to thousands of them, it’s got you covered.

Since alerting is one of Nagios’ strengths and an important feature of monitoring tools, let’s see how that looks in NPM. Its alerting system is actually second to none. It is highly customizable if you have non-standard needs but it can also be used out-of-the-box with minimal configurations. The alerting engine is smart enough not to send notifications for “unimportant” events in the middle of the night or to send hundreds of notifications for as many unresponsive servers when the main issue is a down router or network switch.
Prices for the SolarWinds Network Performace Monitor start at $2 955 for up to 100 monitored elements and goes up according to the number of monitored elements. Some optional tools can also be added to NPN, potentially raising its price. If you’d rather try the product before committing to purchasing it, a free 30-day trial version is available for download from the SolarWinds website.
2. PRTG
The Paessler Router Traffic Grapher, which is usually simply called PRTG, is another excellent alternative to Nagios. This tool can monitor all systems, devices, traffic, and applications of your IT infrastructure. It is an all-inclusive package that does not rely on external modules or add-ons that need to be downloaded and installed for basic monitoring. Some advanced functions are available as extra sensors. Due to its integrated nature, it is quicker and easier to install than many network monitoring tools. Paessler claims you could start monitoring within 2 minutes. PRTG offers a choice of several different user interfaces. There’s a Windows enterprise console, an Ajax-based web interface, and mobile apps for Android and iOS.
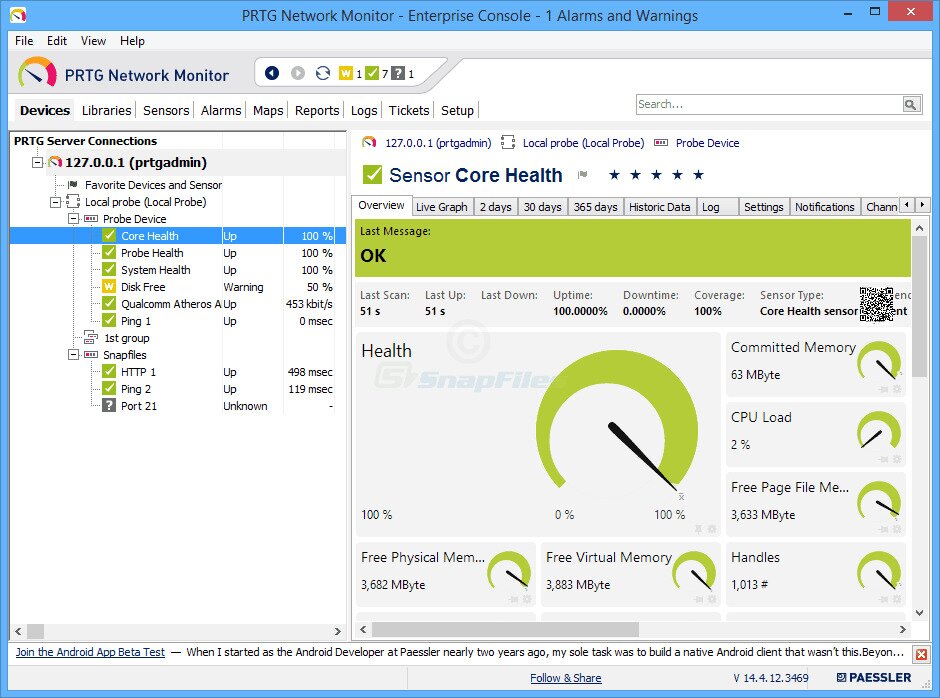
One of PRTG’s best feature is its autodiscovery system. It will scan network segments and automatically recognize a wide range of devices and systems, creating sensors from predefined device templates. This feature is accessory in making the software so fast to install. The tool’s map feature will let you create custom maps with your monitoring data, offering a unique way of displaying data. As for its alerting features, they are highly flexible and customizable. When using the free client apps for Android, iOS, and Windows Phone, you can even get push notifications directly to your device. You can also set up notifications via email or SMS. A powerful API lets you write your own notification scripts.
PRTG has a relatively simple pricing structure. There’s a free version which is full-featured but will limit your monitoring ability to 100 sensors. Note that unlike most similar tools each monitored parameter counts as one sensor. So, monitoring bandwidth on each port of a 48-port switch will require 48 sensors. There’s also a 30-day trial version which allows unlimited sensors but will revert back to 100 sensors once the trial period is over. If you need to monitor more than 100 sensors, you’ll need to purchase a license. Their price varies according to the number of sensors from $1 600 for 500 sensors to $14 500 for unlimited sensors.
3. WhatsUp Gold
WhatsUp Gold from Ipswitch is another well-known name in the field of monitoring tools. It used to be an up-or-down type of monitoring tool but it has evolved into a full management tool with proactive monitoring for network traffic, applications, virtual environments, and device configurations. Today, WhatsUp Gold has everything you can expect from an enterprise-grade monitoring tool, and it’s all available via its intuitive GUI.
WhatsUp Gold features an auto-discovery engine that will find your devices and add them to the monitoring console. It will not only find your networking equipment but also physical servers, virtual servers, cloud servers, and applications. There’s even a map view that’s clickable for more information on each device.
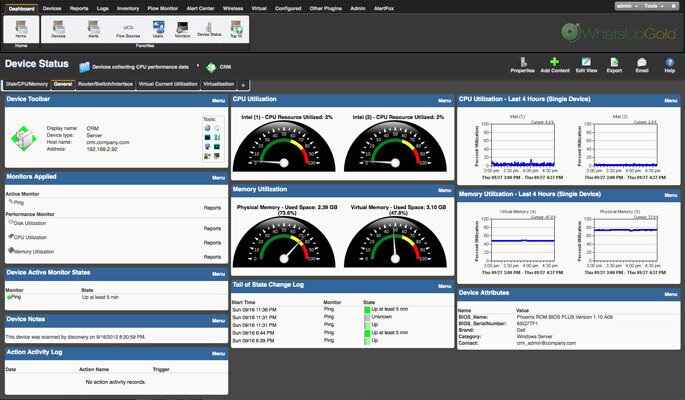
WhatsUp Gold also has an excellent alerting system to let you know about problems before users notice them. Through the tool’s Alert Center, you can opt to use predefined thresholds or set them as per your specific needs. The alerting system lets you create action policies which define what happens when a monitored parameter changes state. Alerts can be transmitted by email, SMS, Slack, or IFTTT posts. The system can also restart services and trigger web alarms.
A free edition of WhatsUp Gold is available—as it always was—but it is limited to monitoring a maximum of five devices. For more devices, paid licenses are available in three levels of increasing functionality with a pricing structure based on the number of devices to be monitored. There’s also a free, full-featured trial version that you can use for a limited time.
4. ManageEngine OpManager
ManageEngine is another well-known maker of network management tools. Its OpManager tool is a complete management solution that will address most monitoring needs. The tool runs on either Windows or Linux and is loaded with excellent features. One of them is its auto-discovery feature which can map your network, giving you a uniquely customized dashboard.
The ManageEngine OpManager dashboard is another of the tools strong points. It is super easy to use and navigate and has drill-down functionality. If you’re into mobile apps, they are available for tablets and smartphones allowing you to access the tool from anywhere. Overall, this is a very polished and professional product.
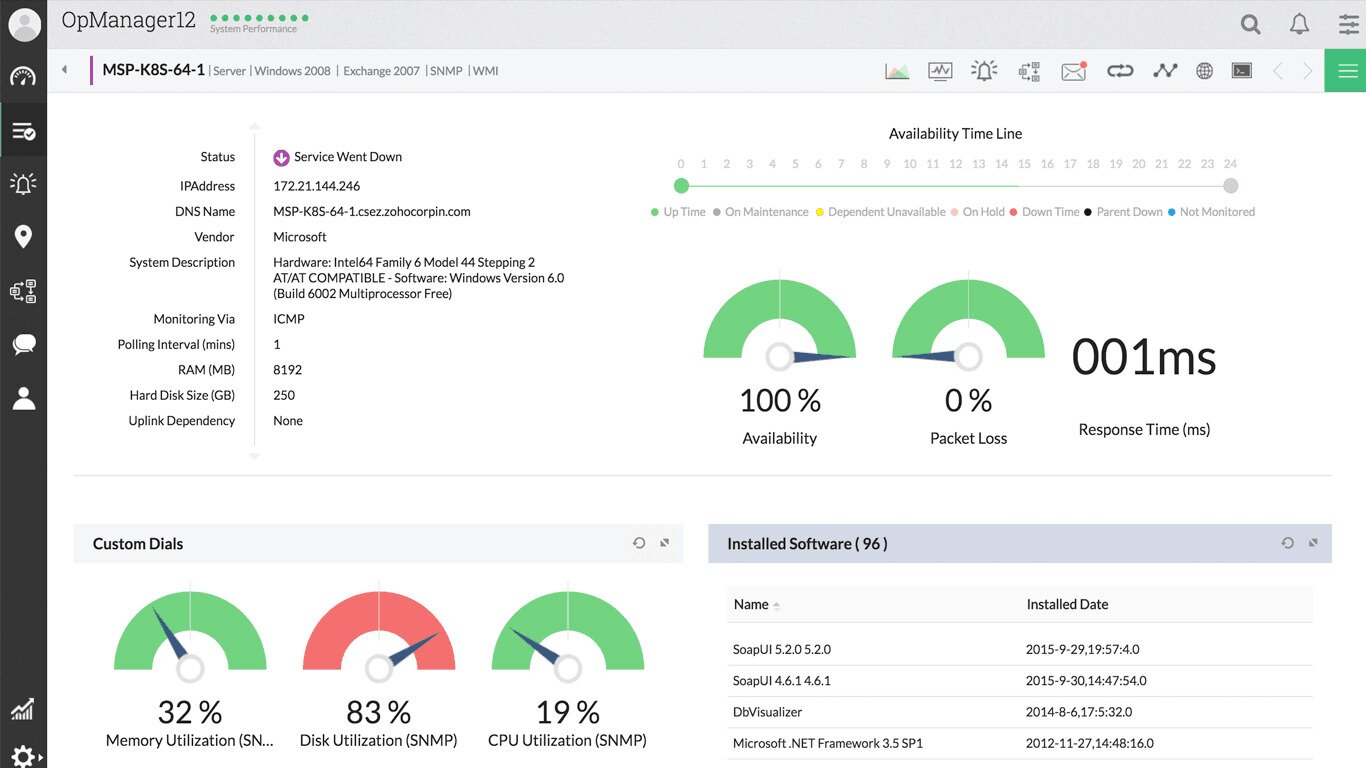
Alerting in OpManager is just as good as all its other components. There is a full complement of threshold-based alerts that will help detect, identify, and troubleshoot network issues. Multiple thresholds with various notifications can be set for every performance metric.
If you want to try the ManageEngine OpManager before buying, a free version is available. But rather than a time-limited trial, this one is feature-limited. It won’t, for instance, let you monitor more than ten devices. Although this could be enough for testing purposes, it is insufficient for all but the smallest networks. For more devices, you have to choose between the Essential or the Enterprise plans. The first will let you monitor up to 1,000 nodes while the other goes up to 10,000. Pricing information is available by contacting ManageEngine’s sales.
5. Cacti
Cacti is possibly the most used free and open-source monitoring system. It might not be as feature-rich as some commercial products but, given its price, it a great tool. Cati also bears some historical significance. Aside from MRTG–which is the mother of all network monitoring tools and a distant parent, This is possibly the oldest monitoring tool still around. And that wouldn’t be so if it was not an excellent tool.
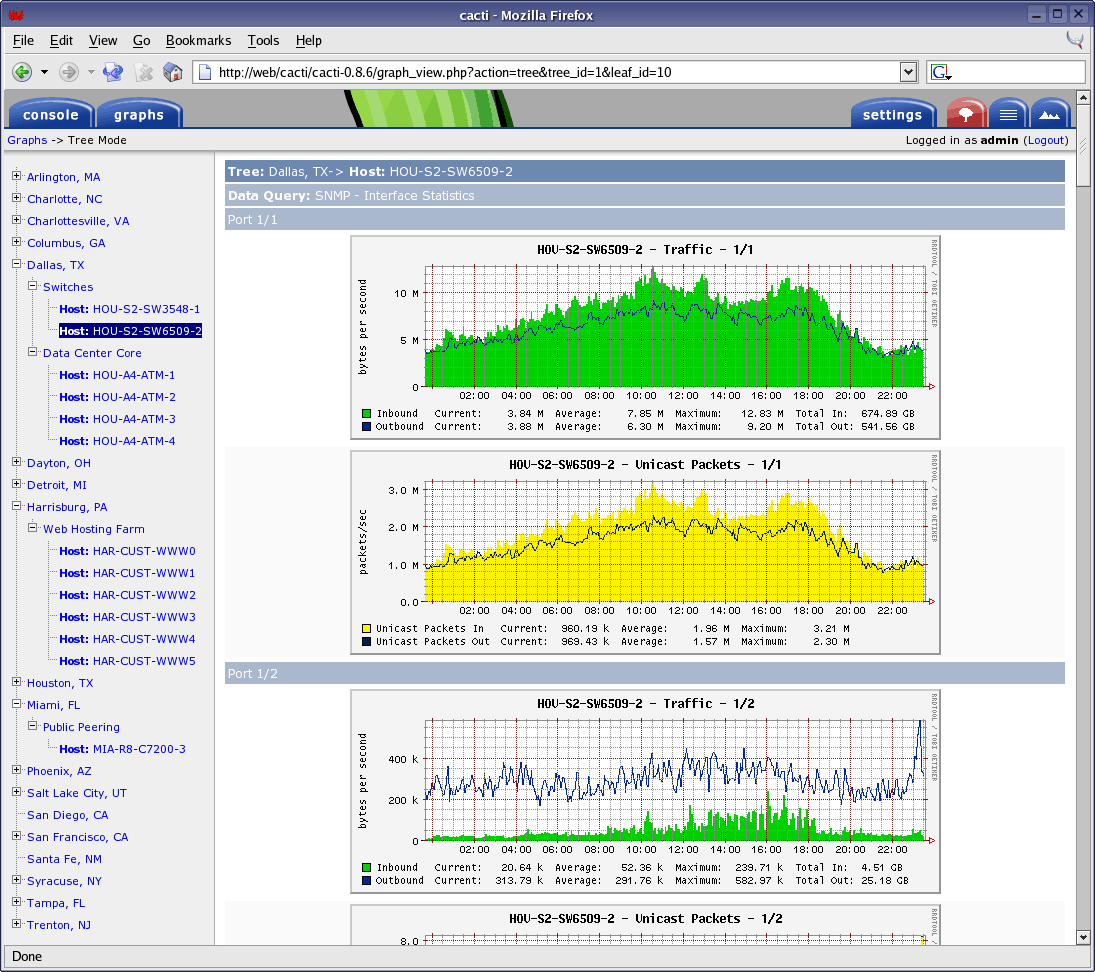
Cacti was first released back in 2004 as a web front-end to RRD tool, the logging and graphing component of MRTG. Its main components are a fast poller, advanced graph templating, and multiple data acquisition methods. Cacti also feature user access control and each user can be configured to have access to a different set of graphs, a useful feature for large deployments with multiple support teams. Cacti also boasts an easy to use albeit somewhat antiquated web-based interface. It can scale from a small business or home LANs to complex networks with thousands of devices on multiple sites.
Cacti uses RRDTool to store data in a SQL database and to create the graphs. It is primarily written in PHP, making it easy to modify to suit your needs. The tool has built-in templates for several types of devices. These templates already include most of the elements you might want to monitor. Cacti is so popular that many device-specific templates can be downloaded either from device manufacturers’ websites or from community-driven Cacti forums. The only thing missing from the product is a good alerting feature. But with its open-source PHP code, nothing stops anyone from adding it.