

NetCrunch by AdRem Software – REVIEW 2026
When it comes to monitoring networks, it seems like there are simply too many options to choose from. And while every vendor states that his product is better than its competitor’s for this and that reason, in the end, they are pretty much all the same. They all are different but the differences are usually in the minute details with most products essentially providing the same basic functionality.
The latest version of NetCrunch by AdRem Software is yet another network monitoring system. It has, however, some very interesting features and uncommon flexibility that set it apart from competing products. Keep reading to know more about this product, its features and what actually sets it apart from the rest of the crowd.
We’ll start off by having a look at what is required—or rather, expected—from a typical network monitoring tool. It will help us better understand how NetCrunch by AdRem Software can benefit you. We’ll then give you a quick introduction to the product, highlighting its best features. Our next order of business will be to discuss the product’s installation and initial setup, followed by a deeper look at the various types of monitoring that it offers. The software’s user interface and its alerting subsystem will then be discussed before we introduce its licensing and pricing structure.
About Monitoring Tools
We often compare network traffic to road traffic. This is actually a very good analogy and cars on a highway can be likened to packets on a network. But when it comes to monitoring, the analogy is not so great anymore. Whereas you can see highway traffic and easily spot when and if a problem happens somewhere, things are different on a network. Everything happens within cables or invisible radio carriers. In order to “see” network traffic, you need some special tool. This is where the network monitoring tool comes in handy.
At its base, a network monitoring tool will measure network traffic at various points on a network. To stick with the highway analogy, monitoring tools are the highway equivalent of these counting tubes you sometimes see stretched across a road. The latter counts passing cars while the former counts passing bits. Actually, monitoring tools don’t really count bits. It is the monitored devices that do the actual counting. Typical monitoring tools merely read the counters, compile the information and present it in a useful and meaningful way.
A tool like NetCrunch does way more than that, though. As we’re about to discover, there can be much more to network monitoring than simply reading traffic counters. Systems such as NetCrunch provide several types of monitoring and they allow you to keep a watchful eye on several important operational metrics of your network and the systems it comprises.
NetCrunch In A Nutshell
First and foremost, NetCrunch is a network monitoring system. It has, however, several features that set it apart from its competitors. AdRem Software claims it can monitor as many as a million metrics. This effectively means that the product scales up very well and will suit huge networks just as well as it will suit smaller ones. For optimal performance, the platform makes use of three databases. There’s a proprietary NoSQL database to store network performance metric history. There’s also an in-memory database which is used to store real-time statuses for quicker access, and there’s an embedded SQL database for storing alerts.
NetCrunch makes use of predefined monitoring packs which work by grouping common sets of performance monitors and alert conditions. In all, there are hundreds of these. They cover most types and brands of equipment. In addition to switches and routers from most major vendors, it will also monitor security devices from Cisco, Fortinet, Juniper and SonicWALL as well as NAS appliances from Buffalo, Netgear, Qnap and Synology. And if you need to monitor servers, there are even packs for Dell EMC iDRAC, Fujitsu iRMC, HP iLO and Lenovo IMM remote management controllers.
Customizability and flexibility are possibly the most unique characteristics of NetCrunch. Pretty much everything within the product can be customized. You can create live maps where you add widgets to show live data or status information. And with the console supporting multiple monitors, you’re not really limited in the size of your maps or the number widgets you add to them. Notification is another area that allows a lot of customization. The platform supports user profiles and groups and can even be integrated with Active Directory.
Installation And Discovery
The first step in using NetCrunch is installing it and setting it up and this is truly where the pleasure of using the product begins. The hardware requirements are relatively low. It will install on any 64 bit Windows server with at least two cores and 3.5 GB of RAM. The installation itself is easy and quick. When I say quick, I mean quick, really quick. We installed it on a Windows server, ran the discovery wizard and had a complete readout of our test network in about fifteen minutes. Granted our test network does not have thousands of components but it was still impressively fast. Furthermore, device identification was spot-on. The tool correctly identified all devices and systems including network devices, Windows servers and workstations, virtualization hosts, and even vintage Macintosh devices. And once the discovery was complete, monitoring started right away and alerted us that one system was running low on memory.
A Look At NetCrunch’s Monitoring Features
We’ve briefly touched the vast array of what can be monitored with NetCrunch. Let’s now have a more in-depth look at the various types of monitoring that are available and explain how each one works and what it can do for you. If you’re anything like me, you’ll be impressed at all that’s available.
SNMP Monitoring
SNMP stands for Simple Network Management Protocol. It is the most basic type of monitoring. The one that pretty much all monitoring tools use. One of the biggest advantages of using SNMP is that the client part or agent is built into most network-attached devices. All enterprise-class switches and routers—and even many home devices—support the protocol. Monitoring tools use it to read operational metrics from the devices they monitor as well as their interface counters. The use the data from these counters—which just count bytes in and out—to extrapolate the average bandwidth utilization of each interface.
NetCrunch has built-in support for all SNMP versions as well as support for SNMP version 3 traps. It can use SNMP to monitor routers, switches, printers, firewalls, sensors, and most SNMP-enabled devices. Using SNMP will let you monitor various metrics such as user activity, hardware utilization, network bandwidth, and more. The platform can use SNMP actively by reading performance counters, or passively by receiving SNMP Traps from networked devices. Thresholds can be set to notify administrators of potential issues.
Switch And Router Monitoring
When monitoring switches and routers, NetCrunch can monitor several aspects of their health, including the status of device interfaces and per-interface bandwidth usage. The tool will also display information about each switch port including VLANs, port status, and devices connected to each port. It will also discover and map physical layer 2 connections between switches and nodes and built topology maps. These physical maps can be automatically updated when new nodes are added or when connection changes are discovered. And if your network is made of Cisco devices, NetCrunch will also let you monitor Cisco IP SLA performance and operational parameters. This would, among others, enable you to monitor VOIP jitter.
Server And Operating System Monitoring
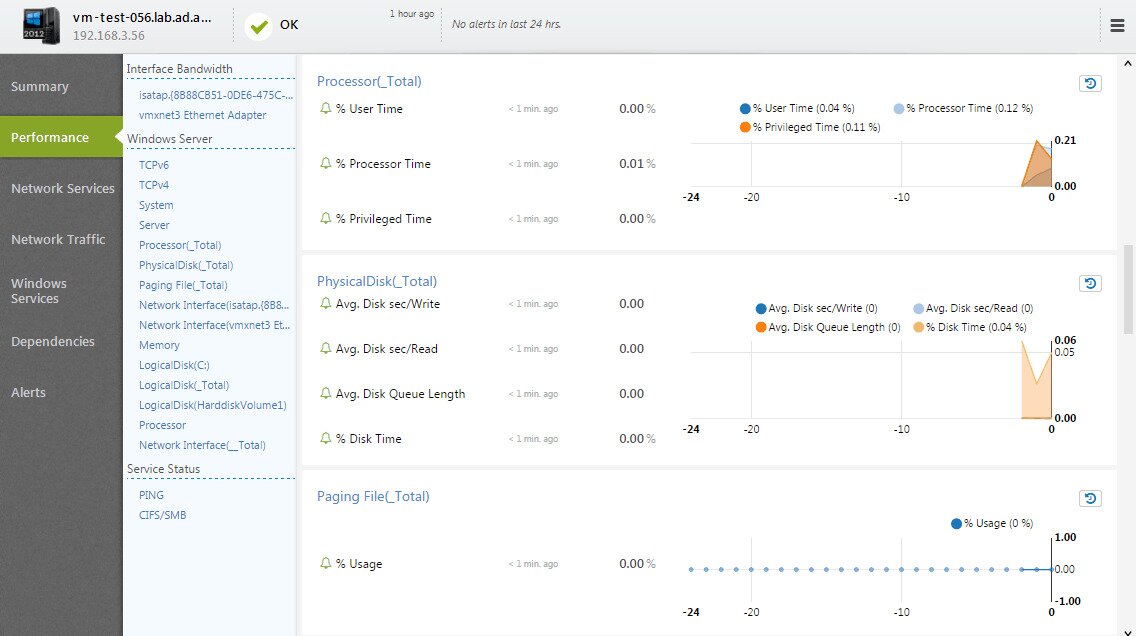
NetCrunch is not just a network device monitoring platform. It will also monitor your servers. Both physical and virtual servers are supported and, for virtual servers, their hosts’ operational metrics can also be monitored.
For Windows servers, there is not much that NetCrunch won’t monitor. It can monitor all performance counters, including, for example, disk counters. The actual list of what can be monitored largely depends on the specific system and its installed applications. You can, of course, set alert thresholds on performance counters using eight different types of trigger. The tool will also monitor Windows services and alert you if a required service stops running. Furthermore, NetCrunch can monitor applications running on servers. It can even monitor files and folders, potentially alerting you of a missing file or, if you prefer, of an unplanned change to any given file.
But not all servers are running Windows. If your environment includes other operating systems, you’re covered just as well. On Linux, for instance, NetCrunch will track more than 100 performance counters to determine the health of servers running kernel 2.4 or newer. Administrators managing BSD, Solaris or Mac OS servers are covered as well with operating system-specific monitoring packs.
Another strength of NetCrunch is its monitoring of VMware ESX. The platform supports ESXi version 5.5, 6 and 6.5 and connects directly to the ESX servers, without the need for vSphere to be installed. It comes with pre-configured Automatic Monitoring Packs that make monitoring virtual hosts a breeze. The monitoring packs will allow you to easily monitor the hardware, the ESX software as well as the guest virtual machines running on your hosts.
Application Monitoring
Although not an application monitoring platform, NetCrunch comes bundled with a ton of application-specific monitoring packs. One such pack, for example, will monitor most virus protection packages and ensure they are running in good order. Other packs are available to monitor most server-based Microsoft applications. You have, for example, packs for Exchange, IIS, ISA, MS Project, MS SQL, and SharePoint.
The software will also monitor major applications from various third-party vendors. For example, monitoring packs are available for ARCserve, Avaya Modular Messaging Server, Blackberry Enterprise Service, CiscoWorks, Citrix Xen App server, Lotus Domino server, Oracle and Squid, just to name a few.
Traffic Monitoring
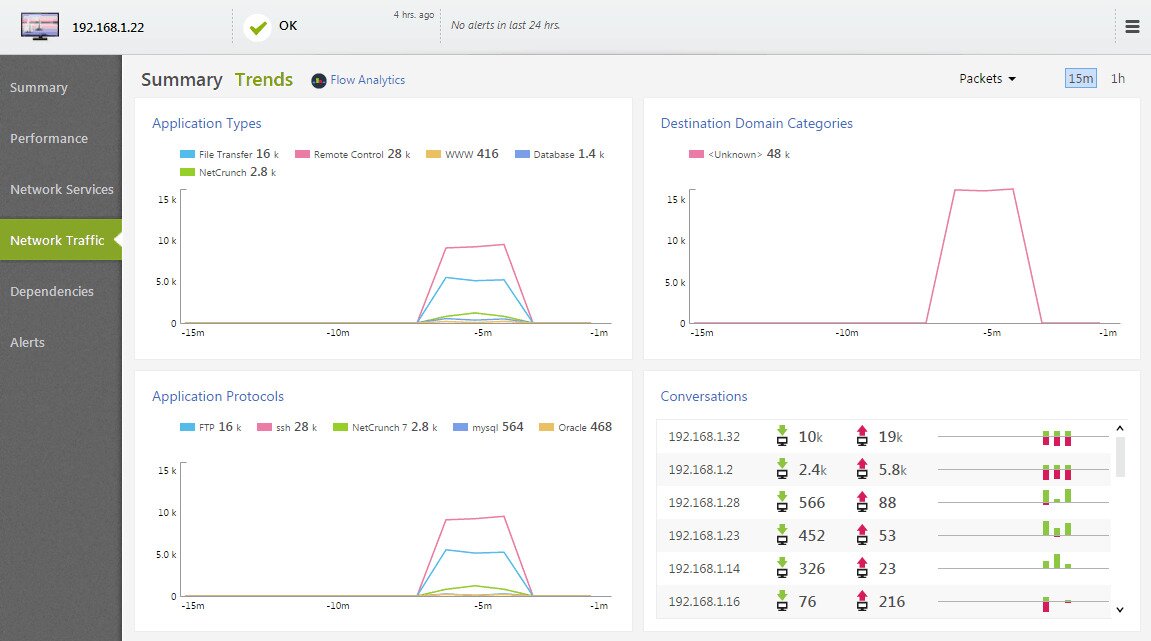
NetCrunch supports flow analysis for traffic monitoring. Flow analysis is a type of monitoring which relies on the monitored network devices to capture data about the various data flows they transport and send the, to an external analyzer and collector. It includes a NetFlow collection and analysis module which is able to process flow data from a range of network devices using all popular flow analysis protocols such as NetFlow (v5 and v9), IPFix, sFlow, JFlow, netStream, cFlow, AppFlow, and rFlow.
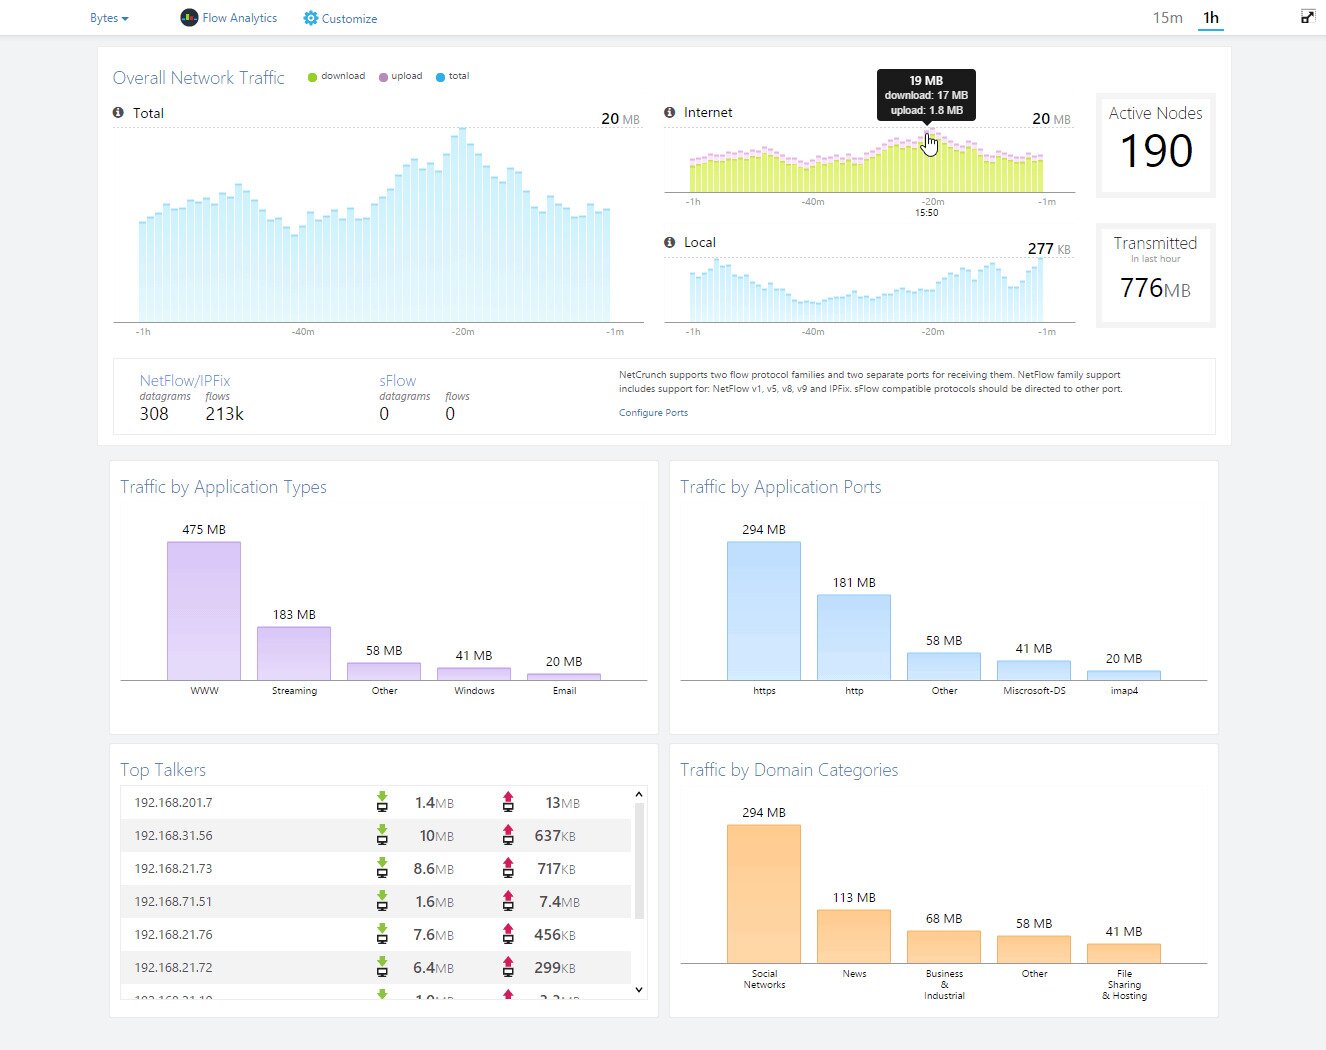
NetCrunch integrates flow data within its monitoring database, ensuring that traffic is measured properly per device instead of per IP address, letting you analyze traffic using various criteria. Furthermore, it also allows you to create custom application definitions and it supports Cisco NBAR technology for application monitoring. NetCrunch collects performance trends on summary traffic data as well as specific node data, letting you create reports or set alerting thresholds on these parameters.
Remote Probes
One of the newest features of NetCruch is the possibility to use remote probes. Remote probes can be installed in external locations to extend the monitoring capabilities of the platform. They can be thought of as satellite instances of the product under centralized control. This is a brand-new feature of version 10.6 and it permits the monitoring of remote resources using any of the available sensors including not only SNMP but also WMI, SQL and several more. And to make things even better, remote probes also support network discovery.
NetCrunch remote probes are perfect for remote locations where no network administration staff is present. Alerts can be set on the remote probe node and a notification can be issued if and when the probe connection goes down. So, not only will it monitor remote locations, but it will also notify you if it ever stops working for whatever reason. Talk about robustness.
Log Monitoring
Log collecting monitoring systems are rarely built into monitoring tools. This is different with NetCrunch which includes that functionality. The tool offers many predefined event log views and it lets you create custom ones using an intuitive query builder. The created views can then be saved and used for any node group. And for each event in the event log, this product offers a details view containing all alert details and parameters. For instance, if an alert was triggered on a performance counter value, the tool will display a chart showing metric values at the time of the alert.
The NetCrunch file sensor is used to monitor text log files which it can fetch through FTP/s or HTTP/s, Windows/SMB and SSH/Bash. This sensor can even process logs remotely without having to download them. The product come built-in with parsers for common log formats and it allows you to write own parsing expressions using various methods such as regexp, Javascript, for example.
Wait! There More!
So far, we’ve covered a lot of what NetCrunch can monitor but, even if we’re going to look like an infomercial, there’s way more than what we’ve mentioned. In fact, there is so much monitoring power packed into this tool that it’s simply impossible to cover it all in detail.
For instance, NetCrunch can be used to monitor Apache web servers. Its Apache sensor will let you monitor various performance metrics. There’s also an advanced web page sensor which can load and render dynamic web pages containing Javascript as if a browser loaded them. It even allows you to check pages requiring a login while supporting both standard HTML or custom login forms.
For even greater flexibility, NetCrunch can read data using multiple protocols such as FTP/S, HTTP/S, SSH/Bash, SFTP, or Windows/SMB. It supports various formats including JSON and XML and also allows creating custom data parsers for specific data.
NetCrunch’s User Interface
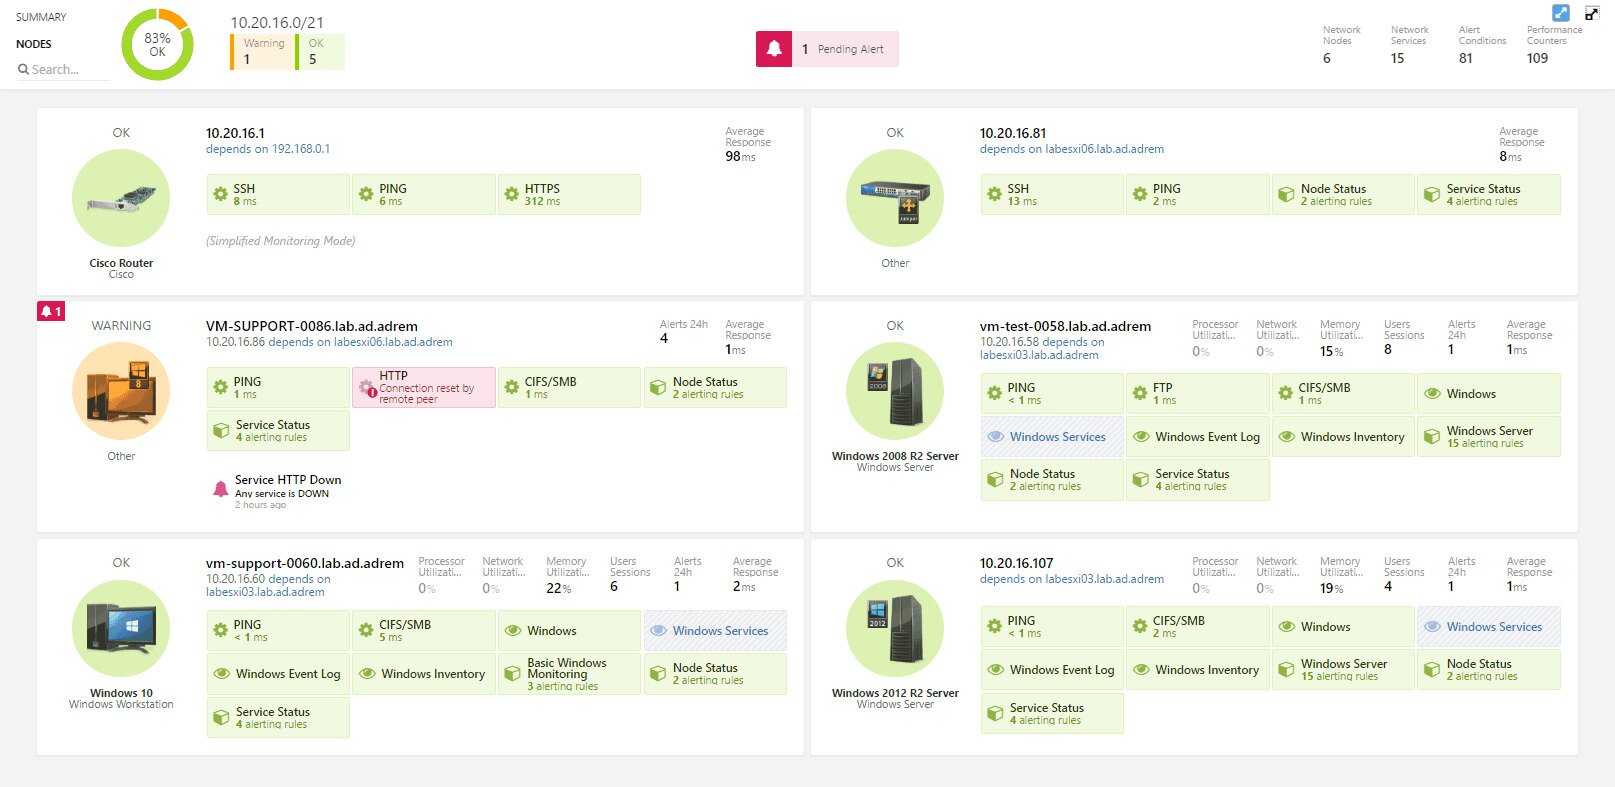
It’s one thing to collect data but what good is it if you don’t make it available. The user interface is another place where NetCrunch really shines. The main element of the NetCrunch console is called the Atlas and it presents a highly customizable, colour-coded overview of all monitored devices. It lets you see at a glance which devices have issues or which ones are down and automatically presents you with views based on the content selected in the left pane. The “Smart Pages” functionality takes this to the next level. The Atlas and the console offer full search facilities, making it easy to find a device of interest.
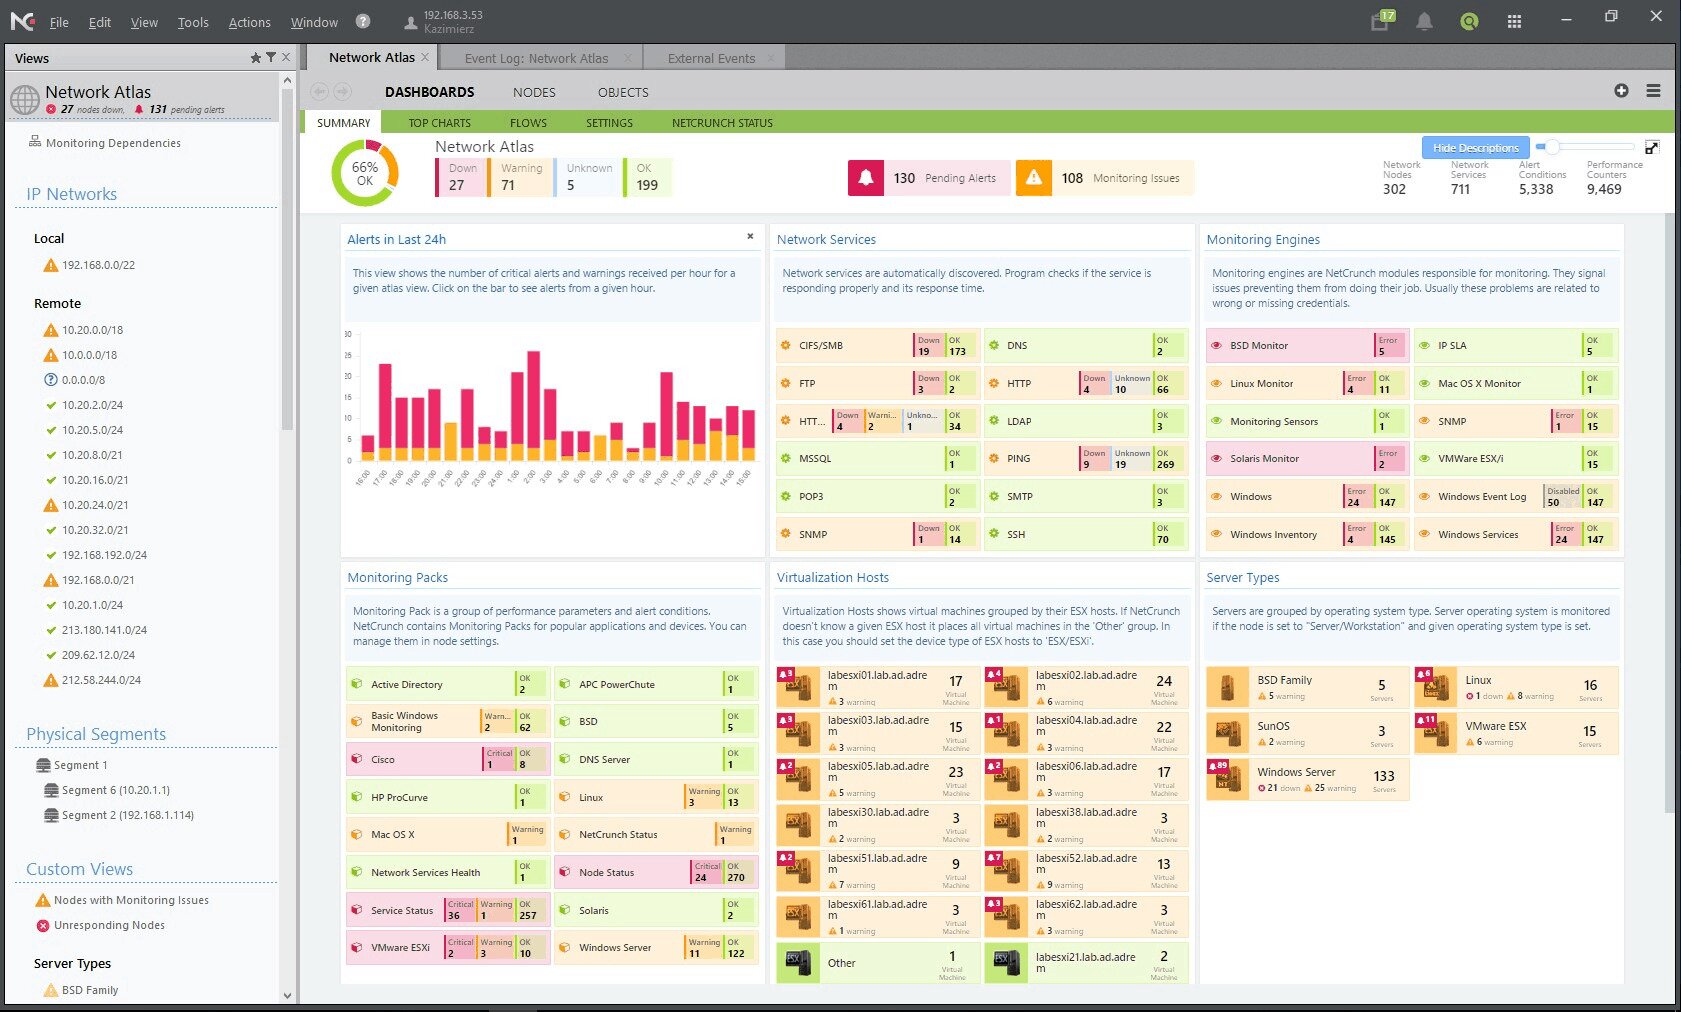
To make things even more interesting, custom pages can be easily created and selecting a network segment in the left pane will bring up a Layer 2 map with real-time views of network traffic passing between each node. This is one of the monitoring tools that makes the best use of the visual presentation.
Alerting in NetCrunch
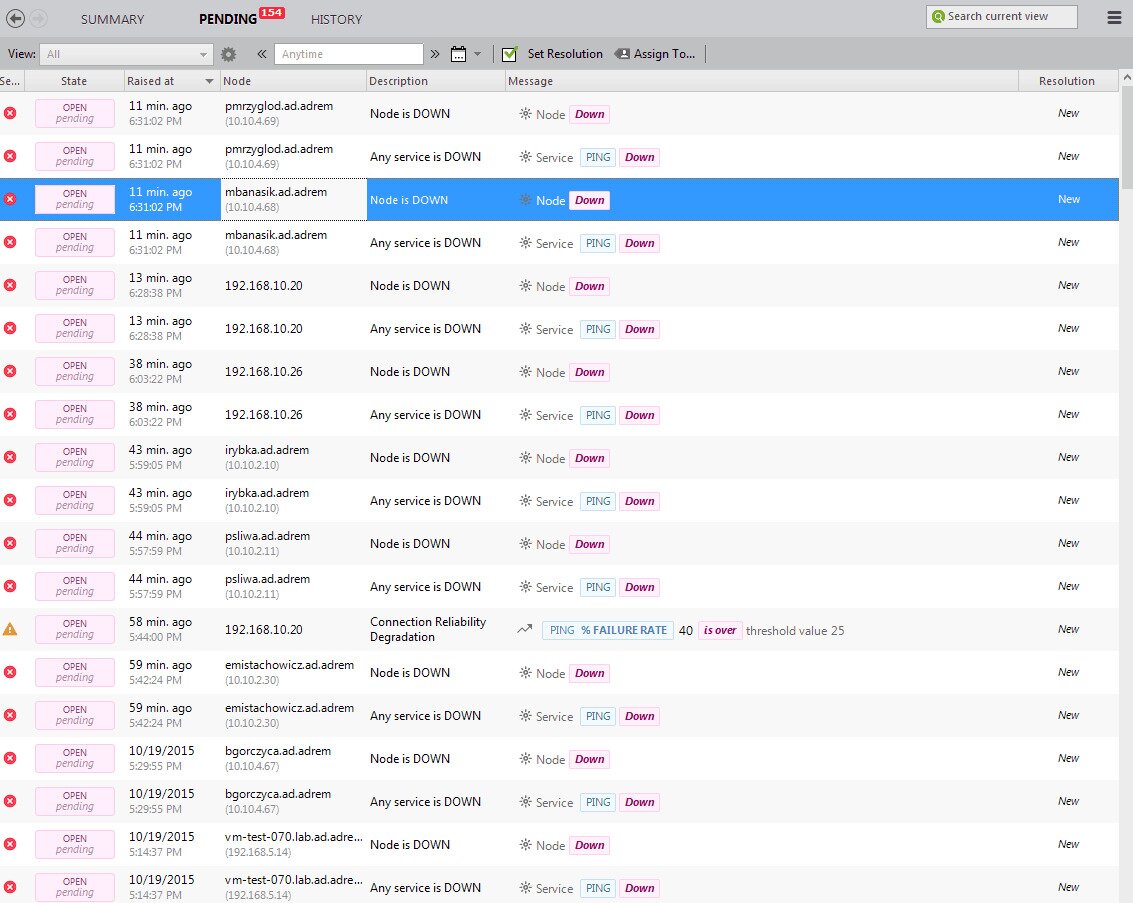
OK, now we have a tool that can monitor just about anything computer-related. We also have a tool that can display various monitored parameters in highly customizable ways. There’s only one problem left. You probably don’t want to have someone sit at the tool’s console twenty-four hours a day just in case it detects something odd worth closer inspection. This is where alerting comes in. Most monitoring tools do include some form of alerting but NetCrunch brings it one step—or should I say one leap—further. It has one of the most flexible and configurable alerting systems.
NetCrunch supports both internal and external alerts. Internal ones are triggered whenever a monitored parameter reaches or exceeds a given threshold. As for external alerts, they are received from external sources such as SNMP traps, syslog or Windows events. The tool even supports conditional alerting that can, for example, only notify you when a combination of alerts is raised or when an alert has been raised a certain number of times within a time frame. Several more conditions are available making this a very flexible tool.
Alerts in NetCrunch trigger actions. As a response to an alert, this tool can execute a sequence of actions. You can choose between a number of actions such as notification, logging, control actions and remote script execution. Notifications can be controlled by user profiles and groups, and they can be combined with a node group membership, making it possible to send notifications to different groups based on network node location or some other relationship.
Actions in NetCrunch can be executed immediately or after a specified delay. For example, you could configure the tool to send a notification to some person and then, after some time, execute a server restart operation. Alternatively, you could opt to send the next notification to a different person. This all makes for one of the most flexible systems.
Licensing And Pricing
NetCrunch is available in several flavours with increasing functionality. The most basic level is the NetCrunch for SNMP Devices. It includes SNMP monitoring with SNMPv3 support, SNMP traps, a MIB compiler, and the monitoring more than 70 network services. It full-featured and has dashboards, graphical maps, and event database.
The next level is NetCrunch for Network Infrastructure. It is also primarily based on SNMP monitoring and it contains all the SNMP features and adds layer 2 mapping and monitoring, VLAN support and flow analysis with Cisco NBAR2 support.
Next up is NetCrunch Performance Monitor, a comprehensive package for monitoring anything on your network. It supports SNMP devices, logs, servers, operating system, VMware, WMI, IPMI, Web, Cloud, and other applications.
At the top is the NetCrunch Monitoring Suite. This is a complete all-in-one package with all advanced features necessary for managing a high number of monitored elements. It is the most scalable NetCrunch option with the ability to manage thousands of nodes and metrics.
NetCrunch is licensed per-node or per-interface, depending on which of the two numbers is greater, and all purchases come with 1 Year upgrade subscription, maintenance, and support. Prices are not readily available but can easily be obtained from AdRem Software by requesting a quote. If you want to give the tool a try before purchasing it, a 30-day trial version can be downloaded from AdRem’s website.
Final Words
What more can be said about NetCrunch by AdRem Software? We’re dealing with one of the most complete all-in-one monitoring solutions you can find. It will support most—if not all—your networked devices and provide you with the peace of mind of knowing that no event or issue will go unnoticed. A large number of customization options can make setting up the tool a bit more involved than some other competing tools but this is highly compensated by the uncommon flexibility built right into the platform.