

6 Best Network Management Software Tools and Systems that Track Performance
Monitoring your network’s performance involves keeping an eye on the activities of the equipment on your Local Area Network (LAN). This can be achieved using tools like Simple Network Management Protocol (SNMP), SolarWinds Network Performance Monitor, Paessler PRTG, ManageEngine OpManager, WhatsUp Gold, Spiceworks Network Monitor, and Zabbix. These tools are essential in preventing capacity issues by closely monitoring the switches and routers that link your network together. If a network device becomes overloaded, all the traffic passing through it will be slowed. Therefore, using these network monitoring tools can help in identifying and resolving such issues promptly.

Although the best network management tools and systems cost money, in the long run, they will reduce your costs. If the network slows down frequently, your staff will not be able to complete all of their tasks efficiently and that will impact your turnover, thereby reducing your profit. A poorly performing network increases calls to the IT Help Desk, so saving on network management software ends up increasing the IT support budget.
The majority of network management tools and software are remarkably similar. They rely on the Simple Network Management Protocol for source data. The difference between tools comes down to how they manage and represent the SNMP data.
Best Network Management Tools
Here is a quick list of our recommendations on the 6 best network management tools and software:
- SolarWinds Network Performance Monitor
- Paessler PRTG
- ManageEngine OpManager
- WhatsUp Gold
- Spiceworks Network Monitor
- Zabbix
You can read details about these tools in the following sections.
1. SolarWinds Network Performance Monitor (FREE TRIAL)

SolarWinds is a world leader in the IT infrastructure monitoring software market, and the Network Performance Monitor is the company’s key product. The Network Performance Monitor uses SNMP for device discovery and ongoing monitoring. The software installs on the Windows Server environment, and will perform an initial system sweep on starting operations. From the information that enquiry gathers, the NPM will compile a hardware inventory and generate a handy network map. The NPM can handle both SNMPv2 and SNMPv3.
Alerts. The dashboard of the Network Performance Monitor shows alerts in a list. You can also get those alerts written to file. The display of alerts can be filtered so that you only get notifications of a specific warning severity or from specified sources. You can also combine conditions to create customized alerts. The monitor extends its vision to remote devices on WANs and also cloud servers. The system can also monitor wireless networks.
Mapping. The mapping capabilities of the NMP include a straightforward relationship drawing that plots connections between all of your devices. For an analytical perspective, you could access the NetPath feature of the Network Performance Monitor dashboard. It shows the network connections from one node on your network through to another. This functionality also extends out to cloud servers. The wireless monitoring capabilities of NPM include wireless heat maps, which show the WiFi signal footprints drawn onto a floor plan of your offices. These heat maps let you see where there are signal dead zones and where there is too much signal overlap.
Modularity. The monitoring and analytical capabilities of the Network Performance Monitor can be extended by integrating it with other SolarWinds tools. The company created a common platform for IT infrastructure management systems, called Orion. This platform makes it possible for different SolarWinds products to fit together, share data, and contribute to cross-modular facilities. These other tools include a bandwidth monitor, a virtualization manager, a server and applications monitor, and a configuration manager.
The SolarWinds Network Performance Monitor is the leading network management tool in the world, so you should expect to pay a good price for it. The starting cost is $1,785; however, you can get a full working version of the NPM for a 30-day free trial to assess its capabilities.
2. Paessler PRTG
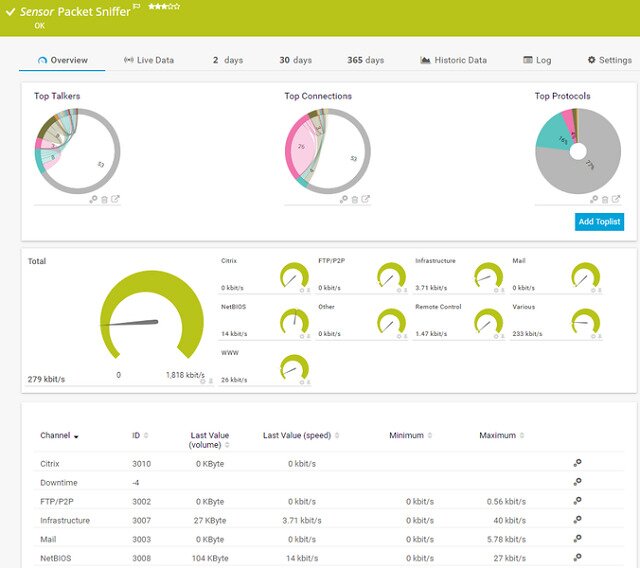
Paessler PRTG is a package of monitoring tools presented in a single unified interface. The utility monitors network devices, servers, and applications and it can also track, record, and analyze network traffic. The architecture of PRTG is built up from “sensors.” Each sensor specializes in monitoring one component of a network or one condition. The price of the service is calculated in terms of the number of sensors that get activated. So, you can tailor the system to just one module, such as a network performance monitor tracking your network devices, or you can activate many, many sensors across modules to create a comprehensive infrastructure management system. You don’t have to pay anything to use the system for up to 100 sensors.
Monitoring & Alerts. The network performance division of PRTG uses Ping and SNMP to identify and track your switches and routers and also all of the other devices that are connected to your network. You will get SNMP alerts reported in the dashboard, and you can also choose to have them written to a file. The conditions that trigger alerts can be customized, enabling you to string several warnings from different sources together in order to construct an alert that would really grab your attention. It is possible to filter out some conditions so that you don’t get pestered by relatively unimportant warnings every hour of the day. You can get alarms sent to you by email or SMS and the interface allows you to specify conditions that direct different types of alerts to different team members.
The visibility of PRTG extends to WANs and cloud servers and it can also monitor wireless networks. The complexities of virtualizations are easy to monitor with PRTG because it has application, server, and network monitoring capabilities out of the box.
Mapping. PRTG has some great mapping capabilities. Maps in different formats are generated automatically, but you can customize them with a map editor. The distinctive PRTG map layout is its starburst layout, which shows the application, service, and hardware stack that supports each piece of software that your users access.
Paessler offers a 30-day free trial of PRTG with unlimited sensors. Paessler PRTG installs on Windows Server and is also available as an online service.
3. ManageEngine OpManager (30 DAY FREE TRIAL)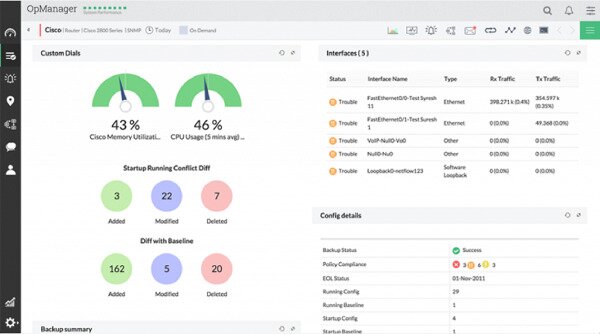
ManageEngine is probably the third of the world-leading infrastructure management software producers. The company is a division of Zoho Corporation, so not only can its tools work together, but they are also compatible with the Zoho stable of business applications. OpManager is the key tool that ManageEngine produces. It is the network performance monitor of the company’s range of products.
Monitoring. OpManager uses SNMP to track the health of network devices. It also includes network discovery functions and automatic network mapping. The dashboard includes some great graphical representations of data and it also shows alerts as soon as they arise. You can access the dashboard through mobile devices. The monitoring capabilities of OpManager extend to wireless networks and the system can cover remote networks on a WAN and cloud-based servers. The ability to monitor distributed networks is available in the Enterprise Edition, which is more expensive than the standard Essential package. All ManageEngine software installs on Windows Server or Linux.
Modularity. It is usual for customers to start with OpManager and then add on other monitoring tools from the ManageEngine catalog — they are all able to integrate with each other and contribute data and functionality to common modules. This includes virtualization monitoring capabilities.
ManageEngine offers a free version of OpManager that will monitor up to five devices. You can access a 30-day free trial of the system without any device limits.
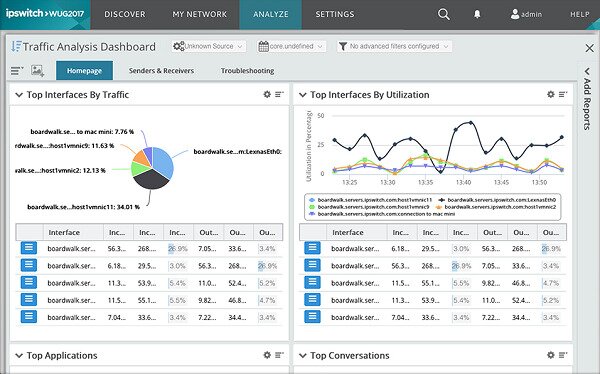
4. WhatsUp Gold
Sponsored by VistaPrint
25% off for new customers on their first order | Promo Code: NEW25
Ready to bring your brand to life? Print it on almost anything with VistaPrint. Take 25% off your first order | Code: NEW25
Print it!
Although the top three tools in our list offer scalable pricing plans that should appeal to all sizes of enterprises, the full capabilities of those utilities would probably be better suited to big networks. If you don’t have a large team to help you manage your networks, you probably won’t ever use all of the facilities of those tools and the WhatsUp Gold network management system would suit you better. This is a tool that is a good choice for medium-sized networks. However, the tool is also capable of monitoring WANs and cloud-servers and it can cover wireless networks as well as LANs.
Monitoring & Add-ons. WhatsUp Gold employs SNMP to monitor network equipment and other devices connected to your LAN. The monitor automatically traces all devices on the network and logs them in a register. It also generates network maps automatically. The dashboard of the monitor shows you alerts, which you can customize. The alerts can also be forwarded to you by SMS or email.
The standard WhatsUp Gold package is capable of monitoring virtualizations. However, you can get deeper intelligence on VM performance with a Virtualization Monitoring add-on. Other add-ons that extend the capabilities of WhatsUp Gold cover configuration management, VoIP monitoring, Cloud monitors, application and server monitors, and network traffic analysis.
WhatsUp Gold is available on a 30-day free trial.
5. Spiceworks Inventory
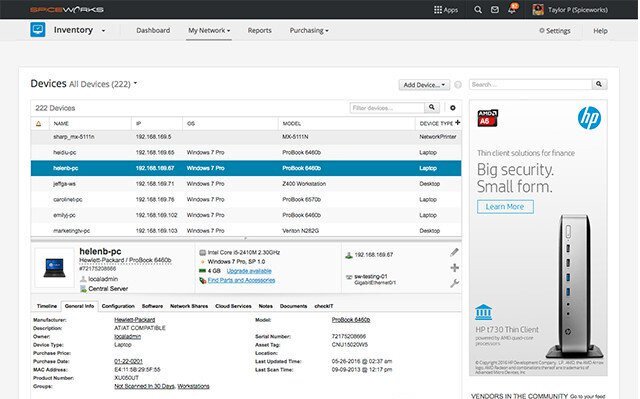
If you don’t want to pay anything at all for your network management software, then you should check out Spiceworks, which is ad-supported. This is a very attractive tool that includes a sophisticated dashboard featuring graphs and dials to make event comprehension simple. The software installs on Windows, Mac OS, and Debian or Ubuntu Linux. The tool is also available as an online service.
Tracking & Configuration. The Spiceworks monitor uses SNMP to track all of the equipment that you have connected to your network. The tool includes an autodiscovery feature that will compile your hardware inventory and map your network. The monitor tracks servers and applications as well as network devices. A very useful management function built into Spiceworks is its configuration manager and its automatic patch management system. You don’t even need to look out for new versions of your firmware and software because the tool does that for you.
Spiceworks Inventory is a very comprehensive tool for small and middle-sized network. It can monitor cloud servers and wireless systems as well as standard wired on-premises LANs. The tool interfaces with Active Directory to match up users to activities, so you can track suspicious account activity and even record which administrators were responsible for which system changes. The tool integrates with Help Desk software produced by Spiceworks, which is also available as an online service.
You just have to learn to put up with all of the adverts.
6. Zabbix
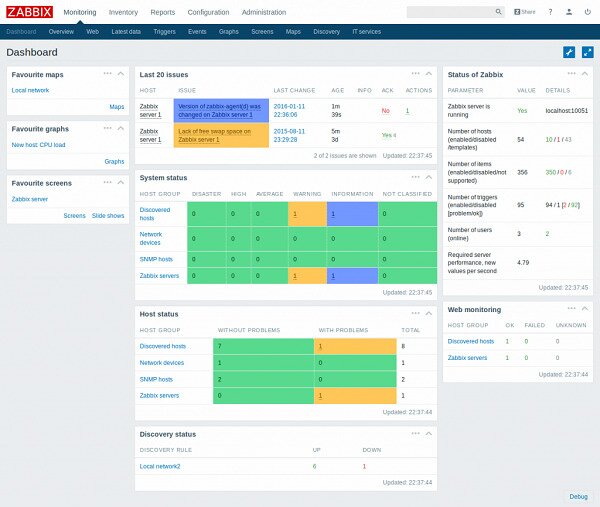
Zabbix is another free option that is worth considering for small and middle-sized networks. This tool uses SNMP to discover and monitor all of the devices connected to your network. Ongoing monitoring activities include the ability to receive alerts, which are displayed in the tool’s dashboard. Those notifications can be stored to file and also sent as email, SMS, or messenger alarms. Zabbix will compile and maintain a device inventory and also create a network map. The tool can include wireless networks and Cloud servers in your monitoring system. You can even set up actions to perform on the receipt of alerts. Those actions include data gathering routines and remediation scripts.
Monitoring & Security. Zabbix isn’t limited to network device monitoring systems. It also monitors servers, applications and network traffic. That’s a good combination for those who want to monitor VM implementations. This tool will automatically gather a list of all of your equipment, their attributes, and statuses and store that information in an inventory. The monitor continues to check for the presence of new devices and can spot when equipment is retired or moved. The discovery module will also create a network map for you.
If you are covering multiple sites from one central monitor, Zabbix would be a good option because it encrypts all communications between the manager console and sensors so snoopers on the Internet will be locked out.
Support & Reporting. A Zabbix community provides you with tips and support when you run into trouble. The knowledge base on the Zabbix website is not so hot and if you want customer support from the company, you have to pay for it.
Zabbix runs on Windows, Linux, Unix, and Mac OS. The reporting functions of the system are not so great, but you can pick up formats from the user community or write your own custom reports.
Simple Network Management Protocol
The Simple Network Management Protocol is an open standard. That means that it is not owned by anyone and it is free to download and use. The standard is maintained by the Internet Engineering Taskforce and is available in the document RFC 3411.
There have been three full versions of SNMP since its creation in 1988. The second version of the protocol has three variations. The difference between these is the method each uses for authentication. The base version, SNMPv2 uses a party-based verification system. This is very difficult to implement, so it is hardly ever used. The two other editions of this standard are SNMPv2c, which uses a “community-based” system for authentication and SNMPv2u, which has a user-based model. Of these, SNMPv2c is by far the most widely implemented.
Although SNMPv3 has been a stable definition since 2002, there are still many implementations of SNMPv2c operating on network devices around the world. It is very likely that you have some devices on your network that follow SNMPv2c and others that use SNMPv3. So, it is important to get a network monitoring system that can interact with both of these versions of SNMP.
SNMP Benefits
SNMP defines a framework for central network monitors to communicate with all of the devices connected to the network. The standard includes a communication format, which is called the Management Information Base, or “MIB”. This is a file structure that allocates codes to different components of a network device and their properties. The coding system follows a tree structure. Manually decoding the meaning of MIB codes is a very complicated process, but you can get interpreters for free that will explain this structure.
Ubiquitous
SNMP is so widely used that any manufacturer wanting to get into the market for network equipment has to include an SNMP agent in its devices’ firmware. So, if you want to implement SNMP on your network, you don’t have to install any software on your network equipment, you just need a central management program that will communicate with SNMP agents. On some equipment, the SNMP agent is turned off by default.
Fast Alerts
The SNMP controller sends out a request broadcast at regular intervals. Each device agent is a daemon that checks the statuses of different attributes on the piece of equipment that it is monitoring and updates its MIB file. When the agent receives a request for information from the central controller, it sends back the current version of its MIB.
If the device agent picks up a critical condition on its piece of hardware, it updates its MIB with that information and sends that file to the controller immediately, without waiting for a request for information. This message is called an SNMP trap and it is the source of the alerts that the controller program will push straight through to the dashboard of your network monitoring system.
The trap mechanism means that SNMP reports on alert conditions much quicker that other network device monitoring methodologies. This is what makes this system so universally adopted.
Network Discovery
The constant polling for statuses that the SNMP system incorporates brings the benefit of enabling the controller to spot devices. This is often termed an “autodiscovery” feature, and is a common facility of all SNMP-based network management tools.
The first request for information brings back an MIB file from each device that is connected to the network. With this information, the controller can discover each device’s type, its manufacturer and model and also which other devices it is connected to. This information gets written into a registry and gives the network management tool an initial list of all contactable devices on the network.
The link information contained in the MIB enables sophisticated network management tools to automatically draw up a map of the network. The producers of network management tools compete to provide innovative and eye-catching network maps, because this is an area of network management where a tool can differentiate itself from all of the other systems operating with SNMP procedures.
Immediate Registry Update
As the network management tool continues to monitor the network by repeatedly sending out information requests and receiving back MIBS, it instantly notices when a device does not respond, marking that devices as removed from the network. It can also recognize when a new device is attached to the network because it will receive an MIB from that component for the first time.
By checking on the connection information reported by each device, the central controller can spot when a device is moved from one area of the network to another. Thus, the registry can be updated immediately, and the network map can be redrawn to display the current layout of the network. This feature is a great time saver for network administrators because it removes all of the manual tasks needed to maintain a hardware inventory and keep track of the relationships between devices.
Choose a Network Management Tool
Thanks to industry standards such as SNMP, there are many solid network management tools on the market that all have the same basic competence. The extras that each producing company adds to its network monitors create the differences between them. Some excel at tracking virtualizations, while others excel at network mapping and WAN management. Nowadays, there are network management tools that specialize in monitoring cloud-based servers and network services and many of the network monitors on the market are delivered as cloud services themselves.
Ultimately, your choice of network management tool will come down to which has a layout that pleases you most and which has extra features and specializations that map more precisely to your requirements. Fortunately all of the options in our list are available for free or can be tested on a free trial, so you can try each before you make your decision. But overall, SolarWinds Network Performance Monitor has an edge over the other 5 products thanks to features like Intelligent maps, NetPath, and PerfStack for easy troubleshooting and Smarter scalability for large environments.
Do you use a network management tool? Have you tried any of the tools on our list? Which network monitor did you choose and what led you to that decision? Leave a message in the Comments section below and share your experience with the community.