

SolarWinds Network Performance Monitor vs PRTG – Comparative Review
Given the size of modern networks and considering how resources are often distributed to multiple sites, including the cloud, monitoring tools have become a key element of many organizations. Every administrator needs to keep an eye on everything and there is no way it can’t be done without the proper tools. The most common type of monitoring tool is certainly the all-in-one monitoring tool which combines different types of monitoring. There’s a huge variety of those tools available but the SolarWinds Network Performance Monitor (NPM) and the Paessler PRTG Network Monitor (PRTG) are among the most popular. Today, we’re comparing these two products to help you determine which of the two is best adapted to your specific needs.

We’ll begin our journey by exploring network monitoring. It will help better understand the differences and similarities between the two products. Next, we’ll describe SNMP as it is the most-used monitoring technology. We’ll explain what it is, where it’s coming from, and how it works. But since SNMP is only one of many different technologies used to monitor networks, we’ll have a look at what other options are available. Then, we’ll have a look at the SolarWinds Network Performance Monitor, its main features, its pricing structure, its pros and cons. We will then do the same for PRTG. Next, we’ll do a comparison of both products so you have a good understanding of what their similarities and differences are. And we’ll conclude by giving you our honest opinion about the two products.
A Few Words About Network Monitoring
Monitoring has a different meaning depending on who you ask. Add to that the fact that there are several different types of monitoring and we have the perfect recipe for confusion. The most basic type of monitoring is what we often refer to as ping monitoring, or up-or-down monitoring. The idea is to use ping to verify that each monitored device is responding. Other than the response delay, this type of monitoring records no performance data about the monitored systems.
The next type of monitoring is bandwidth usage monitoring. It typically uses the SNMP protocol to read interface counters from monitored devices and computer the average bandwidth usage of their interfaces. It is particularly useful when monitoring bandwidth-limited segments of a network, such as WAN circuits. This type of monitoring can give you a quantitative view of the traffic at any point of the network but, although it will clearly show any congestion, it won’t help with determining what is causing it.
This is where the next type of monitoring comes in. It is referred to as network traffic analysis. It goes deeper than the previous type and can do some crude traffic analysis to reveal what is consuming bandwidth. It will, for instance, reveal what users, what computers or what applications are using the most bandwidth. It provides more of a qualitative view of network traffic.
The next type of monitoring goes deeper by reading the operational metrics of the monitored devices. It is typically used to monitor any kind of devices from routers and switches, to servers and databases. It uses various protocols and technologies to connect to devices and read their operational parameters. Typically, information such as CPU and memory loads, disk space and any other interesting data can be collected and displayed.
SNMP In A Nutshell
Since the Simple Network Management Protocol is the most-used monitoring technology, let’s take a closer look. Despite its name, simple is definitely not the term I’d use to describe the protocol which lets a management station—or, in our case, a monitoring tool—read and set a number of operational parameters. It is often said that SNMP monitoring is an agentless monitoring technology. In fact, although it rarely requires installing any extra software on the monitored device, there is an SNMP agent running on each monitored equipment. It is usually built into the operating system or firmware which is why it is not referred to as an agent.
Without going overly technical, let’s have a look at how SNMP works from a monitoring perspective. Simply put, the monitoring tool sends a request to the device for a specific parameter. The request, which is not encrypted, contains a “community string” which can be compared to a crude password authentication mechanism. The monitored device validates the community string and returns the requested value. This is a highly simplified version of the process so forgive me if I left out important parts of the protocol. Our goal is not to provide an SNMP tutorial but rather an understanding of how SNMP monitoring works.
Let’s pretend that a monitoring tool is configured to monitor the bandwidth usage of a router interface facing a WAN circuit. Two specific SNMP parameters are of interest, the bytes in and bytes out counters of the interface. They are read on a regular basis—a typical value is every five minutes—and stored in some sort of file or database. Then, the monitoring tool subtracts the previous value of the counters from the current one, giving the number of bytes transferred during the interval. It divides these numbers by the number of seconds between the two reading, giving the number of bytes per second and divides this by eight to get the number of bits per second. The resulting values are stored in a database and/or plotted on a graph showing its evolution over time.
Other Monitoring Techniques
As commonplace as SNMP is, it is not the only—or even the best—monitoring technology used. Several other technologies are available, depending on what type of device you are monitoring and what information you are trying to collect from the device. Let’s have a quick look at some of the most common.
The Windows Management Instrumentation, or WMI, is a Windows-specific protocol that can be thought of as an evolution of SNMP. Its purpose is similar—managing and monitoring systems remotely—but its operation is different. It is typically more secure, more flexible and can provide more information. The main drawback of WMI is that it is only available on Windows hosts.
WBEM—which should not be confused with WebM—is an acronym for Web-Based Enterprise Management. It is an open standard for the remote management and monitoring of systems. Sounds familiar? WMI is Microsoft’s proprietary implementation of WBEM. It is typically used for monitoring non-Windows hosts such as Linux servers, for example.
Agent-based monitoring is another popular technique which relies on a local agent running on the monitored system. It differs from the other methods in that the agent is not built into the operating systems but is usually supplied by the monitoring tool’s vendor. It is, therefore, totally adapted to both the tool and the monitored system and it will often allow the monitoring of metrics which would not be available using other methods. The main disadvantages of agent-based monitoring are that it requires that an agent is installed on monitored systems and that running the agent can have an impact on the monitored system by using part of its resources.
1. SolarWinds Network Performance Monitor (FREE Trial)
Before we look at the Network Performance Monitor, let’s talk about SolarWinds. The company has been around for about 20 years and it enjoys a solid reputation as the maker of some of the best network and system administration tools. Several of its products have received rave reviews and are considered among the very best in their respective field. To add icing on the cake, SolarWinds is also famous for its many free tools. They are smaller tools which address a specific need of network administrators. Two good examples of those free tools are the Real-time Bandwidth Monitor and the IP Address Tracker.
As for the Network Performance Monitor, its primary purpose is SNMP bandwidth monitoring but it can do a whole lot more either through built-in functionalities or by combining it with other SolarWinds tools. At its core, the product offers comprehensive fault monitoring and performance management. The tool primarily uses SNMP for data collection and is thereby compatible with various equipment from most vendors. Its NetPath feature lets you view the critical network path between any two monitored points on your network and the tool can also auto-generate intelligent network maps.

Advanced alerting is another of the products strong suits and so is its PerfStack performance analysis dashboard. Another exclusive feature of the product is the Network Insights functionality which allows for complex device monitoring. Talking about more complex use cases, the tool can monitor Software Defined Networks (SDN) and has built-in Cisco ACI support as well the ability to monitor wireless networks and to generate network performance baselines.
The SolarWinds Network Performance Monitor can be used on any network from the smallest to the largest, thanks to its smart scalability. Optional features include scalability engines, high availability and an enterprise operations console which lets you consolidate the data from multiple NPM instances into one enterprise-grade dashboard.

The pricing structure of the SolarWinds Network Performance Monitor is rather simple. Licensing is based on the number of monitored elements. Five licensing tiers are available for 100, 250, 500, 2000, and unlimited elements at prices ranging from $2 955 to $32 525, including the first year of maintenance. If you’d rather give the tool a test run before committing to a purchase, a free, element-unlimited 30-day trial version can be obtained.
Pros & Cons
We’ve searched the web for comments about the product trying to identify the most important pros and cons mentioned by users of the product. Here’s what we could gather.
Pros
- The web interface is completely customizable allowing different members of your IT team to use a view that suits them. For instance, system administrators can use a view that focuses on VMware hosts while the network administrator’s view focuses on network switches and traffic.
- NPM has excellent and easily configurable alerts. You could even create an alert to notify you when a device that is supposed to remain disconnected from the network connects. The possibilities are endless.
- You can create device pollers combined with custom metering Which can virtually return any information you need.
Cons
- Email configuration, while highly flexible and customizable, could be easier.
- The NetFlow Traffic Analyzer (a qualitative network analysis module) is not built into the product and must be purchased separately, increasing the product’s price.
- Some users have complained about the lack of filtering and searching options on syslogs and alerts.
2. Paessler PRTG Network Monitor
Nuremberg, Germany-based Paessler AG might not be as famous as SolarWinds but it still has a solid reputation for making one of the very best network monitoring tools. It is just over 20 years old and, contrary to most of its competitors, it only makes one product, the PRTG Network Monitor. Why the PRTG name, you may ask? Well, it used to be an acronym of Paessler Router Traffic Grapher and it was a play on words of the MRTG (Multi-Router Traffic Grapher) name, probably as a tribute to the product which is the granddad of all network monitoring tools. The name was later changed to its current form to better emphasize the fact that this product will do much more than monitoring router traffic.
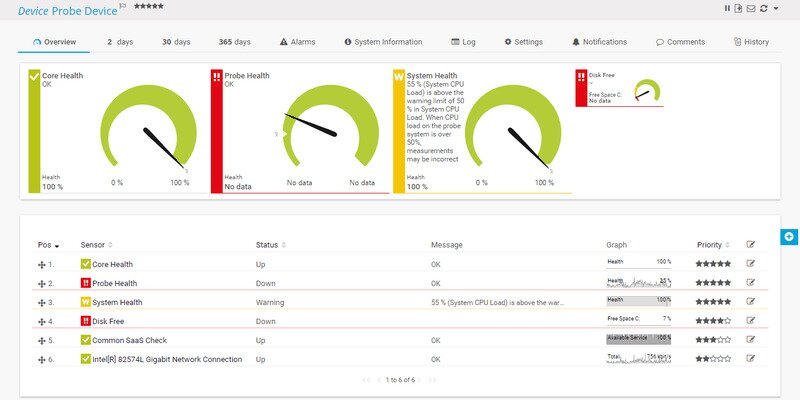
The PRTG Network Monitor is an all-in-one monitoring tool which you can use for bandwidth monitoring, cloud monitoring, database monitoring, network mapping, port monitoring, and server monitoring, among others. The product offers a choice of user interfaces between an Ajax-based web interface, an enterprise-grade Windows console and apps for Android and iOS. Its highly customizable dashboard can include a map view of your network. The tool has a very complete alerting system. In fact, ten different alerting methods are available including the usual email and SMS but also push notifications to the mobile apps. PRTG’s reporting capabilities are at par with the rest of the product’s features and a choice of schedulable pre-built or custom reports is available.
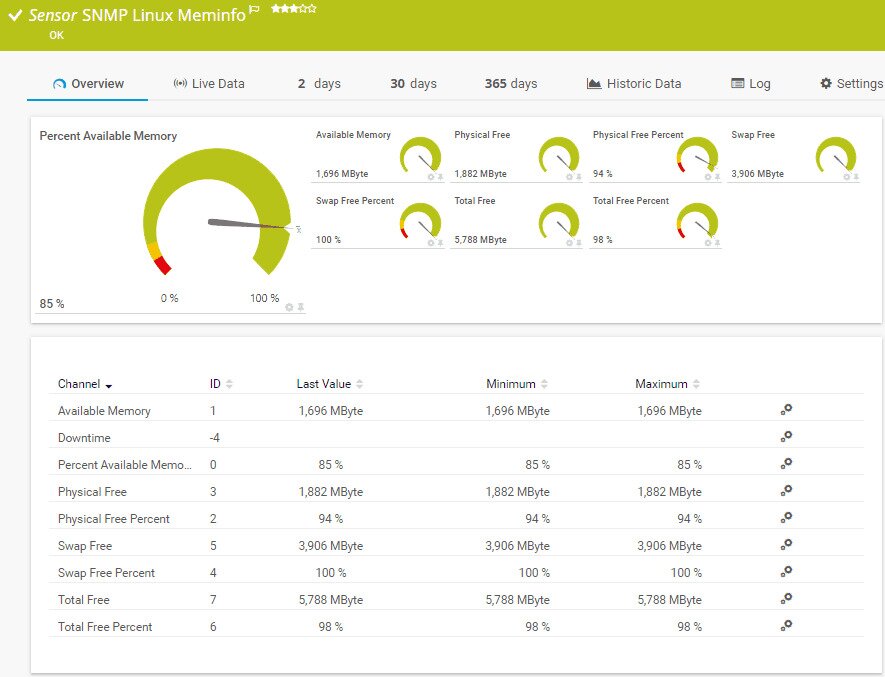
Where this product most shines, though, is in its use of various sensors. You can think of sensors as add-ons that offer some specific monitoring but, contrary to typical add-ons, sensors are already built into the product. There are many of them such as a Linux sensor to monitor Linux hosts or a DNS sensor which can monitor DNS servers. There’s even a NetFlow sensor which you can use for qualitative traffic analysis.
The pricing structure of the PRTG Network Monitor is not overly complex. First, you must choose between a local installation of PRTG on your server or a cloud-based service. Both are available and offer essentially the same capabilities. Prices for both the locally installed and the hosted versions are based on the number of sensors you need. Each monitored parameter typically counts as one sensor. For example, monitoring each port of a 24-port switch requires 24 sensors and each instance of a Linux sensor requires one too.
For the cloud-based service, four tiers are available for up to 500, 1000, 2500, and 5000 sensors at prices varying between $149 to $899 per month. You can also monitor up to 500 sensors free for ten days. The local installation has the same four tiers plus two unlimited sensor options at prices ranging from $1 600 to $60 000
Pros & Cons
Just like we did with the SolarWinds NPM, we’ve compiled user comments about PRTG and here are the pros and cons they reported
Pros
- The graphical interface is great and it is helpful in determining bandwidth issues.
- Setup and initial configuration are particularly easy and fast. Paessler claims you could be up and running within a couple of minutes but, in reality, it is closer to 10 minutes which is still really fast.
- The number of available built-in sensors is excellent
Cons
- There could be more sensors available, in particular from software companies to help with software monitoring.
- Some functionality in Enterprise Console redirects you to the web console.
- Some users have complained of the tool’s steep learning curve but it is to be expected of such a broad product.
Features Comparison
Comparing the SolarWinds Network Performance Monitor and the PRTG Network monitor can be a difficult endeavour. Both products are relatively similar both in quality and functionality. There are, however, several important differences that we’re going to try to highlight. In addition to a local installation, PRTG also offers a cloud-based SaaS model where you don’t need to install anything on your local network. This can give you a faster setup, better availability and software which is always kept up-to-date.
Another important difference has to do with the tool’s user interface. NPM has a web-based user interface whereas PRTG has also mobile apps and an enterprise console. However, some functionalities of the console will redirect you to the web-based interface, making the console’s usefulness questionable. We felt it added more confusion than value. Mobile access can be added to NPM but it requires the purchase of another product, the SolarWinds Mobile Admin, a costly option.
NPM has a very complete WiFi management feature. It will let you view performance metrics for autonomous access points, wireless controllers, and clients. It can also easily identify dead zones and improve wireless coverage. The NPM wireless network monitoring tool has built-in wireless reports including wireless availability and rogue access points.
If your network includes Cisco Nexus and ASA or F5 Big-IP devices, the Network Insights feature built into the Network Performance Monitor will give you a customized visual representation of their health and performance. Network Maps are also an exclusive feature of the SolarWinds Network Performance Monitor. The maps, which are both automatically generated and updated will give you a real-time representation of your devices and their interconnections. The mapping feature is quite powerful and it will let you plot your devices on top of a map of your choice, giving you a visualization of your device’s location.
Our Honest Opinion
As much as we’d love to tell you that one of NPM and PRTG is better than the other, we wouldn’t be helping you. The main factor to consider when choosing a monitoring solution is you and your needs. The best product for you it the one which has the features you need. For instance, if you have wireless monitoring and management needs, NPM would likely be a better choice. On the other hand, if what you need most is a cloud-based solution, then PRTG is the only one offering it.
Price is also an important factor but it can be misleading. For example, PRTG’s licensing is based on sensors which could end up being rather expensive. As a comparison, monitoring a 48-port LAN switch would use up one NPM elements but 48 PRTG sensors. If you want to compare the prices of both solutions, your best bet is to get a detailed quote adapted to your specific situation for both vendors.
Personally, I tend to prefer the SolarWinds Network Performance Monitor but it is, more than anything, due to the fact that it is a product that I know better. I’ve used it for years and I know exactly what it can do and how to do it. The best suggestion I could give you is to try both before making a final decision. With both vendors offering a free trial, all it’s going to cost you is some of your time.