

5 Best Spiceworks Alternatives for Even Better Monitoring
Spiceworks is many things. First, it is an online community of millions of network administrators and thousands of vendors. But Spiceworks is also a software developer and publisher. The company mainly makes software for help desk management, inventory management, and network monitoring. It is Spiceworks’ network monitoring tool that caught our attention today. It’s a great piece of software with lots of excellent features. The Spiceworks Network Monitor is free but it is ad-supported software and that bothers some potential users. Users of Spiceworks have also complained about the lack of customizability of the package. For these reasons, we’re presenting five of the best Spiceworks alternatives.

Before we reveal our top five best Spiceworks alternatives, we’ll first give you some background about Spiceworks, what it is, where it’s coming from and what products and services it provides. Then, we’ll tell you how the Spiceworks Network Monitor–or pretty much any other network monitoring tool–works. We’ll finally spend some time discussing the tool’s shortcomings. After all, what’s missing in Spiceworks is probably what you’ll be looking for in alternative solutions. Next, we will reveal what our top 5 best Spiceworks alternatives are. For each tool, we provide a brief review of its main features.
YOU MIGHT ALSO LIKE: Best Packet Sniffers and Network Analyzers – Top 7 Reviewed in 2018
About Spiceworks
Spiceworks was founded in early 2006 in Austin, Texas. It is essentially a professional network for the information technology industry although it was originally started to build IT management software. Today, Spiceworks is an online community allowing users to collaborate with one another and also participate in a marketplace to purchase IT services and products. Spiceworks is estimated to be used by more than six million IT professionals and three thousand technology vendors.
As a software developer and publisher, Spiceworks has three main products. There’s a help desk management platform called Spiceworks Help Desk, an IT assets inventory management tool called Spiceworks Inventory and a network monitoring platform called Spiceworks Network Monitor. All these tools are not open-source but are available for free to anyone.
The Spiceworks Network Monitor
The Spiceworks Network Monitor is a typical network monitoring tool that primarily uses SNMP to poll monitored devices for their operational parameters on a regular basis. It provides an overview of the monitored devices on a dashboard that can be drilled down to view details about individual systems. It can also watch the evolution of some critical parameter and trigger alerts when they exceed some predefined value. Alert notifications are sent by email to the administrators. The Spiceworks network monitor will monitor both servers and networking equipment. An important feature of Spiceworks’ products is that, although they are available for free, they are ad-supported and display advertisings on each of their web-based interface screens.
How Does It–Or Any Other Network Monitoring Too–Work?
When it comes to monitoring networks, there are several ways you can go about it. It depends on the level of detail you want. In most situations, administrators are specifically interested in the operational parameters of networking equipment such as CPU load or memory usage and the bandwidth utilization–in bits per second–of the various interfaces.
Network Monitoring tools such as the Spiceworks Network Monitor use SNMP, a feature that is built into most network equipment. SNMP-enabled devices have counters and gauges that can be remotely read by monitoring systems. In particular, there are gauges for processor and memory utilization and bytes in and out counters for each interface.
Without drowning in technical details, let’s try to explain how it works. For counters gauge-type parameters like CPU and memory utilization, it’s a simple matter of reading them using SNMP. But for counter-type parameters, things are a tad more complicated. You see, network devices typically don’t have bandwidth utilization gauges for their interfaces. What they have are byte in and bytes ou counters that keep incrementing. They have one such pair of counters for each interface. On a side note, they also have similar errors in and errors out counters that some monitoring tools can use to give you an interface’s error rate, often a good indicator of an interface’s general health.
The SNMP network monitoring tool polls each device it monitors at 5-minute intervals and reads the bytes in and bytes out counters of each interface. The rest is just a mathematical exercise. The tool subtracts the previous values of the two counter from the current ones. The results are the number of bytes in and out in five minutes. It then multiplies these numbers by 8 (the number of bits in a byte) and divides them by 300 (the number of seconds in five minutes) to get the average bandwidth usage in bits per second over the past five minutes.
Most monitoring tools don’t just do the SNMP reading and the maths, though. Usually, they’ll store the results in some sort of database or file and create graphs or tables showing the data evolution over time which they display on some kind of dashboard.
RELATED ARTICLE: Best SNMP Network Monitoring Tools We Put to Test in 2018
Some Drawbacks Of Spiceworks Network Monitor
As good as it is–and it is actually quite good–the Spiceworks Network Monitor has been severely criticized. The main peeve users have with it is the ads that are displayed on every screen of the user interface. This is something some of us would get used to, though, and it might not be enough to prevent anyone from using such a great free tool.
But there are also some functionality issues. It is particularly present in the tool’s alerting system. Although some competing tools are heavily customizable when it comes to alerting, this is not the case with the Spiceworks Network Monitor. First, there’s no way you can send different alert notifications to different users. Everyone receives every alert. In larger organizations where different groups manage different equipment, this can be a major annoyance. Also, the tool won’t use your email infrastructure to send the alerts. Instead, notifications are handled by spiceworks.com. And this brings us to another shortcoming of the tool, it requires users to authenticate with spiceworks.com instead of using some form of local authentication. This can be viewed as a security issue by some organizations.
The Best Spiceworks Alternatives
A quick Internet search will reveal dozens of network monitoring tools. Some are commercial, some open-source. We’ve tried to include the best five Spiceworks alternatives we could find. Our list features a combination of paid and free tools. For the paid ones, a free trial is available so you’ll be able to try any of them. Keep in mind that many of these tools require some efforts to set them up correctly so you might want to avoid trying too many.
1. SolarWinds Network Performance Monitor
SolarWinds is famous for its excellent network administration tools and for its numerous free tools. Its flagship product is called Network Performance Monitor, or NPM, a complete network monitoring solution. The tool features a user-friendly GUI interface that administrators can use to monitor devices and to configure the tool.
To add a device to the Network Performance Monitor, you specify its IP address or hostname and SNMP connection parameters. The system queries the device and lists all the available SNMP parameters. All you have to do is pick those you want to include on your graphs and reports. And talking about adding devices, this tool’s scalability is one of its best features. It suits the smallest of networks and scales up to large networks with thousands of devices spread over many sites.

Since alerting is a big shortcoming of the Spiceworks tool, let’s see what NPM has to offer. Its alerting system is actually second to none. It is highly customizable if you’re so inclined but it can also be used out-of-the-box with minimal configurations. The alerting engine is smart enough not to send notifications for “unimportant” events in the middle of the night or to send hundreds of notifications for as many unresponsive servers when the main issue is a down router or network switch.
SolarWinds Network Performace Monitor starts at just under $3 000 and goes up according to the number of devices to monitor and the selected optional components. The pricing structure is quite complex so you’ll need to contact the SolarWinds sales team for a detailed quote. If you prefer to try the product before committing to purchasing it, a free 30-day trial version is available for download from the SolarWinds website.
2. PRTG
The Paessler Router Traffic Grapher–which is usually simply called PRTG is another great monitoring system. Its publisher claims that PRTG can monitor all systems, devices, traffic, and applications of your IT infrastructure. It is an all-inclusive package that does not rely on external modules or add-ons that need to be downloaded and installed. Because if its integrated nature, PRTG is quicker and easier to install than most other network monitoring tools. PRTG lets you select between a few different user interfaces. There’s a Windows enterprise console, an Ajax-based web interface, and mobile apps for Android and iOS.
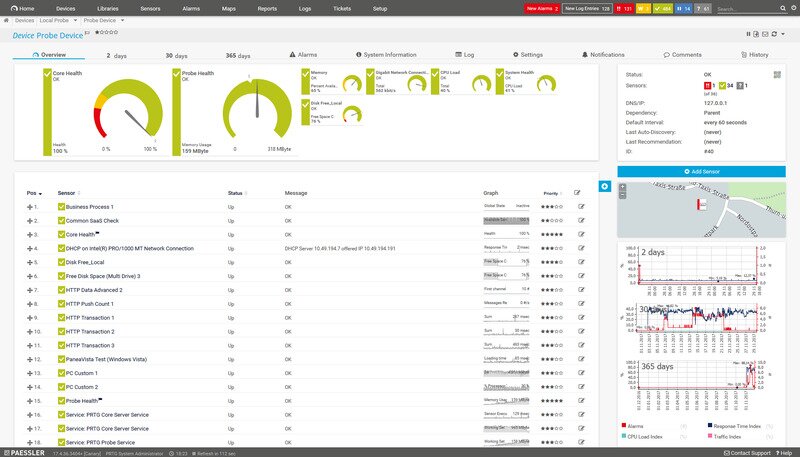
One of PRTG’s best feature is its autodiscovery system. It will scan network segments and automatically recognize a wide range of devices and systems, creating sensors from predefined device templates. We also loved PRTG’s map feature where you can create custom maps with your monitoring data. As for alerting, it is highly flexible and customizable. When using the free client apps for Android, iOS, and Windows Phone, you can even get push notifications directly to your device. You can also set up notifications via email or SMS according to your needs. A powerful API will even let you write your own notification scripts.
The PRTG pricing structure is pretty simple. There’s a free version which is full-featured but will limit your monitoring ability to 100 sensors. There’s also a 30-day trial version which is unlimited but will revert back to the free version once the trial period is over. If you want to keep monitoring more than 100 sensors beyond the trial period, you’ll need to purchase a license. Their price varies according to the number of sensors from $1 600 for 500 sensors to $14 500 for unlimited sensors. Each monitored parameter counts as one sensor. For example, monitoring bandwidth on each port of a 48-port switch will count as 48 sensors.
3. WhatsUp Gold
WhatsUp Gold from Ipswitch is another well-known name in the field of monitoring tools. It used to be an up-or-down type of monitoring but it has since evolved into a full management toolkit with proactive monitoring for network traffic, applications, virtual environments, and device configurations. Today, WhatsUp Gold has everything we’ve come to expect from an enterprise-grade monitoring tool, all available through an intuitive GUI.
WhatsUp Gold features an auto-discovery engine that will find your devices and add them to the monitoring console. It will not only find your networking equipment but also physical servers, virtual servers, cloud servers, and applications. There’s also a map view that’s clickable for more information on each device.
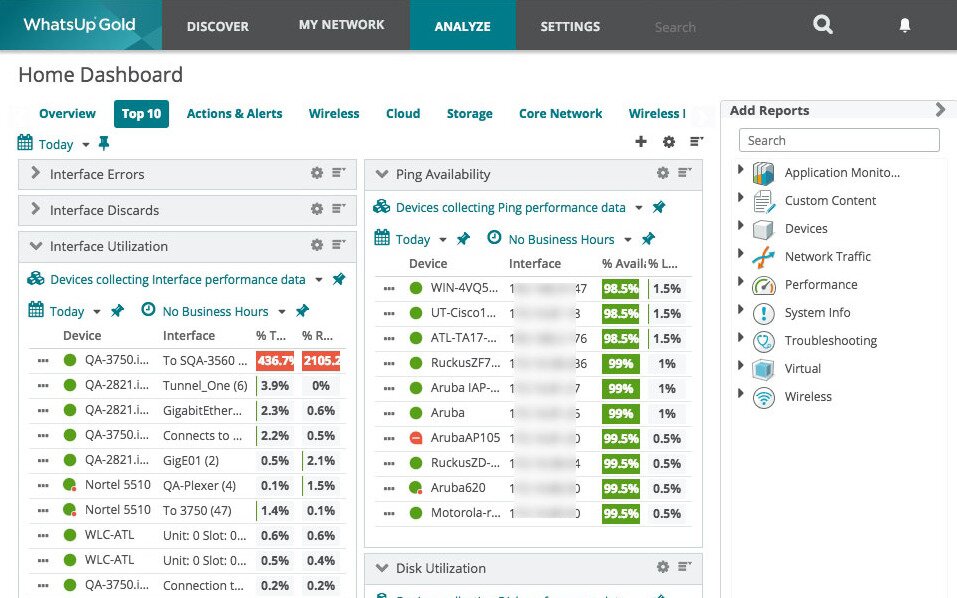
WhatsUp Gold also has an excellent alerting system to let you know about problems before users call. Through the tool’s Alert Center, you can opt to use out-of-the-box thresholds or adjust them to your specific needs. The system allows you to create action policies to define what happens when a state change occurs. Alerts can be transmitted by email, SMS, Slack, or IFTTT posts. The system can also restart services and trigger web alarms.
A free edition of WhatsUp Gold is available–as it always was–although it is now limited to monitoring a maximum of five devices. For more devices than that, paid licenses are available in three levels of increasing functionality with a pricing structure based on the number of devices to be monitored. There’s also a free, full-featured trial version that you can use for a limited time.
4. ManageEngine OpManager
ManageEngine is another of the best publishers of network management tools. The OpManager is a complete management solution that will handle pretty much any monitoring task you can throw at it. The tool runs on either Windows or Linux and is loaded with great features. Among others, there is an auto-discovery feature that can map your network, giving you a uniquely customized dashboard.
The ManageEngine OpManager dashboard is super easy to use and navigate, thanks to its drill-down functionality. And if you are into mobile apps, there are apps for tablets and smartphones allowing you to access the tool from anywhere. This is an overall very polished and professional product.
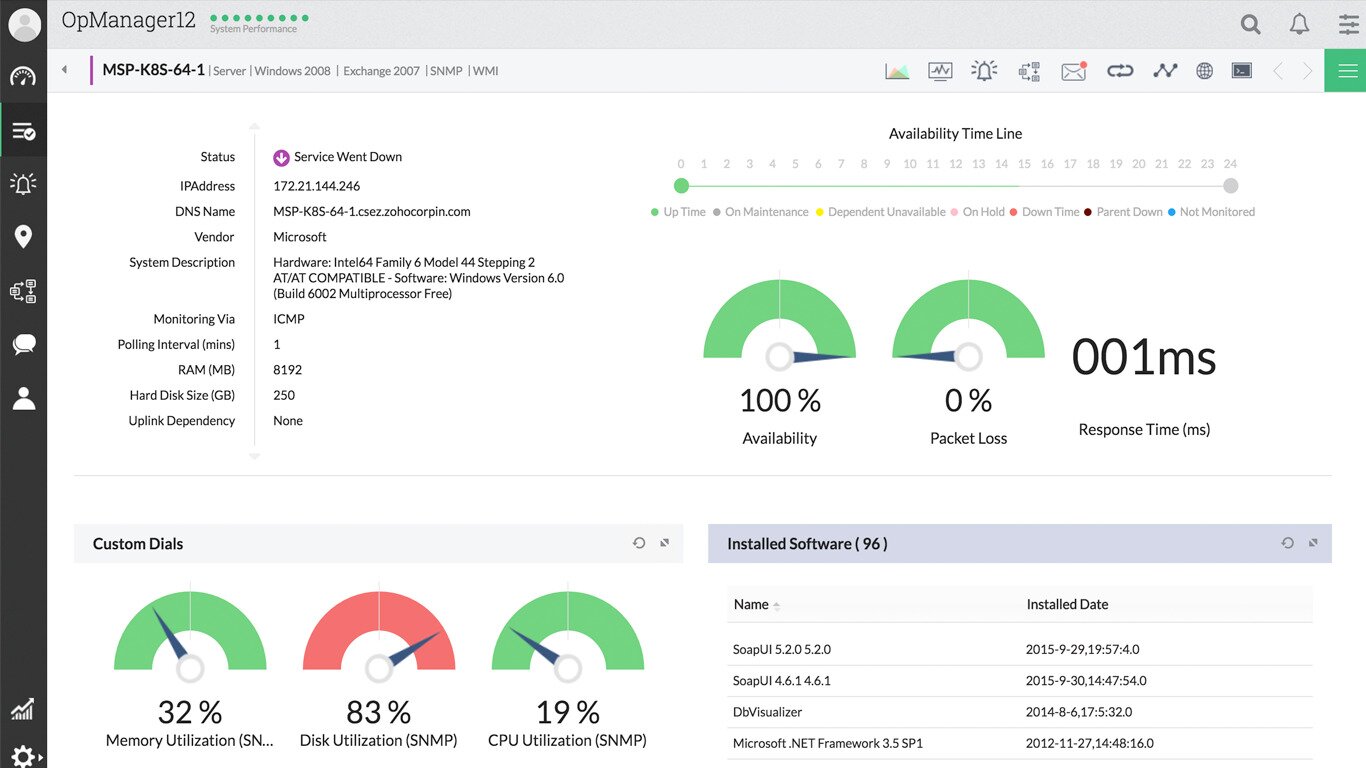
When it comes to alerting, this is just as good in OpManager as are all its other components. It has a full complement of threshold-based alerts that will help detect, identify, and troubleshoot network issues. Multiple thresholds with various notifications can be set for every performance metric.
If you want to try the product before buying, a free version is available. Although it is a truly free version rather than a time-limited trial, it has some limitations such as letting you monitor no more than ten devices. This is insufficient for all but the smallest of networks. For larger networks, you can choose between the Essential or the Enterprise plans. The first will let you monitor up to 1,000 nodes while the other goes up to 10,000. Pricing information is available by contacting ManageEngine’s sales.
5. Cacti
We’ve decided to include Cacti on our list for a few reasons. First, it is possibly the most used free and open-source monitoring system. It might not be as feature-rich as some commercial products but, given its price, it a great tool. Another reason for its inclusion is historic. Aside from MRTG–which is the mother of all network monitoring tools, Cacti is possibly the oldest still around.
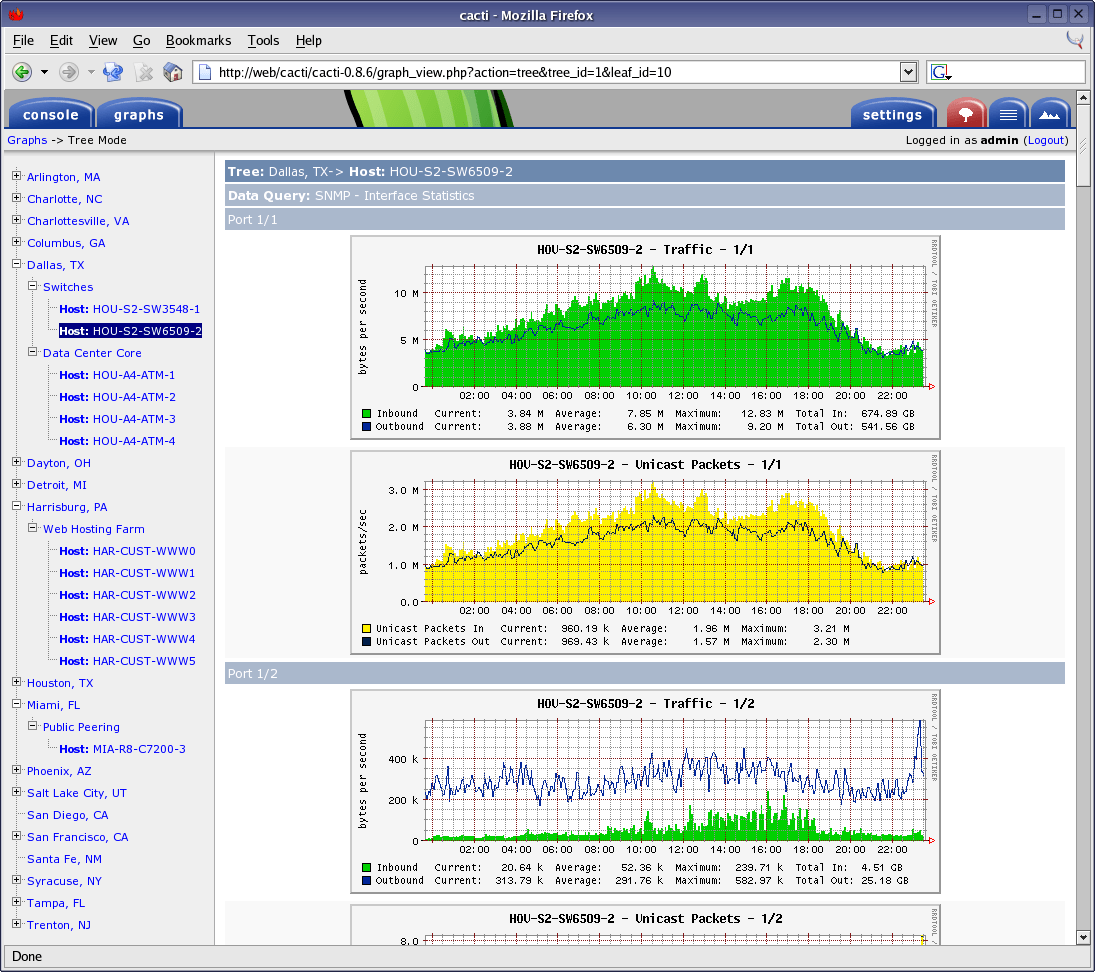
Cacti was first released back in 2004 as a web front-end to RRD tool, the logging and graphing component of MRTG. Its main components are a fast poller, advanced graph templating, and multiple data acquisition methods. Cacti also feature user access control and each user can be configured to view a different set of graphs, a useful feature for large deployments with multiple support teams. Cacti also boasts an easy to use web-based interface. It can scale from a small business or home LAN to complex networks with thousands of devices on multiple sites.
Cacti uses RRDTool to store data in a SQL database and to create the graphs. It is primarily written in PHP, making it easy to modify to suit your needs. The tool has built-in templates for several types of devices that already includes most of the elements you might want to monitor on those. And Cacti is so popular that many device-specific templates can be downloaded either from device manufacturers’ websites or from community-driven Cacti forums. The only thing missing from Cati is an alerting feature. But with its open-source PHP code, nothing stops anyone from adding it, though.
In Conclusion
While the Spiceworks Network Monitor is an excellent tool, a few drawbacks can stop some from liking it or even from trying it. Fortunately, the market is more than saturated with similar network monitoring tools. We’ve introduced the five best we could find. The selection is based on our criteria and opinion. You might have a favorite tool that we failed to mention. This list could have been 20 or 25 items long and it would still be incomplete. But in our humble opinion, these 5 are the best Spiceworks alternatives you can find.