

Best Switch Port Monitoring Software To “See” The Actual Traffic
Network switches often come with LEDs on their from panels that provide some degree of information about their status and the status of their interfaces, or ports. Unfortunately, those lights are rarely of any help. First, with switches commonly having a few dozen interfaces, there’s not much room left for the LEDs and they are often hidden behind all the cables that are connected. But even more importantly, network equipment is usually installed in some remote location, such as a wiring cabinet or building riser. Keeping a watchful eye on your switch ports requires that you use some tool. This is where switch port monitoring software can assist and this is why we’re bringing you our list of the top 6 switch port monitoring software.

We’ll start our journey by discussing the ins and outs of switch port monitoring. We’ll see what it is and how it works. We want to give you as much useful background information as possible in an easy to understand way without drowning in technical details. And talking about technical details, we’ll also discuss how SNMP works in the context of monitoring switch ports. After all, SNMP is a central part of any monitoring system. Then we’ll be ready to reveal our top 6 switch port monitoring software with a short review of each.
The ABCs Of Switch Port Monitoring
There are several things one might want to monitor on network switches. In fact, monitoring switches goes beyond just ports. In its most basic form, what you might want to monitor is the switches’ state. You want to know if your switches are up or down. And when one goes down, you want to be notified right away, preferably before users start calling.
Something else you might want to monitor is the operational parameters of your switches. You need to make sure that they don’t run out of memory, that their processor is not overloaded or that they’re not overheating. These types of parameters can easily be remotely fetched by monitoring tools and alerts can often be set to notify you if they exceed their “normal” range.
The next level of monitoring is the actual monitoring of the switches’ ports. You want to know which ones are up and which ones are down. But more importantly, most switch port monitoring tools will allow you to measure the traffic in and out of each port and often the interface errors as well. They typically display that information as graphs showing their evolution over time.
Do Not Confuse Switch Ports and Network Ports
Before we go any further, we’d like to clarify something. There an important difference between a switch port and a network port. The first refers to a physical interface on a network switch. This is what this article is all about. A network port refers to something completely different. Port numbers are a way for network-connected devices to organize network traffic. There could be many processes, programs, and services running at any given time on a computer. When computers send out data packet on the network, they mark them with a source port number that will let them know what process the response should go to. Destinations ports are also used for much the same reason. Several port numbers have been standardized and are universally used. We can think of port 80 for HTTP traffic or 21 for FTP and 53 for DNS. While there are tools to scan network ports, this is not what this article is about.
A Brief Introduction To SNMP
SNMP is an acronym for Simple Network Management Protocol. That should tell you quite a bit about what it is. Although it is called simple, it actually isn’t THAT simple. But you don’t have to be a master of every aspect of SNMP to use it to your benefit, just like you don’t have to be a seasoned mechanic to use a car. So, we’ll keep our explanation as non-technical as possible and keep it to what’s needed to understand how SNMP monitoring works.
SNMP is built right into the operating system of many networking devices. SNMP-enabled devices make a certain number of parameters available to monitoring tools. Parameters can mainly be of two types, gauges or counters. For instance, a typical network switch will have gauge-type SNMP parameters for CPU load, percentage of used memory, or core temperature. They also have counter-type parameters that count the bytes in and out and the input and output errors of each interface.
Monitoring tools communicate with SNMP-enabled devices in a connectionless fashion by sending a “get” request with the Object Identifier–or OID–of the parameter they want to read. For security reasons, the request must also include a “community string” which can be thought of as a crude password mechanism. The community string in the request must match what’s configured in the network device.
A typical port monitoring tool reads the relevant parameters from each device at regular, predefined intervals–typically every five minutes. For gauge-type values, it simply stores them in its database and displays them on its dashboard. For counter-type parameters, things are a tad more elaborate. No one is interested in knowing the number of bytes in and out of an interface. What we want is the bandwidth usage, in bits per second.
Here’s how the monitoring tool does it. It reads the counter a the same predefined interval as gauges but instead of storing its value, it does some maths with it. It will first subtract the current value of the counter from the previous one, giving the number of bytes in five minutes. Then, it multiplies that value by 8 to get the number of bits in five minutes and divides the result by 300–the number of seconds in five minutes–to get the average bandwidth usage in bits per second over the last five minutes. A similar calculation is performed with the error counters, giving the error rate in interface errors per second.
Our Top 6 Switch Port Monitoring Tools
Our Top 6 list has software from some of the best-known names in the network administration world. Our top pick, as you’ll see is rather unique whereas the remaining five are more “classical” tools in the way they operate. For each tool, we’re offering you a brief review presenting its primary features.
1. SolarWinds User Device Tracker
If you’re used to more traditional monitoring tools, the SolarWinds User Device Tracker might catch you off-guard. It’s very different from most other monitoring systems. This tool is centered on tracking rather that measuring usage. This is a subtle yet important difference. This product has the ability to quickly locate network devices and to map and monitor wireless access points, switches, and ports. It is an excellent tool if you need to manage switch and switch port capacity. It can also be used to detect rogue devices and users and remotely disable ports if needed.
![]()
With its unified IT administration dashboard, the SolarWinds User Device Tracker will allow you to monitor wireless access points for errors, performance, and capacity usage. It might not be a match for a dedicated Wi-Fi analyzer but it sure is better than nothing. In fact, it will be enough for most users.
Talking about users, this tool will not only track devices but also users. It will, for example, let you who is logged on the computer connected to a specific switch port. This is actually where the SolarWinds User Device Tracker differs vastly from other products. While traditional tools are primarily traffic monitors that will tell you how much traffic–and sometimes what traffic–goes through a network interface, this one will instead tell you what and who is using the interface.
If you want a more traditional approach, this tool integrates seamlessly with the SolarWinds NetFlow Traffic Analyzer, a NetFlow Collector and Analyzer tool that can provide detailed information on the traffic on your network or with the Network Performance Monitor reviewed below.
The SolarWinds User Device Tracker is licensed according to the total number of network switch ports you need to monitor. Prices start $1 895 for 2500 ports. If you want to try the product before buying it, a free 30-day trial version can be downloaded. And if you just want to see it in action, an interactive demo is also available.
2. SolarWinds Network Performance Monitor
If you’re looking for a more traditional switch port monitoring tool, the SolarWinds Network Performance Monitor–or NPM, as it is often called–might be just the right tool for you. It is SolarWinds’ flagship product and also one of its most elaborate. NPM offers a complete network monitoring solution with a user-friendly graphical dashboard from where you monitor devices and configure the system.

Adding a device to the SolarWinds Network Performance Monitor could hardly be easier. It is a simple matter of indicating the device’s IP address or hostname and SNMP community string ant the tool does the rest. It will query the device for available parameters and let you pick those you want to include in your monitoring. There’s a limit to how many devices you can add but, if you reach it, you simply need to upgrade your license. NPM is easily scalable from the smallest of networks to last multi-site networks with hundreds of devices
Since you probably don’t want to sit in front of the tool’s dashboard, watching the network, The SolarWinds NPM also has alerts. The tool will notify you, for instance, whenever a monitored parameter exceeds a critical value. While the alerting system is highly customizable in terms of triggering events and notification methods, you can also opt to use it out of the box with barely any configuration. There’s also some intelligence built into the alerting system and it won’t for instance, send notification for minor events in the middle of the night or send dozens of host down notifications for unreachable devices when the actual issue is a down switch in front of them.
Pricing for the SolarWinds Network Performace Monitor starts at $2 955 and goes up according to the number of elements you want to monitor. You can contact the SolarWinds sales team for a detailed quote or use their online quoting tool. Like with most SolarWinds products, a free 30-day trial version is available for download from the SolarWinds website.
And while you’re on the SolarWinds website, why don’t you have a look at the numerous free tools they offer. Some of them were reviewed as part of our “Best SFTP and FTPS servers” and “Best free TFTP servers” articles.
3. ManageEngine OpManager
ManageEngine is known to make some of the best network management tools. The ManageEngine OpManager is a complete management system. This tool, which can run on either Windows or Linux, has tons of excellent features. First and foremost is its auto-discovery feature that will not only find devices but also map your network for a uniquely customized dashboard. Talking about the tool’s dashboard, it has drill-down functionality and is very easy to use. And if you’re a mobile device user, there are also client apps for tablets and smartphones running on iOS and Android, giving you access from anywhere.
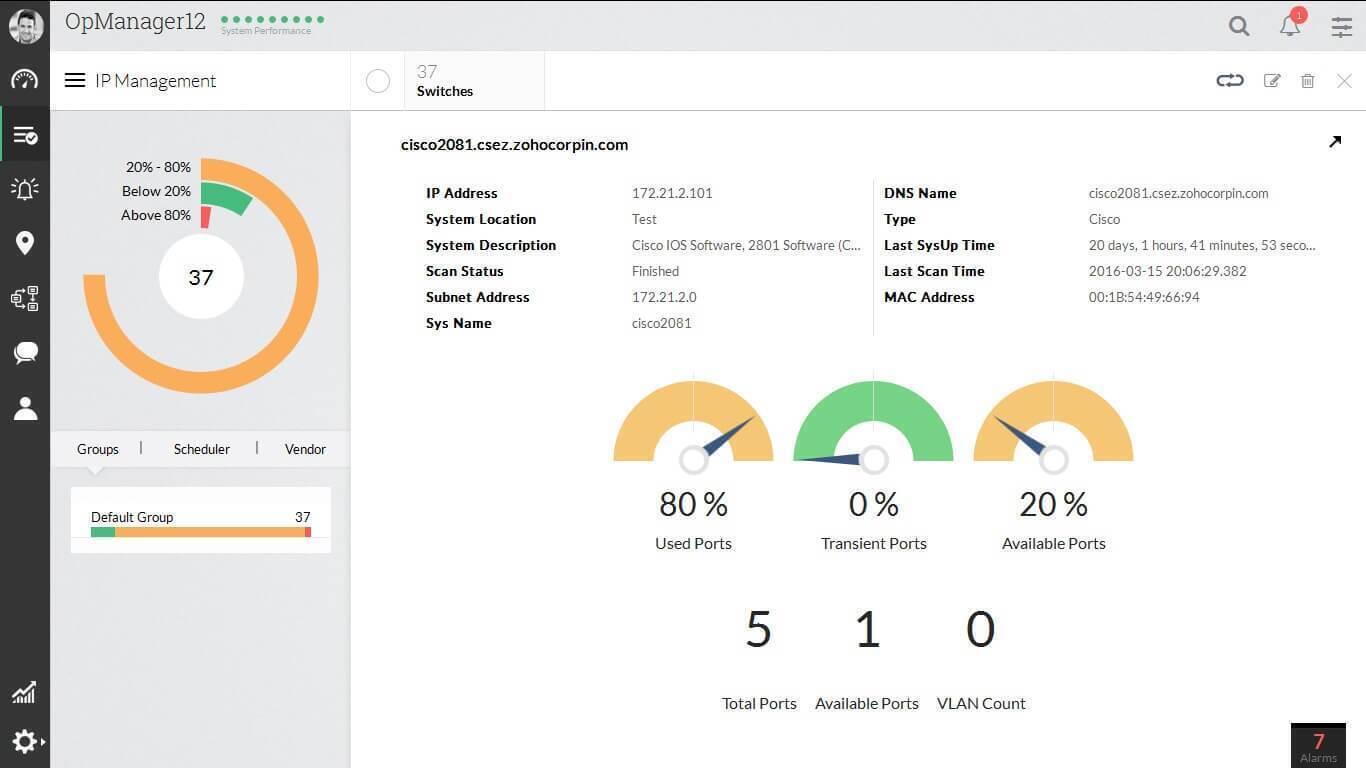
Alerting is another of OpManager’s strength. The tool boasts a vast array of threshold-based alerts that will help you detect, identify and troubleshoot network issues, often before users start calling. You can set multiple thresholds with various notifications for every metric.
The ManageEngine OpManager is available in two versions, the Essential plan or the Enterprise plan. The first allows you to you monitor up to 1,000 nodes and its price starts at $715 for 25 devices while the other can monitor up to 10,000 devices with prices starting at $19 795 for 500 devices. A free 30-day trial is available on both plans and so is an online demo. Furthermore, a customized demo can also be arranged with ManageEngine.
4. PRTG
The Paessler Router Traffic Grapher, or PRTG, is another great monitoring system. Its publisher claims that PRTG can monitor all systems, devices, traffic, and applications in your IT infrastructure. It is an all-inclusive package that does not rely on external modules or add-ons that need to be downloaded and installed. Because if its integrated nature, PRTG is quicker and easier to install than most other network monitoring tools. PRTG lets you select between a few different user interfaces. There’s a Windows enterprise console, an Ajax-based web interface, and mobile apps for Android and iOS.
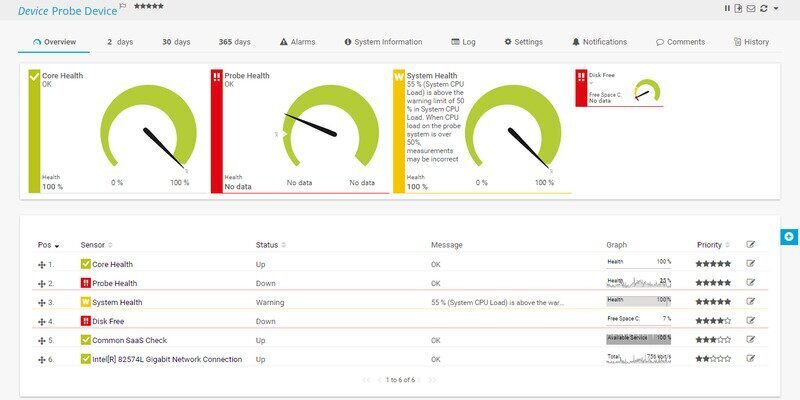
Like most products of this quality, PRTG has device auto-discovery. It scans your networks and automatically recognizes a wide range of devices and systems. And when it does, it automatically creates sensors for those devices based on predefined templates. PRTG also has a pretty useful map feature where you can create custom maps and display your monitoring data the way it makes sense to you. Alerting is another domain where PRTG leaves nothing to be desired. Alerts and notifications are flexible and customizable. And if you’re using one of the available free client apps for Android, iOS or Windows Phone, you can even get push notifications right on your mobile device. This is in addition to the more standard email and SMS notifications that are also available. And if you need more flexibility, a powerful API will let you create your own notification scripts.
PRTG is available in a free version which is full-featured but limited to monitoring 100 sensors. Each monitored parameter counts as one sensor. For example, if you want to monitor each port of a 48-port switch plus its CPU and memory loads, you’ll use up 50 sensors. If you need more than 100 sensors, you’ll have to go with one of the paid licenses. Prices vary according to the sensor capacity from $1 600 for 500 to $14 500 for unlimited sensors. A trial version–with unlimited sensors–can be downloaded and will revert to the free version after the 30-day trial period is over.
5. Zabbix
Zabbix is one of the best free and open-source monitoring platform. This enterprise-grade system has a massive 300 000 users worldwide. Zabbix will not only monitor switch ports but also servers–both local and cloud-based, and the services running on them. Zabbix can be used to monitor bandwidth, device CPU and memory utilization, general device health as well as configuration changes.
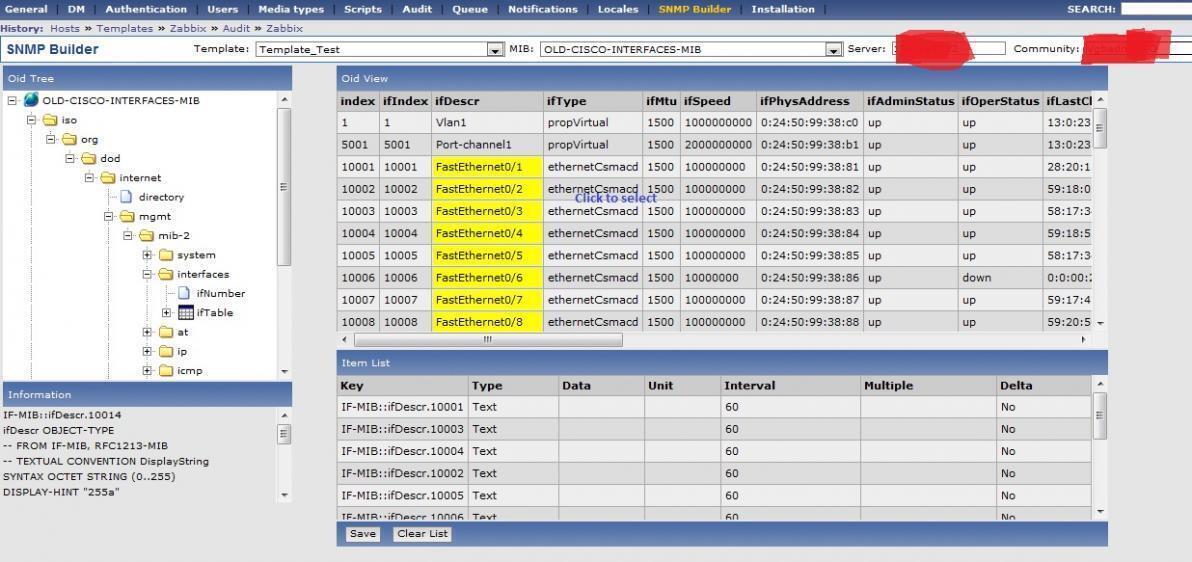
This tool boasts a very intuitive web-based interface and an impressive feature set. It has every feature you’d expect from products often costing thousands of dollar. Its alerting and notification subsystem is among the best. In addition to typical email notifications, the system can also run local scripts triggered by monitoring events.
Zabbix is free but ancillary services can be purchased from Zabbix. For instance, technical support can be purchased in five levels, depending on your need. A complete certification training program is also available. You don’t have to purchase any of these, though, as community support is also available.
6. Cacti
Cacti is probably the most used free and open-source monitoring system. It might not be as feature-rich as some commercial products–although this is debatable–but still, it a great tool, especially considering the price. Cacti’s main components are a fast poller, advanced graph templating, and multiple data acquisition methods. Cacti also has user accounts where each user can be configured to have access to a subset of devices. The product features an easy to use web-based interface. It can scale from a small business or home LAN to complex networks with thousands of devices on multiple sites.
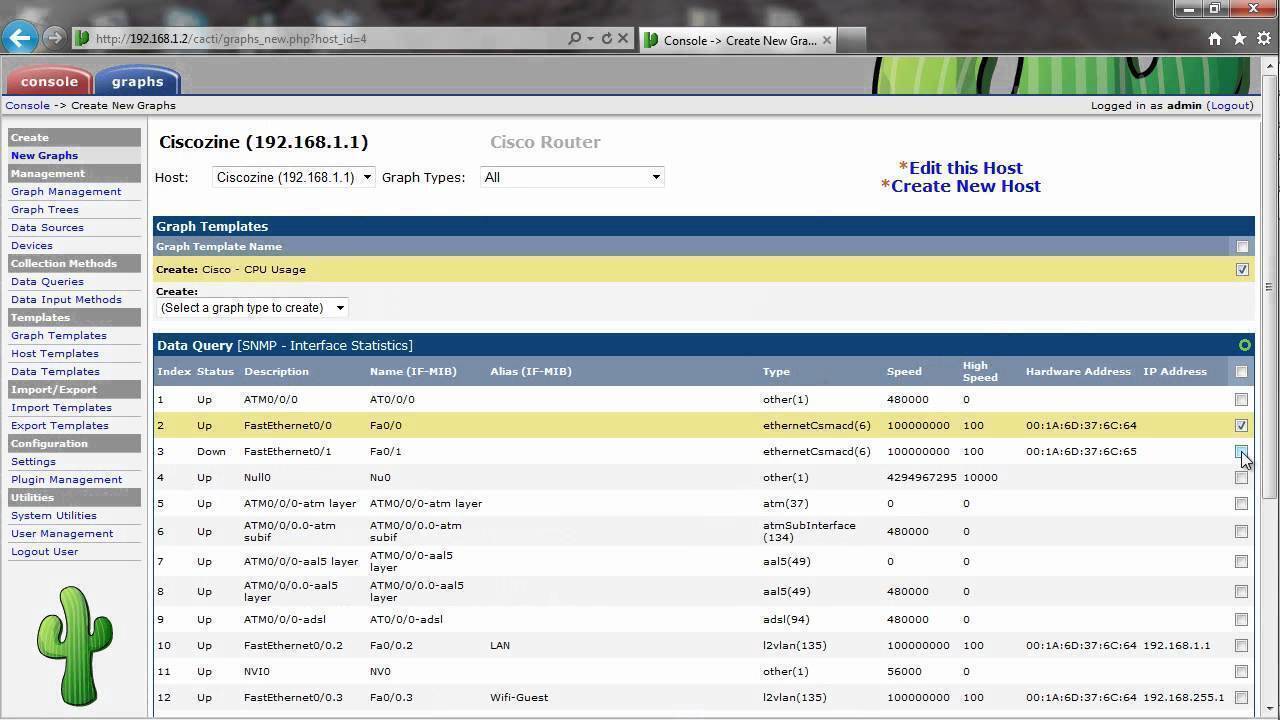
Cacti is based on RRDTool, an open source program that stores data in a Round-Robin Database–hence its name–and creates graphs from that data. Cacti is mostly written in PHP, making it easy to modify to suit your needs. There are built-in templates for several types of devices. Device-specific templates can often be downloaded from either the device manufacturers’ websites or community-driven Cacti forums. The only thing missing from Cati is an alerting feature.
In Conclusion
Monitoring your switches’ ports and their general health is easy when you have the proper tools in place. Selecting one is the first step. The six products we just reviewed are all excellent options. Your selection will largely be based on personal preferences and your specific needs as each tool have subtle differences that can make it better suited to your situation.