Chart Creator: Easily Create & Print Professional Charts And Graphs [Web]
Want to create professional looking charts and graphs without using a complicated tool? Chart Creator is a very simple web application that lets you draw charts and graphs. The app lets you customize the existing pie chart, or simply click the Editor button to create different ones. Enter the names and values, click draw and your chart will be created in seconds. You can create pie charts, column charts, line charts and a few others. Once you’re done plotting the graph or chart, just click the Print button to extract the chart, so you can easily print it out without the extra content.
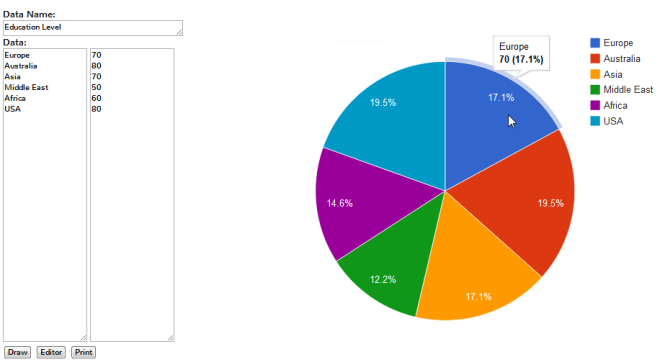
By default, Chart Creator displays a pie chart on its homepage. In order to create a pie chart, simply change the values and names in the columns, and click Draw. Mouse over each part or bar to view the percentage for that category.

To change the types of graphs, simply click the Editor button and start customizing your graph.

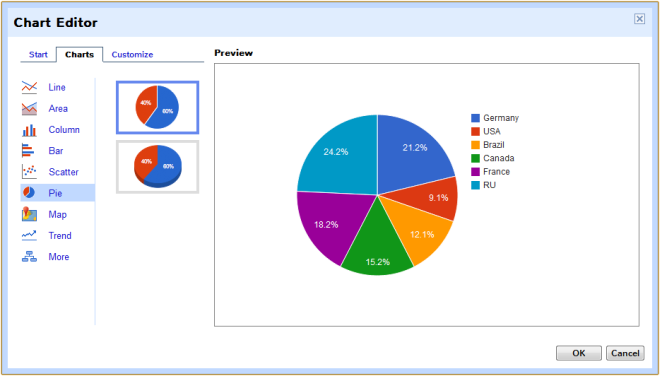
In order to create different types of graphs, click Editor. You will find three basic options in the editor, namely Start, Charts and Customize. The Start and Charts categories allow you to choose different types of graphs, ranging between Line, Area, Column, Bar, Scatter and more. Select a type and you’re good to go.

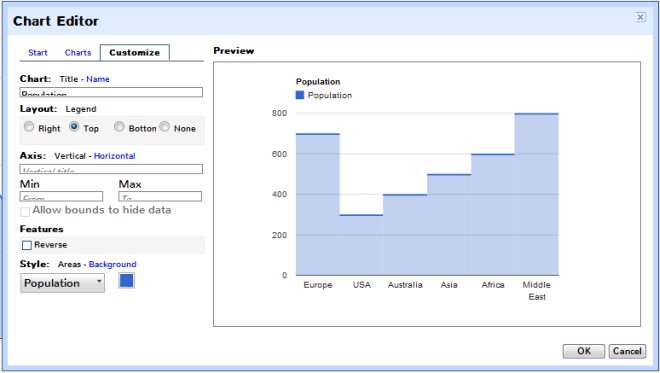
The Customize option allows you to modify your graph by adding a title, changing the layout, setting titles for axes, changing colors etc.

The web app supports multiple types of chart which is one of the best things about it since charts and graphs are chosen on the basis of the data type. The charts have also been sorted by which type of data they are most suitable for. There should also be an option to save the final output, i.e., the graph, as an image to be used in documents. As a web app, it definitely has potential since not everyone is good at using Excel and it isn’t necessarily available on every system you will ever use. Chart Creator’s interface is very minimalistic and it focuses solely on the graph but if you look at it, it seems almost barren. The developers of the service are right to focus on the graph but the interface can still be improved will staying true to that concept.
Chart Creator is an easy-to-use and flexible service. It conveniently allows you to create different types of graphs and charts with only a few clicks, and can especially come in handy for college students and teachers. Visit the link below and try it out for yourself.
