

Top 5 Apache Cassandra Monitoring Tools and Software
Although NoSQL databases are not as well-known as their relational counterparts, they are very popular with web applications. Apache Cassandra is likely one of the most popular of these databases. Just like any other type of database, these too, have to be monitored. And since it can be overwhelming to manually keep a constant watchful eye on things, monitoring tools are the way to go. Today, we’re going to have a look at five of the best tools you can use for monitoring Apache Cassandra databases.

We’ll begin by introducing Apache Cassandra, in case you’re not already familiar with the product. Next, we’ll discuss NoSQL databases and what makes them different from more conventional types. Then we’ll go into great lengths into the subject of database monitoring, with a focus on what there is to be monitored in databases. This will take us to the core of our discussion, the very best tools for monitoring Apache Cassandra databases.
About Apache Cassandra
Apache Cassandra is a free and open-source NoSQL database management system designed to handle large amounts of data across many commodity servers, providing high availability with no single point of failure. This distributed, wide column store database system offers robust support for clusters spanning multiple data centers with asynchronous masterless replication. This allows for low latency operations. It has been used by big organizations such as Apple, Spotify, Netflix, and Uber. It is widely used in part because of its fault-tolerant, scalable and decentralized characteristics.
Cassandra was initially developed at Facebook by Avinash Lakshman, one of the authors of Amazon’s Dynamo, and Prashant Malik to power the Facebook inbox search feature. Facebook released the product as an open-source project on Google code in July 2008. A few months later, in March 2009, the project became an Apache Incubator project and about a year later, on February 17, 2010 it graduated to a top-level project. The name is a direct reference to the Trojan mythological prophet Cassandra, with classical allusions to a curse on an oracle.
Being a NoSQL database, Cassandra uses Cassandra Query Language, a simple interface for accessing Cassandra. CQL, as it is usually referred to, provides an abstraction layer that hides implementation details of this structure and offers native syntax for collections and other common encodings. Language drivers are available for Java, Python, Node.JS, Go, and C++.
The best tools for monitoring Apache Cassandra
So, now that we are all on the same page as to what it entails to monitor Apache Cassandra databases, here’s our pick of some of the best tools you can use for that purpose. Many of the tools on our list are actually application monitoring tools. That should not come as a surprise as Apache Cassandra is, in fact, just another application running on a server. Other tools are rather dedicated database monitoring tools but that does not necessarily mean they are better tools. It all depends on what your exact needs are.
1. SolarWinds Server & Application Monitor (FREE TRIAL)
The SolarWinds Server and Application Monitor was designed to help administrators monitor servers, their operational parameters, their processes, and the applications which are running on them. It can easily scale from very small networks to large ones with hundreds of servers—both physical and virtual—spread over multiple sites. The tool can also monitor cloud-hosted services like those from Amazon Web Services and Microsoft Azure. This powerful tool also lets you monitor the performance and availability of Apache Cassandra servers on Linux or Unix. It will provide details on service health, node statistics, and network tracking, letting administrators view all relevant parameters on a unified dashboard.

The SolarWinds Server and Application Monitor is very easy to set up and its initial configuration is just as easily done with the help of its auto-discovery process. It is a two-pass process. The first pass will discover servers, and the second one will find applications. This can take time but can be sped up by supplying the tool with a list of specific applications to look for. Once the tool is up and running, the user-friendly GUI makes using it a breeze. You can choose to display information in either a table or a graphic format.
Prices for the SolarWinds Server and Application Monitor start at $2 995 and vary based on the number of components, nodes, and volumes monitored. A free 30-day trial version is available for download, should you want to try the product before purchasing it.
2. SolarWinds AppOptics (FREE TRIAL)
Next on our list is another great platform from SolarWinds. It is radically different from the previous entry, though. SolarWinds AppOptics is a cloud-based, Software as a Service (SaaS) offering for infrastructure or performance monitoring. This service is made up of two components.
- AppOptics Infrastructure is a traditional infrastructure monitoring service that will let you monitor the health of all of your critical systems with a highly scalable, cost-effective platform, giving you continuous visibility into hosts, containers, and your serverless environment.
- The other component is AppOptics Application Performance Monitoring and it offers full-stack monitoring of metrics, traces and logs.

Among other things, SolarWinds AppOptics offers distributed tracing, a functionality that allows it to measure and monitor the performance of application stacks in each component layer, including network, database, API, UI, etc. For example, to help troubleshoot Apache Cassandra database performance problems, developers can use a feature called “Traced Queries”. Using them, SolarWinds AppOptics can drill down on any database query and identify the application calls that are causing poor performance.
SolarWinds AppOptics provides a unified dashboard, alerting, and management for application performance and infrastructure monitoring. It virtually removes the division between application performance and infrastructure monitoring, letting you cross-reference application performance, server, and infrastructure metrics side by side in the same dashboard. It can help streamline your troubleshooting efforts and dramatically decrease time to resolution.
The cost of the SolarWinds AppOptics APM service is $2 999/year. This is an all-inclusive price that will let you monitor up to 10 hosts, 100 containers, 100 traces per minute, and 1 000 custom metrics. You can optionally add additional traces for high-traffic websites at the cost of $1 000/year for an additional 100 traces per minute or custom metrics at the cost of $599/year for a 1 000 metrics. If you’d rather try the service first, a free, no-credit-card-needed 14-day trial is available.
3. ManageEngine Applications Manager
ManageEngine may not be as well-known as SolarWinds yet it’s still another name that enjoys an excellent reputation among network and database administrators. The ManageEngine Application Manager deals with application management. You probably had figured it out by yourself. This is, however, a somewhat misleading name as it is as much a monitoring platform as it is a management tool.
This tool offers integrated application performance monitoring for all your server and application monitoring needs. It can also do that for the underlying infrastructure components such as application servers, databases, middle-ware and messaging components, web servers, web services, ERP packages, virtual systems and cloud resources. In a few words, this is an all-encompassing platform.
The ManageEngine Applications Manager provides comprehensive Cassandra performance monitoring and administration of all nodes in a cluster from a centralized console. It lets you collect statistical data from all JVMs in a cluster as well as key performance metrics like memory utilization metrics, task metrics of thread pools, storage metrics, CPU usage, operation performance, latency and pending tasks. The tool can also track operating system metrics on your Cassandra nodes like the number of processors, exceptions, CPU utilization and time trends.
This tool also monitors distinct Cassandra thread pools to provide statistics on the number of tasks that are active, pending, completed and blocked. Monitoring trends on these pools for increases in the pending tasks column can help you plan add additional capacity. It can also can help you deal with overload scenarios in your Cassandra environment by keeping a lookout for dropped messages. You can receive a log summary of dropped messages along with the message type as well as establish thresholds and configure alarms to notify you of dropped messages.
The ManageEngine Application Manager is available in several editions. There’s a feature-limited Free edition as well as a Professional and an Enterprise paid versions. Pricing starts at $945 and details can be obtained by contacting ManageEngine. A free 30-day trial version is also available.
4. Dynatrace
Dynatrace is another cloud-based Software as a Service (SaaS) offering. It can detect, solve and optimize applications automatically. Discovering and mapping a complex application ecosystem is simply a matter of installing the Dynatrace OneAgent. The service will give you a high-fidelity view of your entire application stack, from the performance of applications, cloud infrastructure, and user experience. It will help you effortlessly detect problems along with their business impacts and root cause.
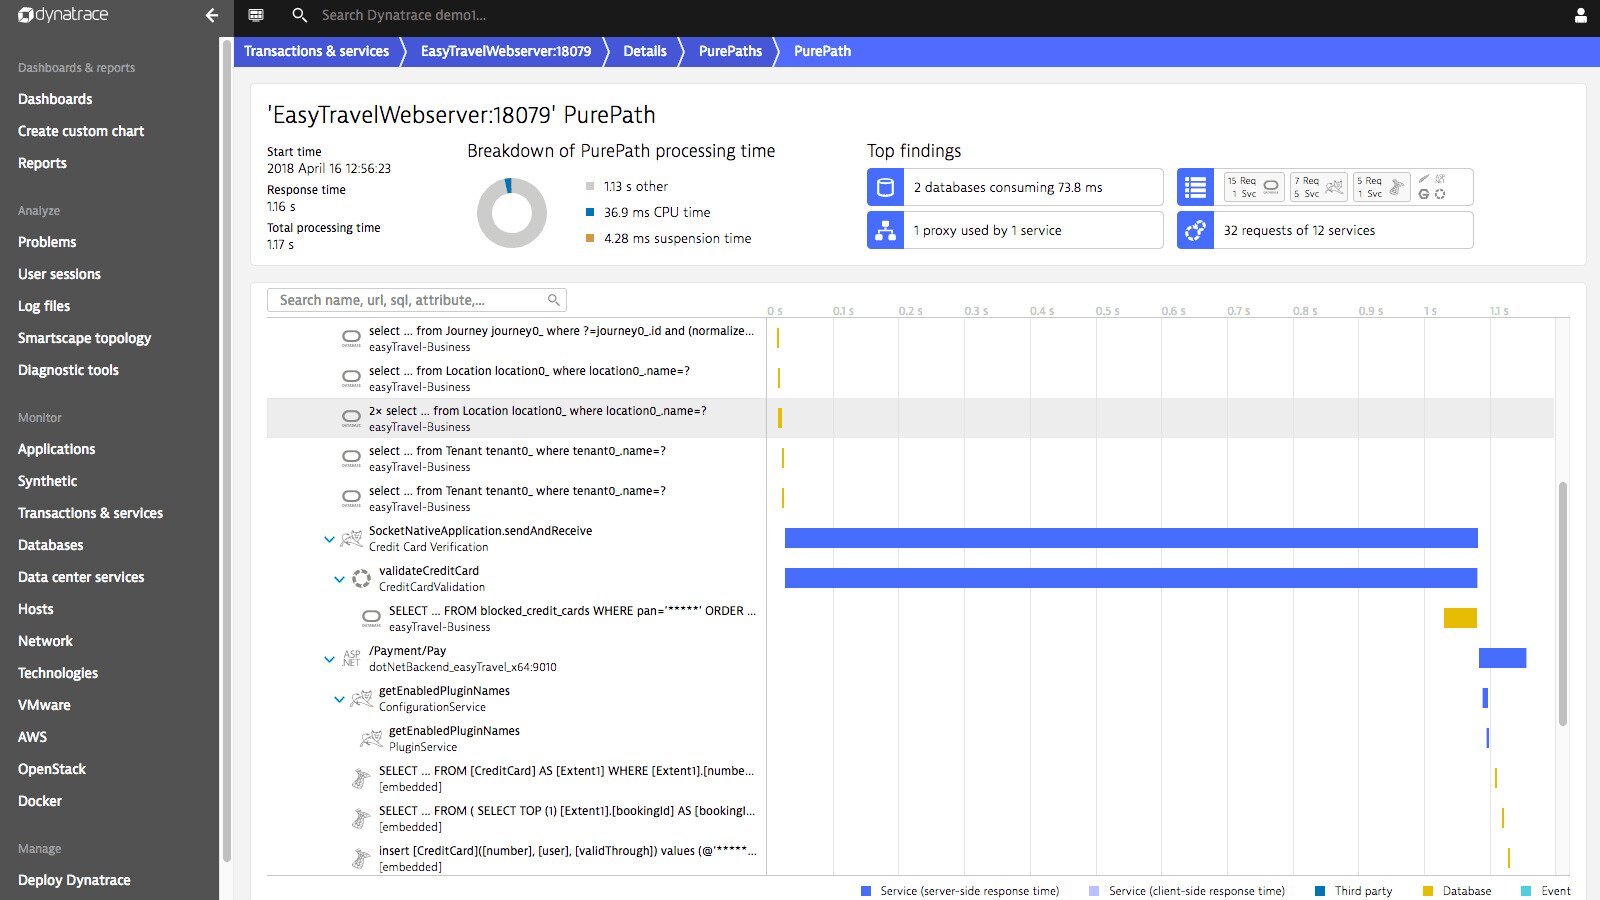
When tasked with monitoring Apache Cassandra databases, Dynatrace will automatically detect them in less than five minutes. It lets you monitor various metrics including CPU, connectivity, garbage collection time, suspension, and re-transmissions. On the “Further details” tab, you can have a deeper look at statistics such as disk usage, cache, hints, load, thread pools, and Java managed memory. The platform also features root cause analysis. It can automatically highlight the root cause of performance issues on individual nodes, allowing you to respond to server problems much faster and giving you all the necessary information to craft an informed response.
Dynatrace also claims to have the broadest coverage of any monitoring solution in terms of languages supported, application architectures, cloud, on-premise or hybrid, enterprise apps, SaaS monitoring, and more. The tool automatically discovers and monitors dynamic microservices running inside containers. It shows you how they’re performing, how they communicate with each other and it helps you quickly detect poorly performing microservices.
Pricing for Dynatrace is not readily available but it can be obtained by signing up for the free 15-day trial. Once you register for the trial, it’s only a matter of installing the agent on your servers and you could start monitoring within 5 minutes.
5. AppDynamics APM
Last on our list is AppDynamics APM, an excellent application performance management tool from Cisco. This tool will automatically discover, map, and visualize your critical customer journeys through each application service and infrastructure component. It provides management teams with a single source of information to focus on end-to-end performance in the context of the customer experience, instead of monitoring individual services.
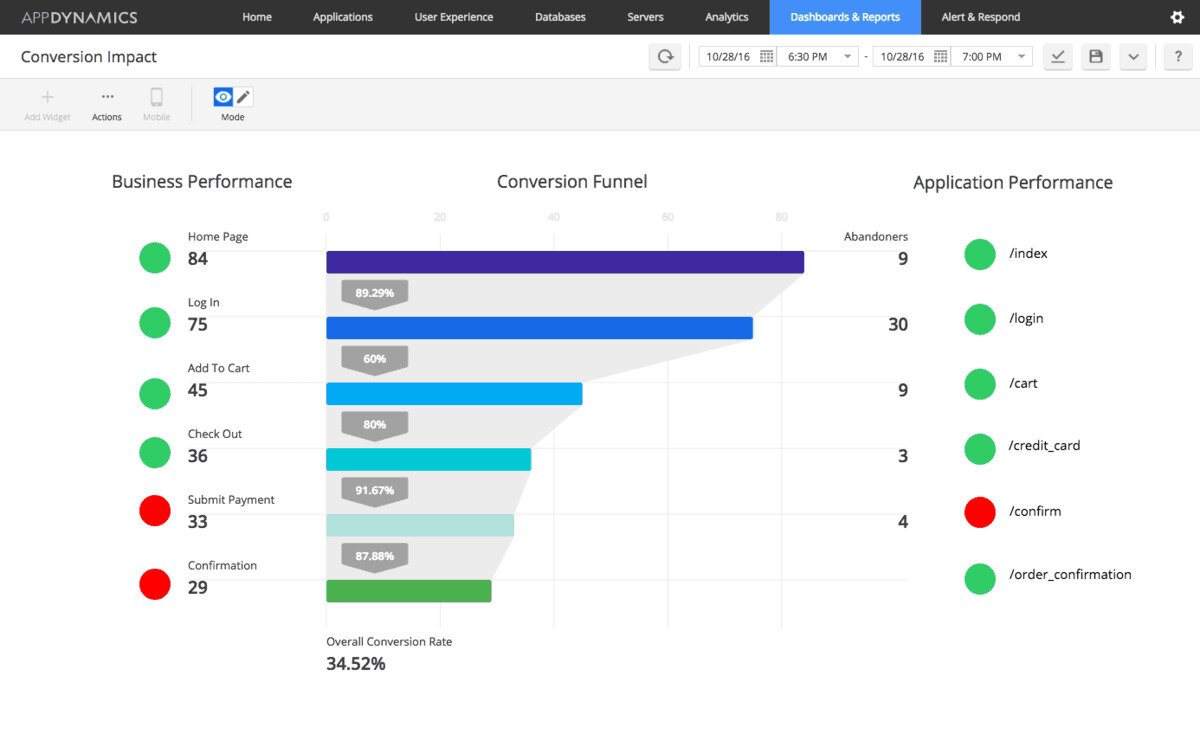
With Apache Cassandra databases, AppDynamics APM will discover them and add them to your monitoring environment. Once added, there are various metrics you can monitor. For instance, monitoring Cassandra back-end communications will let you collect data on average response time, errors per minute, and calls per minute, giving you an overview of how the service is performing.
This tool uses machine learning to learn what normal performance is, effectively building its own baseline of application performance. It allows the tool to alert you whenever performance is not normal. There is direct integration with ServiceNow, PagerDuty, and Jira so that you can be immediately alerted and fix problems before customers notice them.
Another great feature is the tool’s immediate, automated, code-level diagnostics. Its deep diagnostic capabilities enable you to identify root-cause down to the individual line of code. Your team won’t have to go sifting through log files, saving valuable developer time.
AppDynamics APM is available in several versions. The most basic is called APM Pro. APM Advanced adds server visibility and network visibility features. The top-level is called APM Peak and it includes all the features from APM Advanced plus business performance monitoring, transaction analytics, and business journeys. Pricing can be obtained by contacting AppDynamics and a 30-day trial version is available.
Introducing NoSQL databases
A NoSQL database is a type of database that provides a mechanism for storage and retrieval of data that is modelled in means other than the tabular relations used in relational databases. These databases have been around since the late 1960s, yet they did not get referred to as “NoSQL” until a surge of popularity triggered by the needs of Web 2.0 organizations in the early 21st century. NoSQL databases are increasingly used in big data and real-time web applications. And while they do not use SQL per se—hence their name—some people prefer to call them “Not only SQL” to emphasize the fact that they may support SQL-like query languages—such as the CQL for Cassandra, or sit alongside SQL databases in polyglot persistent architectures.
There are various types of NoSQL databases, with different categories and subcategories. In the case of the Apache Cassandra database, it is what is often called a wide column store. This specific type of NoSQL database uses tables, rows, and columns, but unlike a relational database, the names and format of the columns can vary from row to row in the same table. Furthermore, wide column stores such as Apache Cassandra are not column stores in the original sense of the term. In genuine column stores, a columnar data layout is adopted such that each column is stored separately on disk. AS for wide column stores, they often support the notion of column families that are stored separately, with each such column family typically containing multiple columns that are used together, similar to traditional relational database tables. All data within a given column family is stored in a row-by-row fashion, such that the columns for a given row are stored together instead of storing each column separately.
The Ins And Outs Of Database Monitoring
A great thing about Cassandra is how it comes with features like fault tolerance built-in. That, however, doesn’t mean it is a set-and-forget solution. It still needs to be managed and monitored. For instance, the availability, performance, and security of a database system are all important concerns for any database administrator. This is why system administrators typically make use of various database monitoring tools.
Adequately set up database monitoring systems can bring several benefits. For instance, proactive monitoring is always better than a reactive approach as it is always preferable to identify any warning signs before they become major incidents. Also, a proper database monitoring solution can help quickly pinpoint and resolve any possible issues. Whenever a system experience unexplained slowdowns, the first place people start investigating is often the database. But monitoring is not just about performance. We’re also talking about keeping an eye out for security-related events. Verifying backups is another common benefit of a good database monitoring tool.
There is no universally accepted model for building a database monitoring environment. This is in part due to the fact that different businesses use different databases. And since each type of database may expose different types of metrics with varying levels of granularity, an important metric on one platform may not be important on another.
For instance, let’s consider a few important differences between various types of databases that can impact your monitoring strategy. Relational databases are mostly used in online transaction processing systems. Data warehouse systems host large volumes of low-velocity data. NoSQL databases are most often used in mobile or web apps to host metadata or status information. In-memory databases are used for fast performance. It is clear that the monitoring need in each of these cases could be very different.
Furthermore, no matter what category of database you’re using, other factors will affect the important metrics. The most important is certainly the software vendor. The important metrics on a Cassandra database, of instance, could be very different from those of a MySQL database or an Oracle database. Likewise, on-premise and cloud-hosted databases could have different monitoring needs with some metrics being important in one but not in the other. In the case of cloud-hosted databases, managed and non-managed database solutions will have different monitoring needs. Likewise, on-premise databases will have different monitoring needs depending on whether they run on physical or virtual hardware.
What To Monitor
With so many metrics that can be monitored, it can be overwhelming. And deciding what to monitor—and hat not—can be a daunting endeavour. We’ve assembled a list of some metrics that we feel are important to monitor. They are listed below under different categories of monitoring. Together, these metrics can paint a rather detailed picture of the state of any database environment.
Infrastructure
The first category of monitoring metrics is infrastructure. It deals with the underlying hardware that your databases are running on. Any variation of these metrics above of below acceptable thresholds will most likely adversely affect other database metrics. For example, network overutilization could trigger performance alerts in metrics from other categories.
Availability
Database availability is, of course, another category of metrics that is among the most important. After all, you’ll usually want to make sure that the database is available and accessible before looking at any other metrics. There are several ways that database availability can be monitored but among the most popular are the accessibility of database nodes using common protocols such as ping or telnet, the accessibility of database endpoints and ports or failover events for master nodes and upgrade events for slave/peer nodes in multi-node clusters. Any of these parameters can be used to alert you of an availability issue but combining them will give you the best protection.
Throughput
Throughput often refers to the network data-carrying capacity. This is different in the context of monitoring databases, and we’re really talking about the throughput of the database itself. Ideally, throughput metrics would initially be used to create a performance baseline or, even better, several baselines during different workload periods. For example, collecting metrics during month-end batch processing or Black Friday sale events over several cycles will provide insight into a system’s performance during those periods. And it may be quite different from after-hours operations or weekday sales events. Baselines can then be used to create acceptable thresholds for alarms. Any large deviation from usual values would then need investigation.
Performance
The available performance counters could vary between different databases. They are typically reported on a specific time scale (per minute or per second, for instance). These metrics can provide a tell-tale sign of potential bottlenecks. Just as it was with throughput, creating baselines for these metrics is also recommended.
Scheduled Tasks
Database engines often automatically run repetitive tasks or scheduled jobs. Some systems, like Microsoft SQL Server or Oracle, have a built-in job scheduling facility but others use the operating system’s scheduler—such as cron—or third-party schedulers. Regardless of what the actual jobs are or how they are scheduled, what you need to monitor is not only that they ran but, more importantly, what their outcome (success or failure) was.
Security
Security is often the most important aspect of IT administration and this is just as true with databases as it is with other systems. As such, it is important to keep an eye on the security of your databases. And while you may not need to monitor every single security event, you might want to look at their aggregated meaning. Let’s explain. Suppose you’re monitoring failed login attempts. A single failed login is most likely a sign of someone mistyping a password. On the other hand, if you see hundreds of them within a relatively short time frame, it could be the sign of an intrusion attempt.
Failed logins are certainly not the only security element you want to monitor. Database configuration change events are just as important. And so are new user account creations or password changes. Again, a single instance of these events is usually normal by if repeated, they could be cause for concern.
Logs
Logs are the place where most database engines record various types of information. They can be made of a single file or of several ones. Some systems log to text files while others log to a database. But no matter how, where or what your database logs, your monitoring tools can help you with that too. The problem with logs is their quantity. Most systems will create hundreds of log entries every hour, too much for a human to cope. Some monitoring tools will capture the logs, parse and analyze them and create metrics dashboard from the data they contain. In fact, log management is one of the core requirements of database monitoring. There are several reasons for that but the most important is the breadth of information they contain.
Wrapping Up
All the tools we’ve just reviewed are great for monitoring your Apache Cassandra databases. But I’d like to let you in on a secret. They’re also great for all sorts of monitoring. All tools and services will monitor quite a few things besides databases. In fact, this is probably what you should consider the most when selecting your monitoring solution. Pick one that will not only monitor your databases but also all your other applications and servers. After all, you’ll save quite a bit of effort by having only one tool to deploy and you’ll enjoy having a unified user interface for most of your monitoring needs.