

Best PRTG Alternatives: Our Top 6 Monitoring Tools for 2026
The Paessler Router Traffic Grapher (PRTG) is a renowned network monitoring tool developed by the German company, Paessler AG. This tool was launched approximately 15 years ago as an enhancement of the then-popular MRTG (Multi Router Traffic Grapher), which is considered the pioneer of all network monitoring tools. Fast forward to the present day, the market is now flooded with a plethora of network monitoring tools. Many of these tools, such as SolarWinds Network Performance Monitor, SolarWinds ipMonitor, and ManageEngine OpManager, are on par with PRTG in terms of performance. Some tools even surpass PRTG in certain aspects. Additionally, there are free and open-source tools like Cacti and Zabbix that can compete with PRTG in terms of features and quality.
Today, we’re having a look PRTG alternatives. Whether you’re currently using PRTG and are looking for something better or you’ve heard of it and are wondering what else is available, you’ve come to the right place. We’re about to review six of the best PRTG alternatives we could find.

Before we start reviewing the alternatives, we’ll describe what PRTG is and what its main features are. That will certainly help us compare the alternatives. In case you’re new to network monitoring, we’ll also do our best to explain what it is and how it works. That should help you better understand the features of the reviewed products. And if you’re not convinced, we’ll also discuss the benefit of network monitoring tools in general. Only then will we be ready to review the six best PRTG alternatives we could find. With a mix of paid and free tools, there is something for everyone on our list. None of the products is an exact feature match for PRTG but all have interesting features—some of them unique—that we’ll do our best to highlight.
What Is PRTG, Exactly?
In one sentence, PRTG is an agentless network monitoring system. Agentless means that it doesn’t require any special software—referred to as an agent—to be running on the monitored systems. PRTG’s name is an acronym for Paessler Router Traffic Grapher but also a play on word that refers to MRTG (the Multi Router Traffic Grapher), one of the first SNMP monitoring tool.
Paessler claims that PRTG is the fastest monitoring tool to set up. According to the publisher, it can be set up in a couple of minutes. Our experience shows that while it can take a bit more than two minutes, it’s still very easy and quick to set up, thanks to its auto-discovery feature that will scan your network to find devices and automatically add them to the tool. After the auto-discovery completes, further information on the detected devices can be retrieved using various communication protocols. The system uses a combination of Ping, SNMP, WMI, NetFlow, jFlow, sFlow, but can also communicate via DICOM or the RESTful API.
This tool is based on sensors that are configured for a specific purpose. For example, there are HTTP, SMTP/POP3 (e-mail) application sensors. There are also hardware-specific sensors for switches, routers, and servers. PRTG has over 200 different predefined sensors that retrieve statistics such as response times, processor, memory, database information, temperature or system status from the monitored devices.
PRTG offers a selection of user interfaces. The primary one is an Ajax-based web interface. There’s also a Windows enterprise console as well as mobile apps for Android and iOS. One nice feature of the mobile apps is that they can use push notification of any alerts triggered from PRTG. More standard SMS or email notifications are also available. Although the server only runs on Windows, it can be administered from any device with an Ajax-compatible browser.
PRTG is offered in two versions. There’s a free version which is full-featured but will limit your monitoring ability to 100 sensors with each monitored parameter counting as one sensor. For example, if you monitor two interfaces on a router, it will count as two sensors. For more than 100 sensors, you need to purchase a license. They start at $1 600 for 500 sensors. You can also get a free, sensor-unlimited and full-featured 30-day trial version.
SNMP Monitoring Explained
Although the “S” in SNMP stands for simple, it is actually quite a complex protocol. But just as you don’t have to be an auto engineer to drive a car, you don’t have to know all about SNMP to use it. However, it’s good to have at least an idea of how it works.
At its base, SNMP is a communication protocol that determines how an SNMP management system car read and write operational parameters in remote devices. The parameters are referred to as OIDs, an acronym for Object IDentifiers. In the context of monitoring networking devices, two OIDs are of particular interest, the bytes out and the bytes in counters. These counters are automatically incremented by networking equipment as bytes are output or input. There is one such pair of counter per network interface.
The SNMP protocol dates back from when IT security was not an issue. As such, it only has minimal security. An SNMP manager connecting to an SNMP-enabled device will transmit a so-called community string with its request. If the string matches that configured in the equipment, the request will be carried out. Devices typically have two community strings, one for read-only OIDs and one for modifiable ones.
Here’s how a monitoring system such as PRTG uses SNMP to monitor bandwidth utilization. The system periodically reads the bytes in and out counters of the networking device’s interfaces at know intervals. Typically, devices are polled every five minutes. The monitoring system stores the fetched values in some sort of database or disk file.
The rest of the process is just mathematics. The monitoring system subtracts the previous counter value from the current one to get the number of bytes transmitted or received in five minutes. It can then multiply that number by eight to get the number of bits and divide it by 300–the number of second in five minutes–to get the number of bits per second. This information is typically plotted on a graph showing its evolution in time and stored in a database.
One important thing to keep in mind is that what you get out of this process is average utilization in bits per second over a five-minute time span. Imagine a 100 Mbps interface. In the five minutes between samples, the actual traffic level could have been at 100 Mbps for 150 seconds and at 0 for 150 seconds and it would display an average traffic of 50 Mbps although the interface was maxed out for half of the five minutes. This is a shortcoming of every SNMP monitoring system. It won’t give you instantaneous, live utilization figures. Some tools can use other means to get real-time traffic figures but they are not common. Five-minute averages are usually sufficient for most administrator’s needs.
Some Uses Of Monitoring Tools
There are several reasons why network monitoring systems such as PRTG can be useful. First and foremost, it will help you pinpoint areas of contention. When network circuits become overutilized, their performance could and probably will degrade. This is certainly something you would prefer to avoid. By keeping an eye on network bandwidth utilization you have a chance to detect high utilization—and fix it—before it starts affecting users.
Capacity planning is another big advantage of network monitoring tools. Network circuits—especially long distance WAN connections are relatively expensive and often have a limited bandwidth that was considered OK when they were first installed. But just like disk storage, bandwidth needs keep increasing. By monitoring the evolution of your network’s bandwidth utilization, you’ll be able to see which ones need to be upgraded and when.
Network monitoring can also come in handy when troubleshooting poor application performance. When a user complains that some remote application has slowed down, looking at the network utilization could give you a pretty good idea whether or not the problem is caused by network congestion. If you see low network utilization, you can likely concentrate your troubleshooting efforts elsewhere.
6 Best PRTG Alternatives
Let’s have a look at the best six PRTG alternatives available. Some of our top tools are paid ones while others are free tools. All of our picks are excellent products and choosing one over the other will largely be a matter of personal preference. Most paid products offer a free trial, giving you a chance to see first-hand if they meet your needs.
1. SolarWinds Network Performance Monitor (FREE TRIAL)
SolarWinds rarely requires introduction amongst network administrators. If you don’t know it, the company is famous for its excellent network administration tools, including an excellent help desk management software or one of the best switch port monitoring software. SolarWinds is also famous for its free tools that address specific needs. They have, for instance, an excellent subnet calculator and a very good TFTP server.

SolarWinds’ flagship product is called Network Performance Monitor, or NPM. It is a full-featured network monitoring solution with great functionality. The SolarWinds NPM polls WAN routers using the SNMP protocol to reads their interface counters. It stores the results in an SQL database and uses the polled data to build graphs showing each WAN circuit’s usage.
The SolarWinds Network Performance Monitor boasts a user-friendly GUI and adding a device is as simple as specifying its IP address or hostname and SNMP community string. It then queries the device, lists all the SNMP parameters that are available, and allows you to pick those you want to monitor and display on your graphs. For WAN monitoring, you’ll be specifically interested in the WAN interface traffic counters but you could also include error counters as well as CPU and memory utilization counters.
Prices for the SolarWinds Network Performance Monitor start at just under $1,785 and vary according to the number of devices to monitor. A detailed quote can be obtained by contacting the SolarWinds sales team. And if you’d want to try the product before you buy, a free 30-day trial is available, as it is for most paid SolarWinds products.
2. Solar Winds ipMonitor

When it comes to a tool that is a powerful, yet lightweight and affordable, SolarWinds ipMonitor fits the bill—especially for smaller environments. In comparison, Network Performance Monitor provides deeper network visibility and advanced troubleshooting, while offering scalability for larger, more robust environments.
ipMonitor is a centralized monitoring tool designed to provide essential up/down visibility into the performance of network devices, servers, and applications providing detailed insight into the availability,
usage, and performance of these critical components. This alternative to PRTG offers out-of-the-box setup and doesn’t require
a third-party database or web server. Additional features include easy alerting and reporting,
customizable dashboards, built-in remediation capabilities, and even user experience monitoring.
3. ManageEngine OpManager
The third product as the best alternative to PRTG is ManageEngine. This tool is another well-known and respected name in the field. And the ManageEngine OpManager is a top-of-the-line product. It can run on either Windows or Linux and it is loaded with great features, It’s got, for example, an auto-discovery function that can map your network and display it on its dashboard.
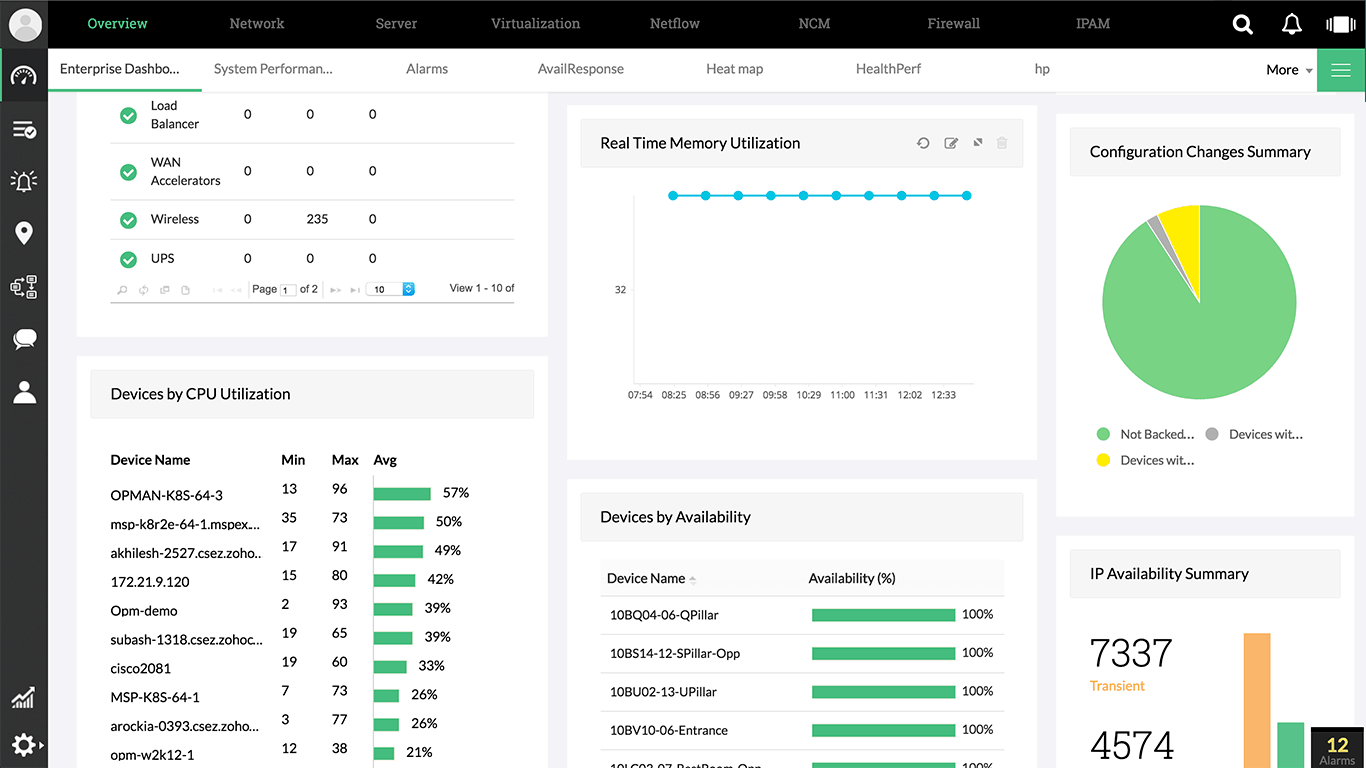
As for the product’s dashboard, it is super easy to use and navigate and it has drill-down functionality. If you prefer them, there are also apps for tablets and smartphones that will let you access the system from anywhere. Overall the ManageEngine OpManager is a very polished and professional product.
A free version of the ManageEngine OpManager is available. However, this PRTG alternative is limited and will let you monitor no more than ten devices. There are also paid versions available under either the Essential or the Enterprise plans. The first will let you monitor up to a thousand nodes while the other is good for up to ten thousand.
4. Cacti
Cacti is a free and open-source complete network monitoring tool. Its main components are a fast poller, advanced graph templates, and multiple data acquisition methods. Cacti also features user access control built right into the product. The product boasts an easy to use albeit antique-looking web-based user interface. This PRTG alternative scales very well from the smallest single device installations up to complex networks with many different WAN sites.
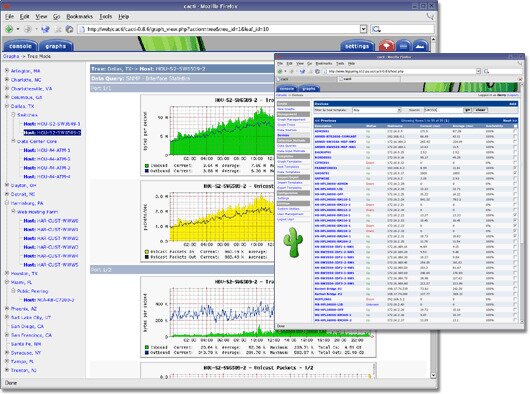
Cacti uses SNMP to fetch data and stores it in a SQL database. It is primarily written in PHP and can be modified to suit your needs. One of the product’s strongest features is its use of templates. There are built-in templates, for example, for Cisco routers that already includes most of the elements you might want to monitor on such a device. But there are not only device templates; there are also graph templates. Together, templates make configuring the software much easier. You can also build your own customized templates if suitable ones don’t already exist. Also, many device-specific templates can be downloaded from device vendor’s websites and many community-driven Cacti forums offer them for download.
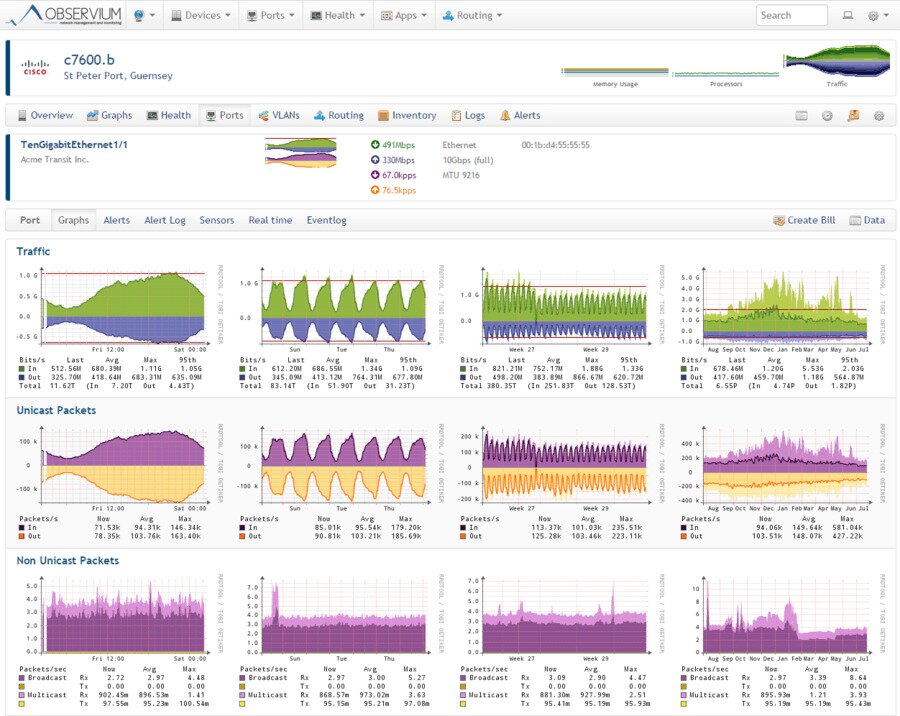
5. Observium
Observium is a low-maintenance monitoring platform with auto-discovery. It supports a wide range of device types, platforms and operating systems including, among others, Cisco, Windows, Linux, HP, Juniper, Dell, FreeBSD, Brocade, Netscaler, NetApp. I doubt that you can find a WAN router that’s not supported. Observium’s primary focus is providing a beautiful, intuitive, and simple yet powerful user interface showing the health and status of your network.
The product is available in two versions. There’s the Observium Community is which available for free to everyone. This version receives updates and new features twice a year. There’s also Observium Professional which has additional features and comes with daily updates. Both versions only run on Linux.
Observium has more than just bandwidth monitoring. For instance, there’s an accounting system that will measure total monthly bandwidth usage in the 95th percentile or in total transferred bytes. This PRTG alternative also has an alerting function with user-defined thresholds. Furthermore, Observium integrates with other systems and can pull their information and display it within its interface.
Observium users love how easy it is to set up and how it almost configures itself. Although there doesn’t appear to be a download section on Observium’s website, there are detailed installation instructions for several Linux distributions that do include the links to get the right package for each distribution. The instructions are very detailed and installing the software should be easy.
6. Zabbix
Zabbix is another free and open-source product which has a highly professional look and feel, much like you’d expect from a commercial product. But the good looks of its user interface is not its only asset. The product also boasts an impressive feature set. Zabbix will monitor most network-attached devices in addition to networking equipment. It would be a good option if you want to monitor servers in addition to your WAN circuit’s bandwidth.
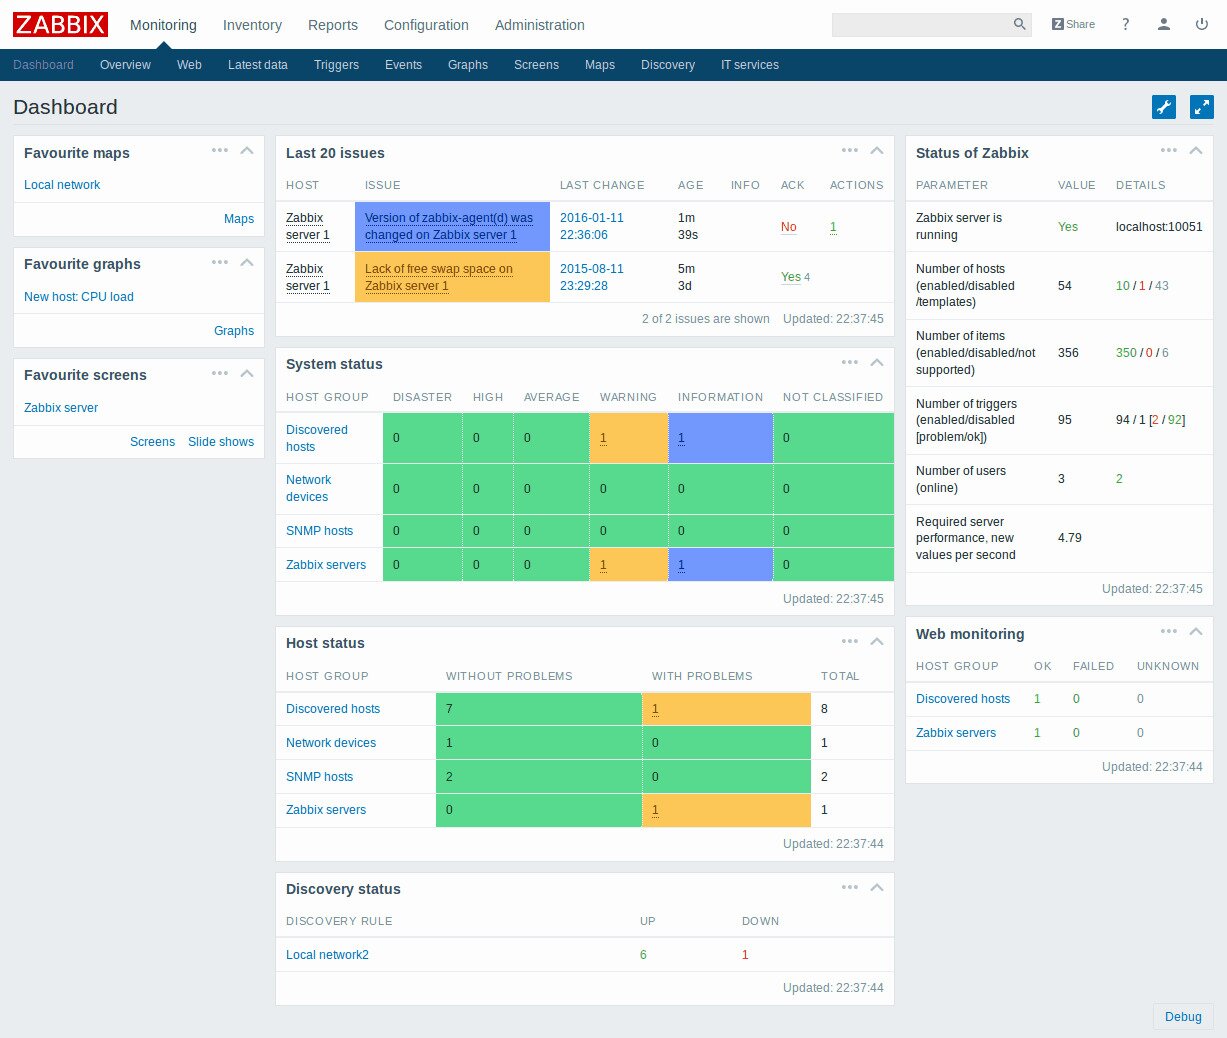
Zabbix uses SNMP as well as the Intelligent Platform Monitoring Interface (IMPI) for monitoring devices. You can use the software to monitor bandwidth, device CPU and memory utilization, general device health as well as configuration changes. As you can see, it does way more than simple WAN monitoring. The product also features an impressive and completely customizable alerting system. It will not only send email or SMS alerts but also run local scripts which could be used to fix some issues automatically.
In Conclusion
We could have easily made this list 10 items long, perhaps even longer. But we chose to stop at six. And though that certainly doesn’t mean these are the only alternatives to PRTG, it means that we are comfortable recommending any of those products listed.
Each one has some interesting features and each one will do an excellent job of monitoring networks using SNMP. However, SolarWinds Network Performance Monitor has the edge over other products since its feature-rich capable, and user-friendly interface.