

Best MRTG Alternatives to Improve Your Network Monitoring in 2026
The Multi Router Traffic Grapher, or MRTG, is the granddaddy of all network monitoring platforms. It was created in the mid-1990’s to fill a need for a tool to display a low-bandwidth Internet link’s utilization. It quickly evolved into a rather complete monitoring solution that can poll almost any number of devices and build pretty graphs showing their interface’s utilization. It is still in relatively widespread use although the latest version is now 7 years old. Today, we’re showing you the five best MRTG alternatives. They address most of MRTG’s shortcomings and usually provide a far better experience, a prettier interface, and an easier configuration.
Before we reveal our top five picks of the best MRTG alternatives, we’ll first get to know MRTG in a bit more details. We’ll explain how the tool works in the background. And since the goal of most MRTG alternatives is to address the original system’s shortcomings, we’ll also discuss what those are and what can be done about them. Some can easily be fixed while others are inherent to the technology used. We’ll finish off with the core of our subject and review the five best MRTG alternatives. Our list has a mix of free and commercial software, some of which can easily scale up to very large networks.
(Almost) Everything You Need To Know About MRTG
According to Wikipedia, MRTG is a “free software for monitoring and measuring the traffic load on network links. It allows the user to see traffic load on a network over time in graphical form“. While this description is scrupulously exact, it doesn’t say much.
To better understand MRTG, let’s go back in history to the summer of 1994 at the DeMonfort University in Leicester, UK. The university then had over 1000 networked computer sharing a single 64 kbps Internet link. Needless to say that, even in these days of mostly text-based computing, the link often suffered important congestion. It was clear that the university couldn’t get a bigger circuit for at least a year so it was decided to put something in place so that every user could see a live depiction of the circuit’s bandwidth utilization over time.
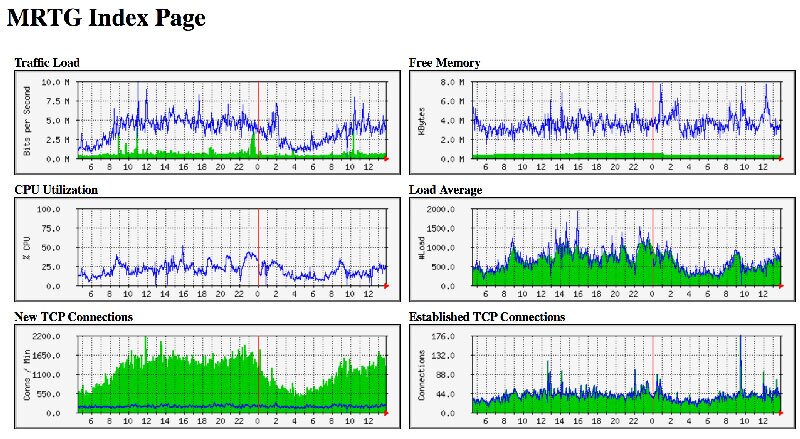
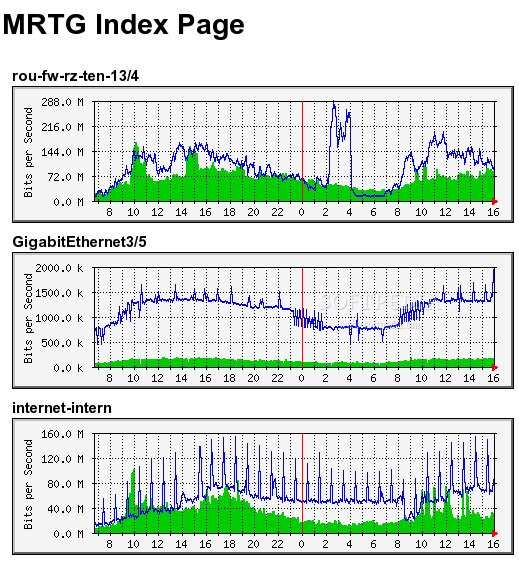
The Multi Router Traffic Grapher was born. Every five minutes, it polled the octet counters of the university’s Internet gateway router. The software used this data to derive the average transfer rate of the Internet link for every five-minute interval. The tool also generated a web page with four graphs showing the transfer rates for the last day, week, month, and year.
From then on, everyone with a web browser was able to monitor the status of the link. Of course, the availability of the graphs did nothing to increase the link’s capacity but it provided the necessary arguments to convince the university managers that a bigger link was indeed needed. To this day, capacity planning is still one of the main uses for MRTG and alternative systems.
How Does It Work?
MRTG capitalizes on the Simple Network Management Protocol, or SNMP, a feature that is built into most network equipment. SNMP-enabled devices have counters that can be remotely read by monitoring systems like MRTG. It is efficient and it gets the job done. All the MRTG alternatives proposed here use SNMP in a similar way.
We’ll spare you most of the technical details and all the jargon but you might want to know how it works. In the context of monitoring bandwidth usage, two specific SNMP parameters are of interest. One logs the number of bytes out of an interface and the other logs the number of bytes in. Switches, routers, and other networking equipment have one pair of those for each interface.
So, MRTG polls each device it monitors at 5-minute intervals and reads the value of the two counters for each interface it is configured to monitor. Then, it subtracts the previous values of the two counter from the current ones. The results are the number of bytes in and out in five minutes. Using simple maths, it multiplies these numbers by 8 (the number of bits in a byte) and divides them by 300 (the number of seconds in five minutes) to get the average bandwidth usage in bits per second over the past five minutes.
Of course, MRTG does not only do the maths. it also stores the values it reads every five minutes in a round-robin archive file–a type of file that automatically summarizes older data and never grows beyond a certain size–and creates nice-looking graphs showing the parameter’s evolution over time. And since those graphs have to be put somewhere, MRTG also builds web pages to hold the graphs.
MRTG’s Shortcomings
Although MRTG has some strong points going for it–such as being free and open-source and written mostly in Perl so anyone can easily modify it and adapt it to his needs–the software has a few serious shortcomings. First and foremost, MRTG is a rather old tool with a strong Unix background. It has been ported to the Windows platform a while ago but the installation process is quite cumbersome. The process is well documented in a document named mrtg-nt-guide. Doesn’t that name give you an idea of the document’s age?
I’ll save you the details but suffice to say that the installation steps are numerous and complicated. For instance, you need to install Perl on your computer before installing MRTG. Also, MRTG can’t run as a service unless you use an external utility that can run any application as a service. The documentation suggests one such tool which used to be free but is now a paid program. Overall, installing MRTG on Windows can be a pain in the you-know-where.
Another problem with MRTG is that its configuration is mostly done via text files that must be edited. In this day and age where we’ve become accustomed to GUI control panels and autoconfiguration wizards, this may feel somewhat dated. One thing is for sure, the tool has a steep learning curve.
MRTG includes a tool called cfgmaker–a Perl script–that will create MRTG configuration files based on information pulled from an SNMP-enable device but using it is definitely not intuitive. And, as you may have guessed, there is no discovery process that will scan your network for SNMP manageable devices and let you pick those you want to monitor.
Finally, the “current” version of MRTG dates from January 2012, more than six years ago. This can mean two things. Either the product is that good and requires no additional functionality or bug fixes or it is no longer actively maintained. I opt for the second. It doesn’t mean that the product is not good anymore. It’s certainly as good as it was back in 2012 but chances are that newer alternative products have newer features or use better–and possibly faster–technologies.
The Best MRTG Alternatives
We’ve scoured the Internet looking for the best MRTG alternatives. Specifically, we were looking for products that didn’t have the shortcomings of MRTG while accomplishing essentially the same task i.e. measuring interface bandwidth utilization and displaying it as graphs on a web page. Some of our finds are huge commercial tools that have many more functionalities than MRTG and that can cost up to thousands of dollars while others are just “improved” versions of MRTG with essentially the same functionality but a cleaner and easier to use interface.
1. SolarWinds Network Performance Monitor (Free Trial)
SolarWinds usually requires no introduction with network administrators. The company has been famous for a while for its excellent network administration tools and for publishing many free tools to accomplish specific tasks. SolarWinds’ flagship product is called Network Performance Monitor, or NPM. It is a complete network monitoring solution that goes way beyond MRTG’s functionality. But since we’re talking about MRTG alternatives, let’s first concentrate of NPM’s MTRG-like features.
Just like MRTG, SolarWinds NPM polls network devices using the SNMP protocol and reads their interfaces’ counters. NPM stores the results in an SQL database and uses the polled data to build graphs showing each interface’s usage.

The system uses a user-friendly GUI and adding a device is as simple as specifying its IP address or hostname and SNMP connection parameters–known as community strings. The tool then queries the device and list all the SNMP parameters that are available and lets you pick those you want to include on your graphs. A typical network switch or router, for example, will have traffic and error counters for each interface as well as CPU and memory utilization counters.
The Network Performance Monitor’s scalability is one of its best features. It will scale from the smallest of networks up to large networks consisting of tens of thousands of devices spread over many sites. To help with scaling up, upgrading licenses is an easy process.
Another great feature of NPM is its ability to automatically build network maps and to display a visual representation of the critical path between two devices or services. This feature is invaluable when troubleshooting application access issues.
Price wise, SolarWinds Network Performace Monitor starts at just under $3 000 and varies according to the number of devices to monitor and the selected optional components. You’ll need to contact the SolarWinds sales team for a detailed quote. But if you’d want to try the product before you buy, a free 30-day trial is available, as it is for most paid SolarWinds products.
2. PRTG
PRTG or, more precisely. the Paessler Router Traffic Grapher is another excellent monitoring system. It is an enterprise-grade product which Paessler claims to be the easiest to set up. According to Paessler, PRTG can be set up in a couple of minutes. Your experience may vary and we certainly spend more than that but it’s still very easy and quick to set up. Definitely more so than MRTG so it does address one of its major limitations.
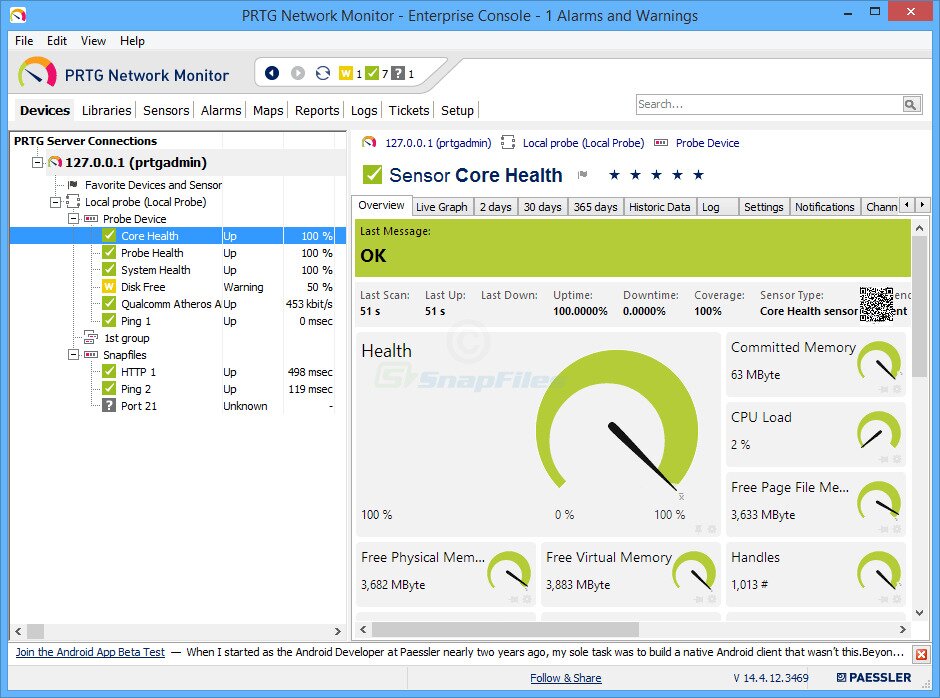
As easy as it is to install, the product is still feature-rich. As an example, it comes with several different user interfaces. There’s a Windows enterprise console, an Ajax-based web interface, and mobile apps for Android and iOS. The mobile apps fully exploit the platform’s capabilities and can, for instance, scan QR codes affixed to equipment to quickly access their graphs.
PRTG can be downloaded from the Paessler website where you’ll need to choose between two options. There’s the free version which is full-featured but will limit your monitoring ability to 100 sensors or the free 30-day trial version which is unlimited but will revert back to the free version once the trial period is over. Each monitored parameter counts as one sensor. For example, monitoring bandwidth on each port of a 48-port switch will count as 48 sensors.
3. ManageEngine OpManager
OpManager from ManageEngine–another top-of-the-line maker of network management tools–is our third pick. It can run on either Windows or Linux and boast several great features, Among others, there is an auto-discovery feature that can map your network and display it on its dashboard. The miniature, color-coded graphs shown at the top of each page are also a great feature of the product.
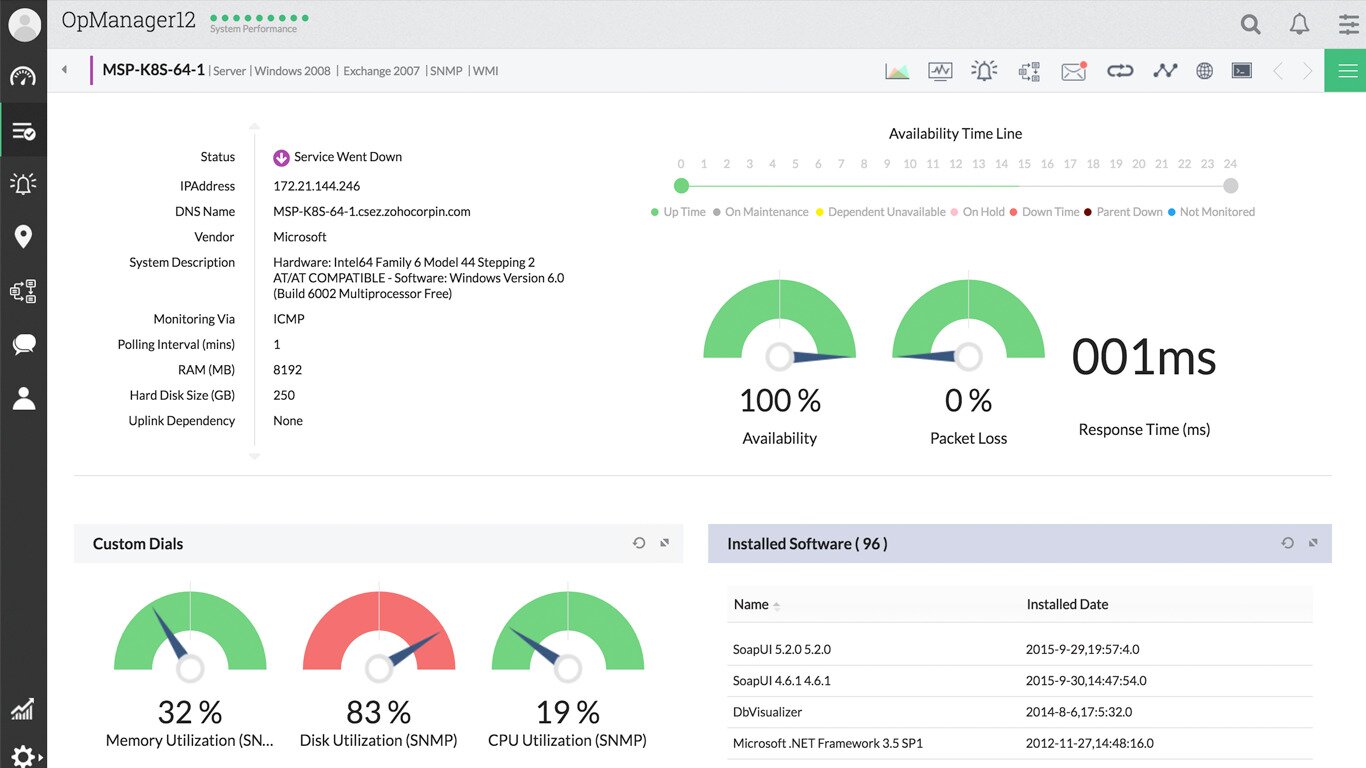
Back to the product’s dashboard, it is super easy to use and navigate and it has drill-down functionality. If you are so inclined, there are also apps for tablets and smartphones that will let you access the system from anywhere. This is an overall very polished and professional product.
A free version is available should you want to try it before purchasing. This a truly free version and not a free trial. It is, however, limited and will let you monitor no more than ten devices. If you manage a tiny network, perhaps you can get by with the free version. As for paid versions, you can choose the Essential or the Enterprise plans. The first will let you monitor up to 1,000 nodes while the other goes up to 10,000.
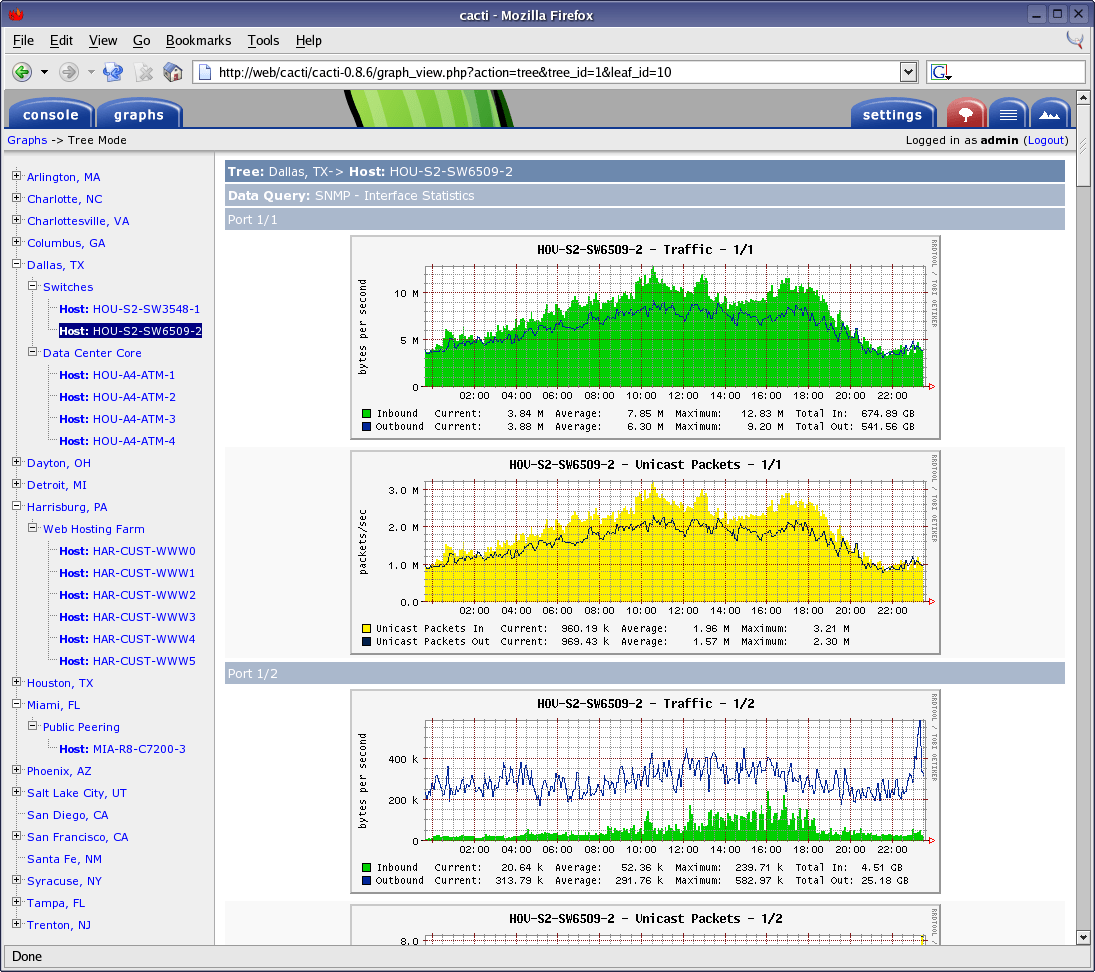
4. Cacti
Cacti is a close parent of MRTG. Its main component is RRDTool, a data logging and graphing system that was developed by Tobi Oetiker, MRTG’s primary developer. This heritage is pretty apparent when you look at Cacti’s graphs which are amazingly similar to MRTG’s.
Cacti is a free and open-source complete network monitoring tool. The main components of Cacti are a fast poller, advanced graph templating, and multiple data acquisition methods. Cacti also features user access control built right into the product. It’s also got an easy to use web-based interface. Cacti scales very well from the smallest single LAN installations up to complex networks with thousands of devices on multiple sites.
Cacti uses RRDTool to fetch and store data in a SQL database and to create the graphs and it is primarily written in PHP and can be modified to suit your needs. One of its strongest features is its templates. There is a built-in template, for example, for Cisco switches that already includes most of the elements you might want to monitor on such a device. But there are not only device templates, there are also graph templates. They make configuring the tool much easier. And you can build device-specific templates if they don’t already exist. There are also many device-specific templates that can be downloaded either from each device manufacturer’s websites or from community Cacti forums.
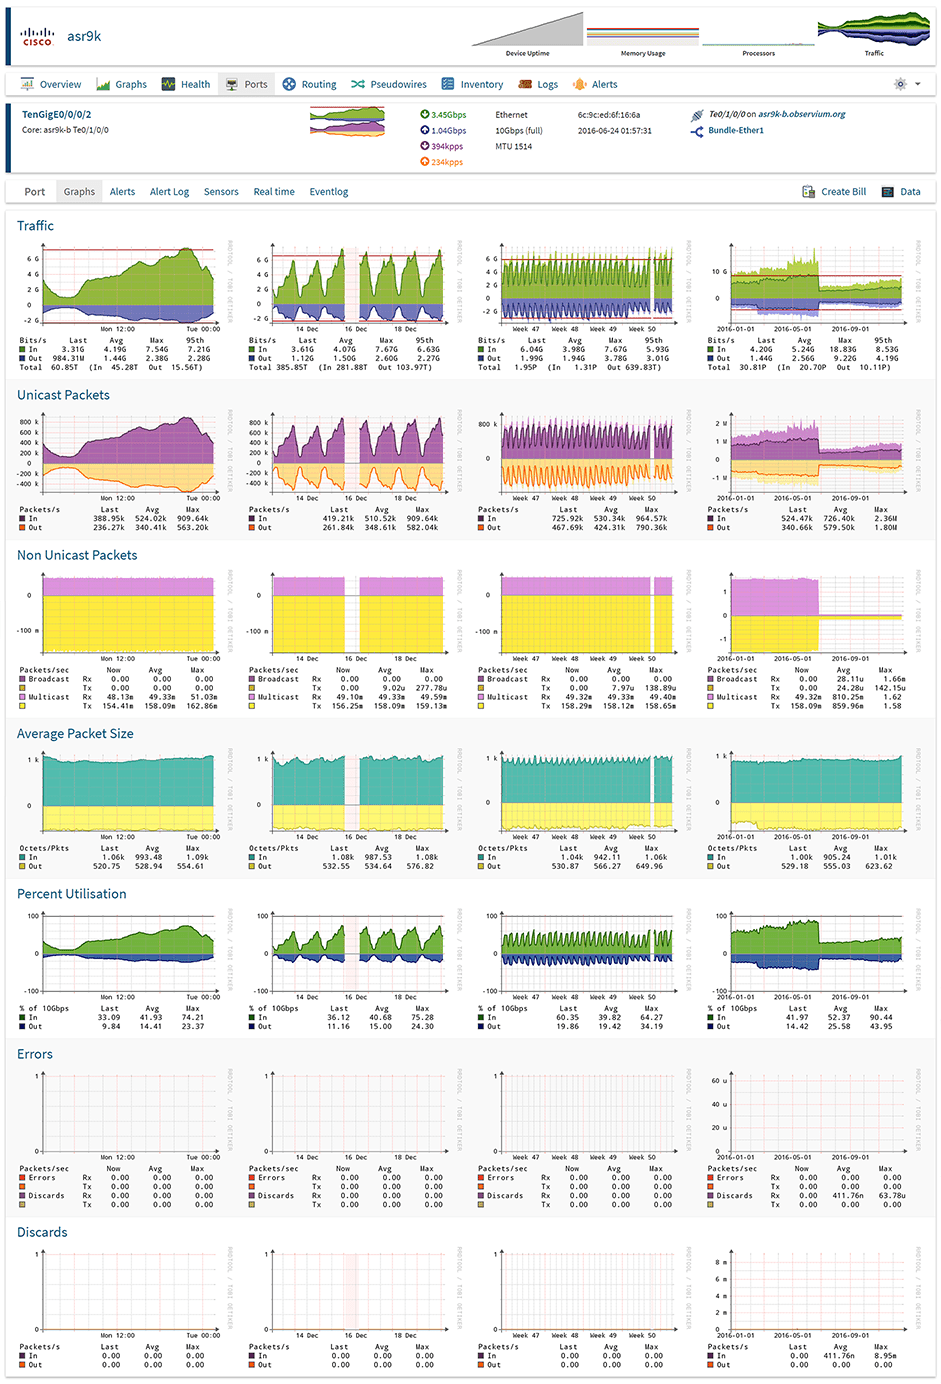
5. Observium
Observium is a monitoring platform that features low-maintenance and auto-discovery. It supports a wide range of device types, platforms and operating systems including, among others, Cisco, Windows, Linux, HP, Juniper, Dell, FreeBSD, Brocade, Netscaler, NetApp. Observium’s primary focus is providing a beautiful, intuitive, and simple yet powerful user interface showing the health and status of your network.
The product is available in two versions. There’s the Observium Community is which available for free to everyone. This version receives updates and features twice a year. There’s also Observium Professional which has additional features adds comes with daily updates. Both editions only run on Linux platforms.
Observium offers way more than just bandwidth monitoring. For instance, there’s an accounting system that will measure total monthly bandwidth usage in the 95th percentile or in total transferred bytes. It also has an alerting function with user-defined thresholds. Furthermore, Observium integrates with other systems and can pull their information and display it within its interface.
Observium users love how easy it is to set up and how it almost configures itself. Nothing is perfect, though, and finding the software can be a challenge. There doesn’t appear to be a download section on Observium’s website. There are, however, detailed installation instructions for several Linux distributions that do include the links to get the package.
In Conclusion
As much as MRTG has always been–and still is–an excellent product, there are now more polished products that are available. Many have extended features and all are easier to set up and use. They’re still complex products and they will require some initial efforts but they will be well rewarded.