

Monitor Router Traffic: 7 Best Monitoring Tools and Software
Who doesn’t want to have a better view of what is happening on their networks? With most network traffic eventually going through a router, it seems obvious that monitoring router traffic is one of the best ways to keep a watchful eye on what is going on. Today, we’re having an in-depth look at monitoring router traffic. We’ll discuss the why and the how as well as review some of the best tools available for that purpose.

Our journey will begin by describing router traffic monitoring and, more specifically, differentiate the various types of monitoring there are. Next, we’ll explain the differences between quantitative and qualitative monitoring as well as explain the main technologies each type of monitoring uses. And with that theory behind us, we’ll explore the tools available for monitoring router traffic, starting with bandwidth monitoring tools and continuing with flow analysis tools.
About Router Traffic Monitoring
It is easy to make an analogy between network traffic and road traffic. Network paths and circuits can be thought of as highways and the data they transport are like vehicles travelling on them. Continuing the analogy, a router similar to a highway interchange. But while automobile traffic is visible and any problem or congestion is readily observable, seeing what’s going on within a network can be a bit more complex. Router traffic is hidden within the devices, copper cables or optical fibres and it travels at blinding speeds, way too fast for you and me to see it.
Monitoring router traffic requires the use of specialized monitoring tools. Some will poll devices to get their interfaces’ traffic figures and calculate how much data goes through them. Other tools, as we’re about to see, use a different approach to get details about data flows and build reports that not only show how much data goes by but also what that data is, where it’s coming from and where it’s going to.
Quantitative or Qualitative?
The first type of router monitoring is referred to as bandwidth utilization monitoring or, more simply, bandwidth monitoring. It is used to calculate how much data is transported on each router interface. He vast majority of bandwidth monitoring tools rely on the Simple Network Management Protocol or SNMP to poll routers, read their interface counters and compute the amount of traffic going through their interfaces. They can use the computed data to build graphs depicting the evolution of the monitored interfaces’ utilization over time. Some of these tools will let you zoom in into a short time span where graph resolution is high and can, for instance, display 5-minute average traffic or zoom out to a longer time span–a month or even a year–where it displays daily or weekly averages.
The other type of router traffic monitoring is called flow analysis. This technology can give you many more details about the data passing through your routers. Flow analysis tools don’t just tell you how much traffic is going by, they give you qualitative information about that traffic. They rely on software that’s built right into your router’s firmware to provide them with detailed usage data. Using these tools can give you details such as the top talkers and listeners, the network usage by source or destination address or the network usage by protocol or by application.
While a handful of flow analysis technologies exist, Cisco’s NetFlow is the most common of them. It is available, as you might have imagined, on most Cisco devices. It is also available—sometimes under a different name—on equipment from other vendors, such as J-flow on Juniper devices or NetStream on HP and Huawei equipment. There’s even an IETF standard protocol called IPFIX which is based on the latest version of NetFlow. Typical flow analysis tools support several—if not all—technologies.
SNMP Explained
The Simple Network Management Protocol (SNMP) is the most common quantitative router monitoring technology. SNMP-enabled routers (which means pretty much all routers—I’ve never seen one that didn’t support SNMP out of the box) “publish” a certain number of metrics or parameters. Some are configuration parameters that can be modified while others are read-only counters, used mainly for monitoring purposes. There are, for example, CPU and memory usage gauges as well as interface traffic counters, all remotely readable via SNMP.
Although it’s easy to understand how these tools can read router gauges, how they calculate bandwidth utilization is a bit more complex. Two counters called bytes in and bytes out (each router interface has them) are read by the monitoring tool at regular intervals. Every 5 minutes is a typical value. The monitoring tool then subtracts the previous value of the counter from the current one to get the number of bytes transferred during the interval. It multiplies that number by 8 to get the number of bits in that interval before it simply divides the last result by the interval duration in seconds to get the average bandwidth utilization in bits per second.
The main limitation of this technology is that it only gives average utilization. This means that you could be measuring the traffic on an interface that is used at full capacity during half of the interval and not used at all during the other half and it would show up as used at 50%.
About Flow Analysis
Originally invented to simplify the creation of router access control lists, Cisco’s engineers quickly realized that the NetFlow technology could be put to better use by exporting flow data to a device with the ability to further analyze that information.
Without going too technical, let’s just say that NetFlow uses a three-component architecture. The exporter component runs on the monitored device. It aggregates packets into flows, and exports flow records to a flow collector. The flow collector component handles the reception, storage and pre-processing of the flow data. Finally, the flow analyzer component is used to analyze the flow data. Today, most systems combine the collector and analyzer in one device.
INTERESTING READ: NetFlow and SNMP: Differences and Best Tools for Monitoring
The Best Quantitative Router Traffic Monitoring Tools
The following tools are a few of the very best you can find. They all use SNMP to poll routers and read their interfaces traffic counters to build graphs depicting the evolution of interface bandwidth utilization over time. But while they all offer the same core functionality, they differ in their feature set. Picking the best one is, more than anything, a matter of matching your specific needs to each product’s features.
1. SolarWinds Network Performance Monitor (FREE TRIAL)
The SolarWinds name is well-known to many network administrators. The company makes some of the best network and system administration tools an many of them have received rave reviews and are considered among the very best in their respective fields. SolarWinds is also famous for its free tools, smaller tools that each address a specific need of network administrators. Two good examples of those free tools are the Advanced Subnet Calculator and the Kiwi Syslog Server.
For monitoring routers, SolarWinds proposes the Network Performance Monitor (NPM). It is primarily an SNMP bandwidth monitoring tool but it also offers comprehensive fault monitoring and performance management and it is compatible with most routers. It also comes with many advanced features such as its NetPath feature which lets you view the critical network path between any two monitored points on your network or the ability to automatically generate intelligent network maps.

The tool’s Network Insights functionality allows for complex device monitoring. It can monitor Software Defined Networks (SDN) and also has built-in Cisco ACI support as well the ability to monitor wireless networks and to generate network performance baselines. Other interesting features of the NPM include advanced alerting and its PerfStack performance analysis dashboard. The SolarWinds Network Performance Monitor is a highly scalable tool that can be used on any network from the smallest to the largest.
The SolarWinds Network Performance Monitor’s pricing structure is quite simple. Licensing is based on the number of monitored elements. Five licensing tiers are available for 100, 250, 500, 2000, and unlimited elements at prices ranging from $2 955 to $32 525, including the first year of maintenance. If you’d rather give the tool a trial run before committing to a purchase, a free 30-day trial version can be obtained.
2. PRTG Network Monitor
The PRTG Network Monitor from Paessler AG is another great product. It is, at its base, an SNMP monitoring tool. However, thanks to a concept called sensors—a type of functionality plug-ins that are already built into the product—additional metrics can be monitored. There are about two hundred sensors available with the product. Installation speed is another strength of the product. According to Paessler, you can set it up in a couple of minutes. While it may not be that fast, it is indeed faster than most competitor’s thanks in part to the tool’s auto-discovery engine.
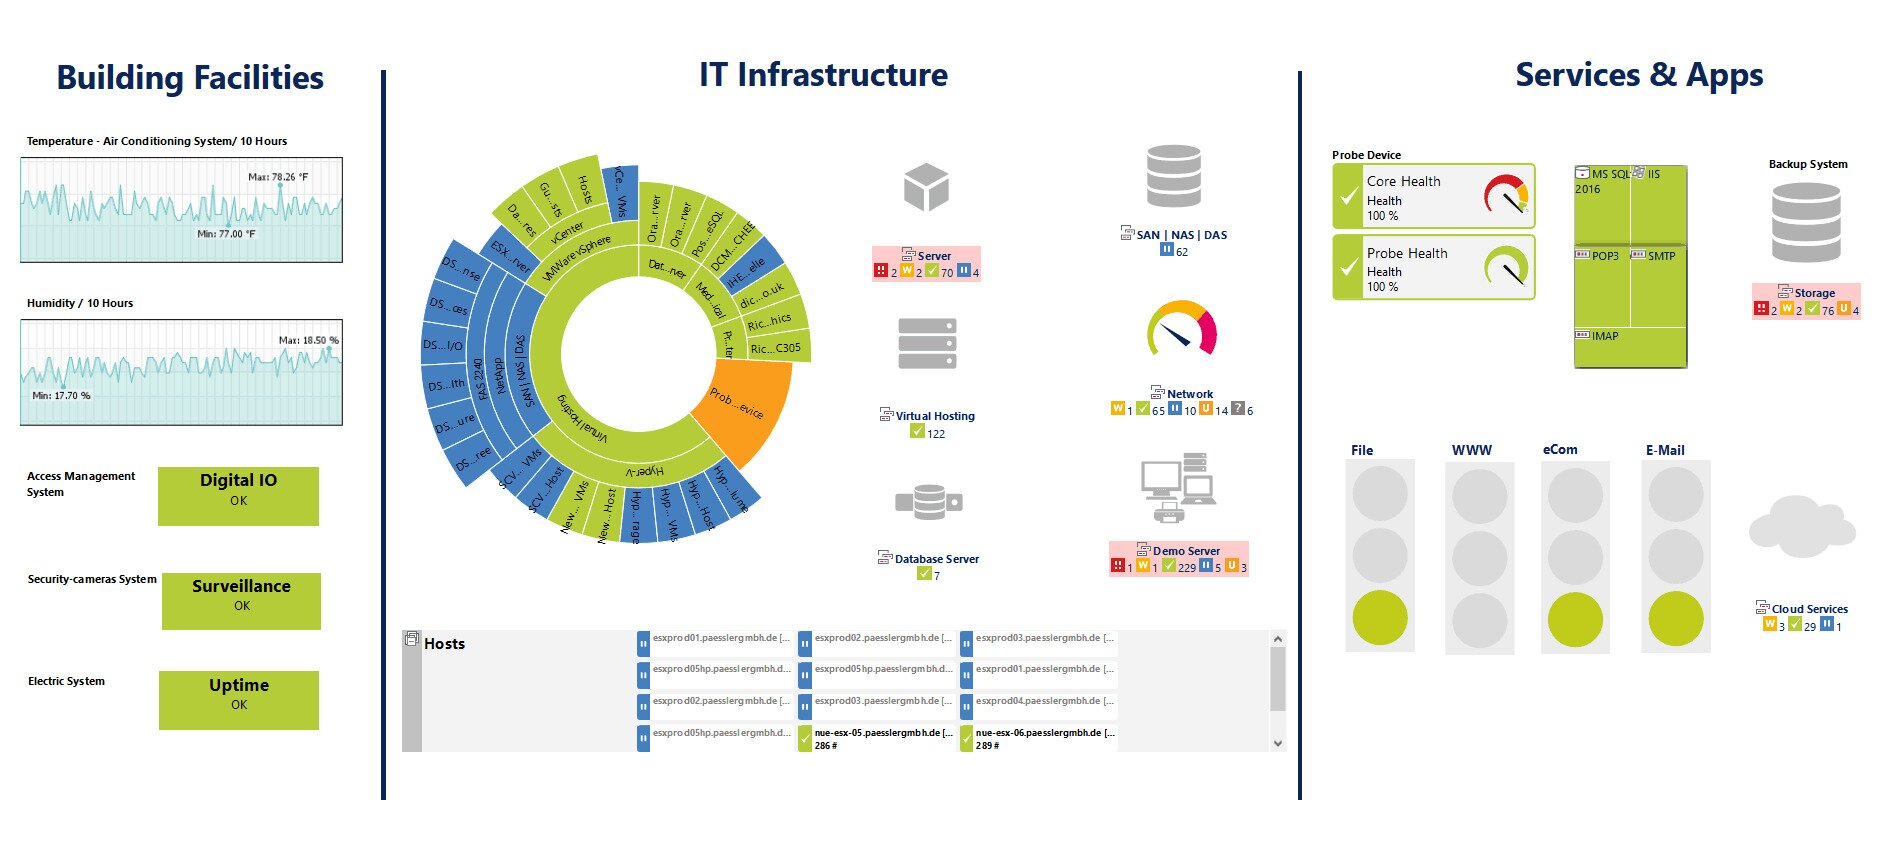
The PRTG Network Monitor is a feature-rich product that lets you choose between a native Windows enterprise console, an Ajax-based web interface and mobile apps for Android and iOS. Alerting and reporting are excellent and the product boasts a wide range of reports that can be viewed as HTML or PDF or exported to CSV or XML to be processed externally.
The PRTG Network Monitor is available in a free version which is limited to monitoring no more than 100 sensors. Each parameter you want to monitor counts as one sensor. For example, monitoring bandwidth on each interface of a 4-port router will use up 4 sensors and monitoring the CPU and memory on that same router will use up 2 more. Each additional sensor you install also counts. For more than 100 sensors—which you will most likely need—you’ll need a license. Their prices start at $1 600 for up to 500 sensors, including the first year of maintenance. A free 30-day trial version is also available.
3. ManageEngine OpManager
The ManageEngine OpManager is a complete management solution that addresses most—if not all—monitoring needs. The tool, which can run on either Windows or Linux, is loaded with great features. For instance, its auto-discovery feature doesn’t just add devices to the tool. It can graphically map your network, giving you a uniquely customized dashboard.
The tool’s dashboard is one of its best assets. It is super easy to use and navigate and has drill-down functionality. And If you’re into mobile apps, they are available for tablets and smartphones and will give you access from anywhere.
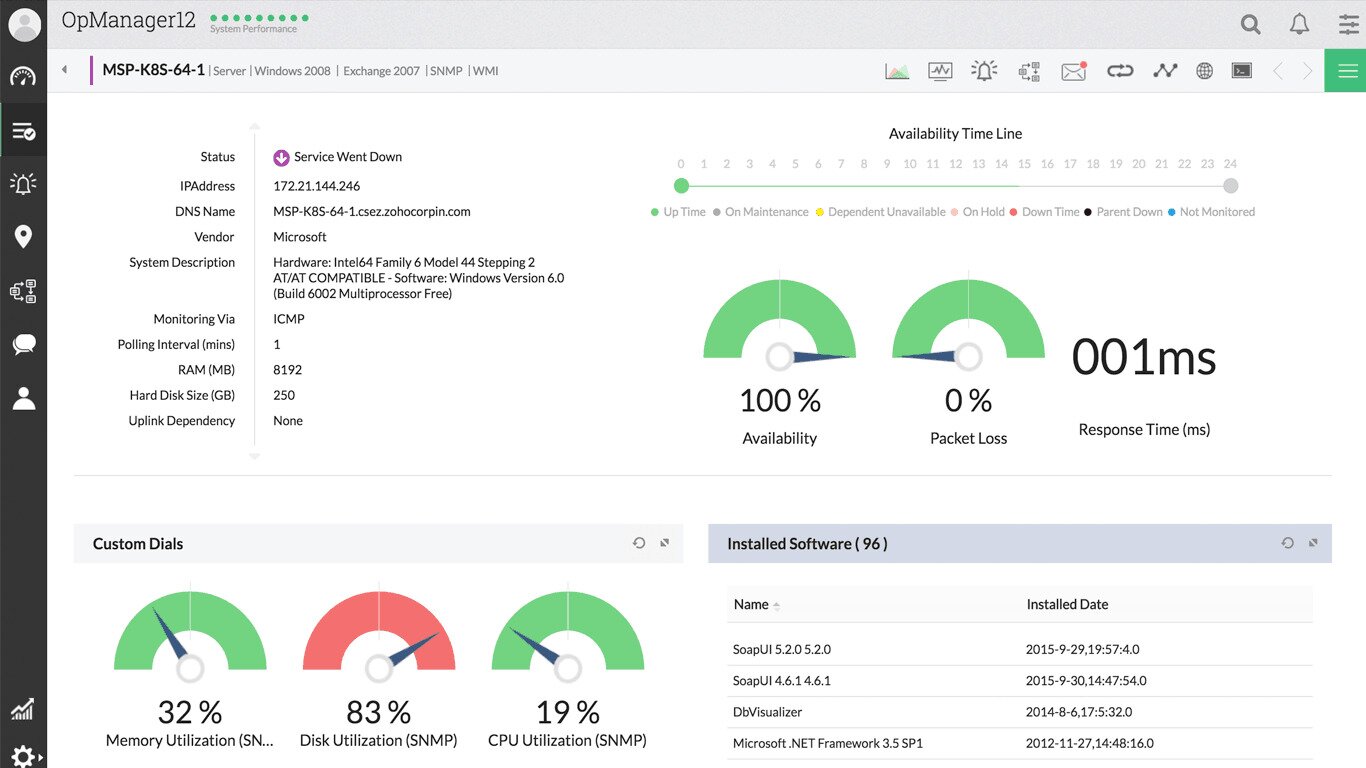
Alerting in the ManageEngine OpManager is another of the product’s strengths. It’s got a full complement of threshold-based alerts that can help detect, identify, and troubleshoot networking issues. Furthermore, multiple thresholds each with their own notifications can be set for every performance metric.
If you want to try the ManageEngine OpManager, get the free version. It is not a time-limited trial version. It is, instead, feature-limited. It won’t, for instance, let you monitor more than ten devices. While this might be sufficient for testing purposes, it will only suit the smallest networks. For more devices, you can choose between the Essential or the Enterprise plans. The first will let you monitor up to 1 000 nodes while the other goes up to 10 000. Pricing information is available by contacting ManageEngine’s sales.
4. Cacti
Our list wouldn’t have been complete without at least one free and open-source router monitoring tool. This is why we’re introducing Cacti, a proven solution that has been around for many years and is still in widespread use and actively developed. It is a very polished product with a great web-based user interface that makes configuring it very simple and intuitive. It is a complete network graphing package which uses RRDTool, a data logging and graphing tool from Tobi Oetiker who also brought us MRTG, the granddaddy of network bandwidth monitoring tools. Cacti’s main components are a fast poller, advanced graph templates, several acquisition methods, and user management features. It is just as good for smaller LAN installations as ts is for complex networks with thousands of devices over multiple sites.
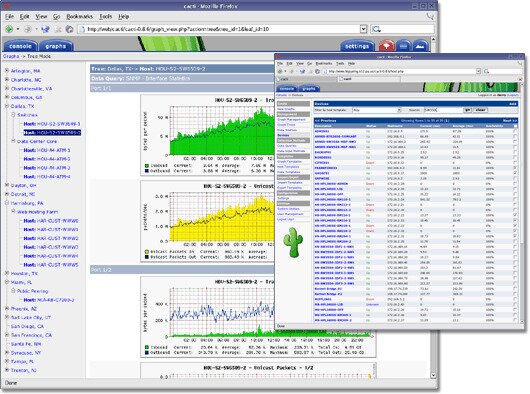
To better describe Cacti, let’s talk about RRDtool for a moment. According to its developer “RRDtool is the OpenSource industry standard, high-performance data logging and graphing system for time series data. RRDtool can be easily integrated into shell scripts, Perl, Python, Ruby, Lua or Tcl applications.” RRDtool is a direct descendant of MRTG.
In a nutshell, Cacti is a GUI frontend to RRDTool. It stores the necessary data to create graphs and populate them with data in a MySQL database. The tool lets you maintain Graphs, Data Sources, and Round Robin Archives in a database and also handles the data gathering.
The Best Qualitative Network Traffic Monitoring Tools
For a qualitative view of your network traffic—if you care more about the what than the how much, you need flow analysis tools. They provide much more details on the router traffic and will typically include views such as top talkers, top protocols or top users.
1. SolarWinds NetFlow Traffic Analyzer (FREE TRIAL)
The SolarWinds NetFlow Traffic Analyzer can monitor network usage by application, protocol, and IP address group. It will monitor NetFlow devices and also J-Flow, sFlow, NetStream, and IPFIX. The tool collects flow data, arranges it into a usable and meaningful format and presents it to users in a web-based interface. It can be used to identify which applications and categories consume the most bandwidth.

Among the product’s best features, the SolarWinds NetFlow Traffic Analyzer can monitor router usage by application, protocol, or IP address group. It can also handle Cisco NetFlow, Juniper J-Flow, sFlow, Huawei NetStream, and IETF-standard IPFIX flow data to identify which applications, protocols, or users are the top bandwidth consumers. The tool will collect traffic data, correlating it into a usable format, and presenting it to the user in a web-based interface for monitoring network traffic. It also identifies which applications and categories consume the most bandwidth for better network traffic visibility.
The SolarWinds NetFlow Traffic Analyzer is an add-on to the Network Performance Monitor, SolarWinds’ flagship product described earlier. You can save by acquiring both at the same time as the SolarWinds Network Bandwidth Analyzer Pack. Prices for the bundle start at $4 910 for monitoring up to 100 elements and vary according to the number of monitored devices. While this may seem a bit expensive, keep in mind that you’re getting not one but two of the best monitoring tools available. If you’d prefer to try the product before purchasing it, a free 30-day trial can be downloaded from SolarWinds.
2. Scrutinizer
Scrutinizer from Plixer is not just a flow analysis system. It has the ability to monitor different flow types such as NetFlow, J-flow, NetStream, and IPFIX so you’re not limited in what routers you’ll be able to monitor. The tool offers efficient data collection and can easily scale up to many million flows per second. It can work in physical and in virtual environments and includes some advanced reporting features.
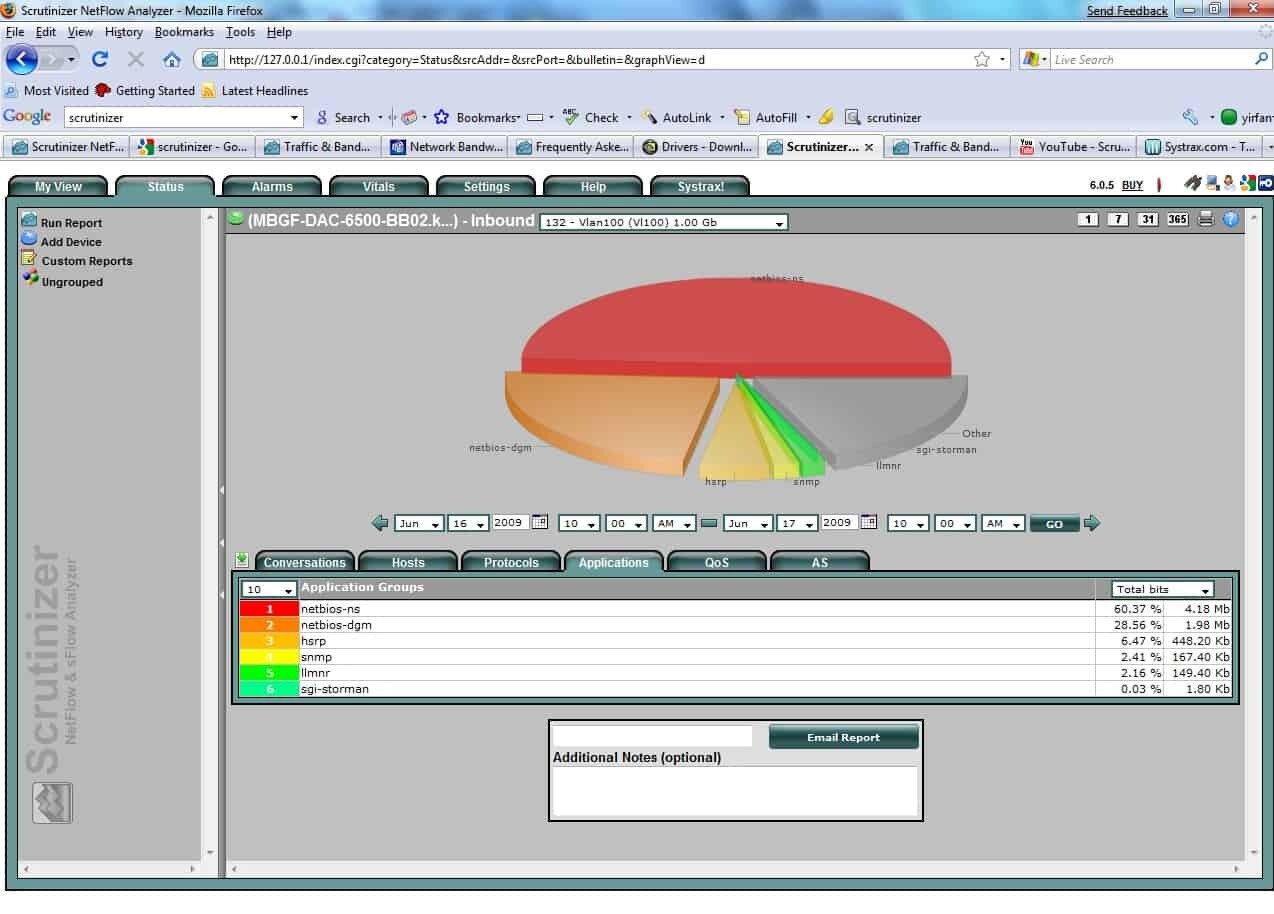
Scrutinizer is available in several versions from the basic free version to the full-fledged “SCR” level which can scale up to over 10 million flows per second while the free one is limited to 10 thousand flows per second and will only keep raw flow data for 5 hours. It could, however, be enough to troubleshoot network issues. A free 30-day trial of all paid versions is available. After the trial period is over, the product reverts back to the free version.
3. ManageEngine NetFlow Analyzer
Last on our list is another tool from ManageEngine simply called the NetFlow Analyzer. It’s got a web-based interface that offers a great many different views on your network. You’ll be able to view traffic by application, by conversation, by protocol, and several more options. The tool will also let you set alerts. One could, for instance, set a traffic threshold on a specific router interface and be alerted whenever traffic exceeds it.
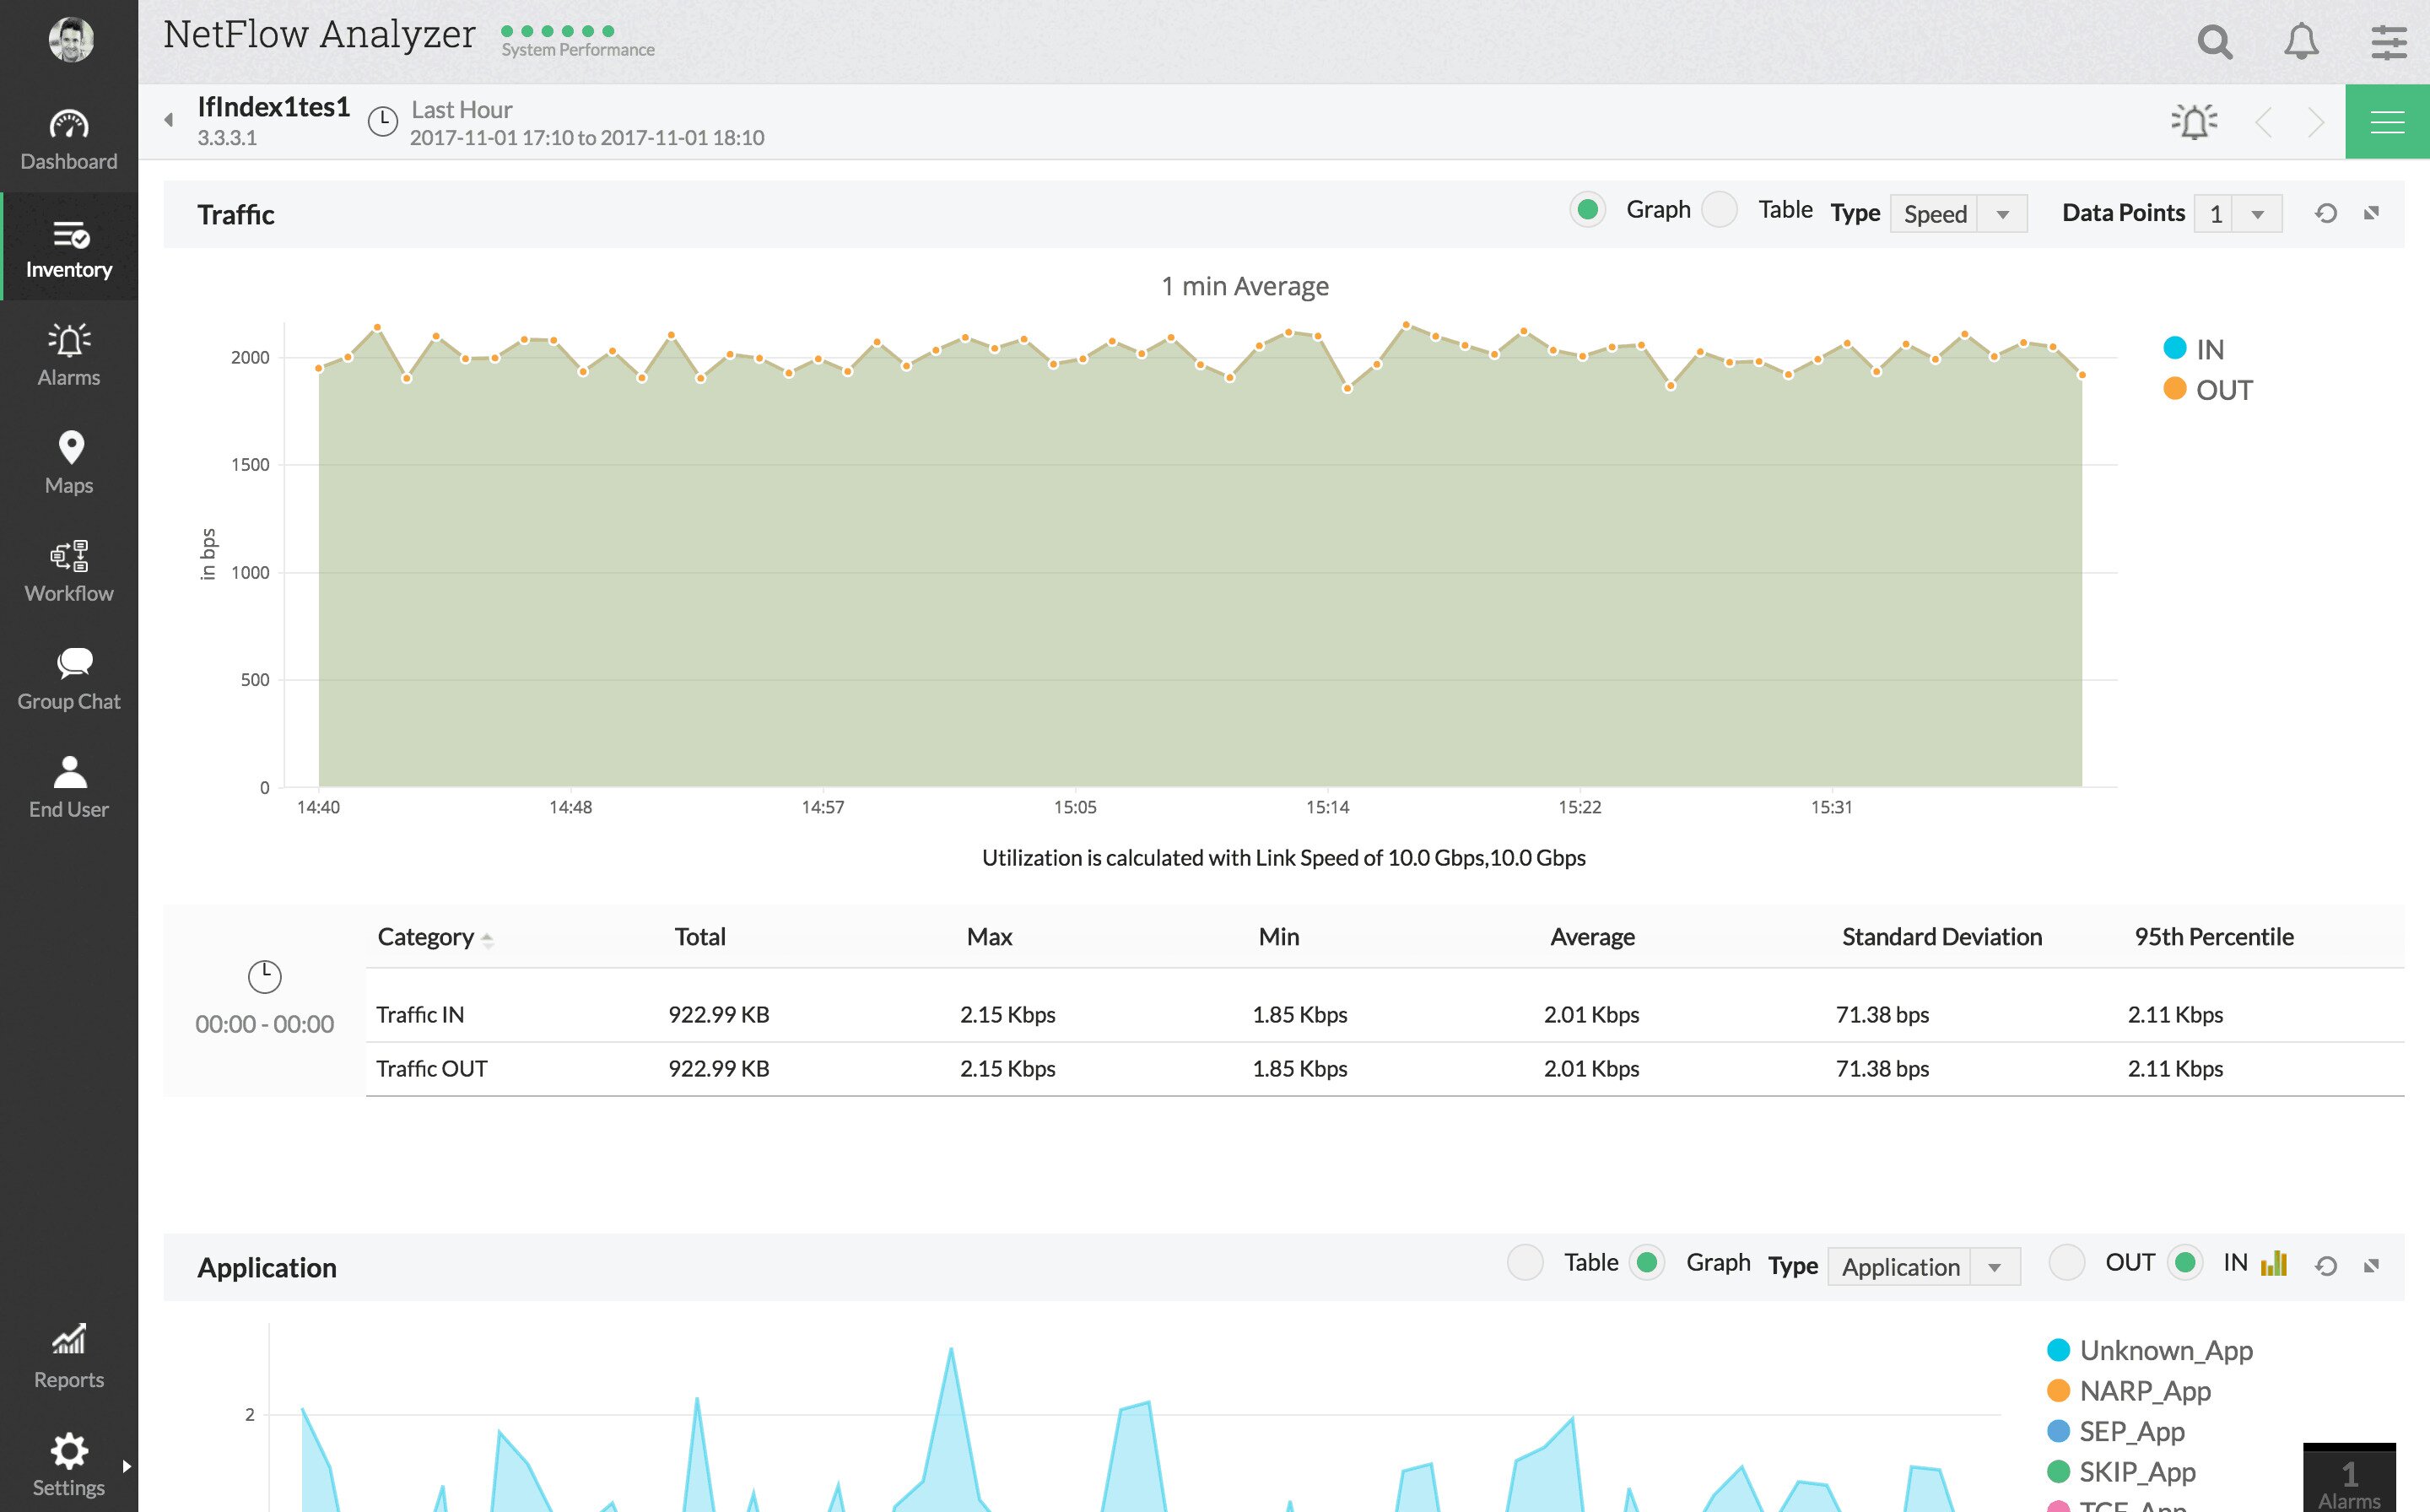
The ManageEngine NetFlow Analyzer’s dashboard includes several pie charts displaying top applications, top protocols or top conversations. It can also display a map with the status of the monitored interfaces. Dashboards and reports can be customized at will to include all the information that you need. The tool’s dashboard is also where alerts are displayed in the form of pop-ups. A smartphone client app will let you access the dashboard and reports from anywhere.
The ManageEngine NetFlow Analyzer supports most flow technologies including NetFlow, IPFIX, J-flow, NetStream and a few others. It is available in two versions. The free version is identical to the paid one for the first 30 days but it then reverts to monitoring only two interfaces or flows. For the paid version, licenses are available in several sizes from 100 to 2 500 interfaces or flows.