

Top 5 Open-Source SNMP Monitoring Tools
SNMP, which is built into virtually every networking device is by far the best way to go about monitoring bandwidth usage. Some of the best SNMP monitoring tools, however, can turn out to be rather expensive. Luckily, there are several free and open-source solutions available and we’re about to review a few of the best ones.

We’d all love to benefit from infinite network bandwidth, wouldn’t we? But the reality of very different. Most of the time, we have to do with the bare minimum as bandwidth is still quite expensive. Consequently, networks often suffer from congestion and other problems linked to insufficient bandwidth. At the same time, applications are handling more and more data and need to move it through the network. This puts an additional toll on network bandwidth. To stay out of trouble, you need to keep a close eye on your network and the evolution of its usage and one of the best ways of doing that is to use a bandwidth monitoring tool.
We’ll begin by discussing network monitoring. We’ll briefly explain what it is and the different types of monitoring that are typically available. We’ll then dig deeper into the Simple Network Management Protocol (SNMP) and tell you what’s important to know about it, how it works, and how monitoring tools use it to measure — or rather calculate — network bandwidth utilization. And once we’re all on the same page, we’ll get into the core of this post and review some of the best open-sou
rce SNMP monitoring tools. While some are quite rudimentary, others are very polished and professional tools.
About Bandwidth Monitoring
For a network administrator, congestion is the number one enemy. If you compare a network to a highway where traffic is the network’s data, network congestion is similar to traffic jams. But unlike automobile traffic—where congestion can easily be spotted by simply looking at the road—network traffic happens within cables, switches, and routers where it’s invisible. Furthermore, it all happens at blazing speeds. Even if it was visible, it would happen too fast for us to see it. This is why network monitoring tools are so important. They provide network administrators with the visibility they need to ensure things are running smoothly. They can identify congestion or other issues, allowing administrators to take the necessary measures to address the situation.
Another important benefit of network bandwidth monitoring tools is with capacity planning. There is no way around the fact that network usage always grows over time. Just like disk space, the more you have, the more you need. While the current bandwidth of your network might be sufficient now, it will eventually need to be increased. By monitoring bandwidth usage, you’ll be able to plan the bandwidth upgrade before over-utilization becomes a problem.
Different Ways Of Monitoring Bandwidth
There are several ways that can network utilization can be monitored. One way is to capture packets at a given point on the network. It will give you detailed visibility over what’s happening at this particular point but nowhere else. Another way, if your networking equipment supports it, is to have it send out flow data to a flow analyzer that will report on what users, devices, or applications are using the network. Finally, and this is often the preferred way of doing it, you can use SNMP—which, as we said, is built into almost every networking device—to periodically poll devices and read their interface counters which they use to calculate and graph bandwidth utilization. Let’s briefly examine how each type of monitoring works.
Packet Capture
Packet capture is mostly used to troubleshoot specific network issues once you’re aware of them but it’s rarely used for usage monitoring. With packet capture, every data packet in and/or out of a specific device’s interface is captured and decoded. So, while it’s clear that packet capture tools are an invaluable tool for network administrators, they are not the best to just keep an eye on things to ensure all is running smoothly.
Flow Analysis
Cisco Network’s NetFlow technology is and its multiple variants such as J-flow, IPFIX, or sFlow, is a network flow analysis system. Devices that support flow analysis collect information about each data flow—hence the name—which they then sent to a flow collector and analyzer. It gives you detailed qualitative information about your network’s utilization but, if all you want is to monitor bandwidth utilization, it might be more than you need. And if you factor in the efforts required to put it in place, you’ll quickly realize it might not be the best tool for this specific task.
SNMP
The Simple Network Management Protocol (SNMP) is a complex—despite its somewhat misleading name—system that can be used to remotely monitor, configure and control many different types of networking equipment. Fortunately, you don’t have to know everything about SNMP to use it to monitor a network’s bandwidth utilization. For now, let’s just state that SNMP is used by monitoring tools to read a device’s interface counters and use that data to compute the bandwidth usage and graph its evolution over time. In the next section, we’ll go into more details the inner workings of the Simple Network Management Protocol, ensuring you have enough information to configure and use any SNMP network monitoring tool.
SNMP In A Nutshell
Many SNMP tutorials will be rather technical tell you about MIBs and OIDs. We don’t feel, however, that you have to know everything about SNMP to use it. It’s somewhat like a car. You don’t have to know all about how the engine works to drive one. So, our goal today is to give you just enough information so that you can understand, use, and configure SNMP network monitoring tools, not to make you an SNMP expert, which is something that will come with experience.
First things first, how does one connect and authenticate to an SNMP-enabled device? It is very simple albeit not very secure. On each SNMP device, parameters called community strings are set. You can think of community strings as SNMP passwords. There are typically two community strings configured on each device. One of them is used for read-only access while the other will let one modify some parameters. They can have any value you want and their respective defaults are often set to “public” and “private”. While this is a simple and efficient authentication scheme, it is not secure at all as the community strings are transmitted in clear text over the network and could be intercepted and compromised. This is one reason why many administrators don’t configure read/write community strings on the devices they manage.
So, let’s say that an SNMP network monitoring system connects to a network device using the read-only community string. There are many different operational parameters that can be remotely read. Of particular interest when it comes to bandwidth monitoring are a few metrics called interface byte counters. There’s a pair of them—one for input and one for output—for each network interface. They are simply incremented by the device as bits are received and transmitted on an interface. By reading these values periodically at know intervals—every five minutes is typical, the monitoring tool can compute the number of bits per unit of time–usually per second–which is exactly how bandwidth is expressed.
Concretely, here’s how it’s done: The monitoring tool will poll a device and read its counters. Then, five minutes later, it will read the same counters again. By subtracting the previous value of the counters from the current one, the total number of bytes transferred in and out over the past five minutes is obtained. It is then a simple matter to multiply these numbers by 8–the number of bits in a byte–then divide the results by 300–the number of seconds in five minutes–to get the bits per second bandwidth utilization figures. Those figures are typically stored in some sort of database and used to plot graphs of utilization over time.
A few other SNMP values can be of interest in network monitoring. For example, there are interface input and output error counters. Similar to what’s being done with bytes in and out, these values can be used to compute the number of errors per second, a figure that tells you a lot about the general health of a network link. Other interesting metrics include CPU and memory utilization gauges.
The Best Open-Source SNMP Monitoring Tools
The SNMP monitoring tools market is huge. Big players such as SolarWinds, Paessler A.G. and ManageEngine all have some excellent product to offer. But what about open-source tools? Well, there are probably even more open-source tools than there are commercial ones. In fact, MRTG, the first tool on our list, is likely the ancestor of every other monitoring tool and it is still available today. So, let’s see what the best tools are.
1. MRTG
As we just said, the Multi Router Traffic Grapher, or MRTG, can almost be considered the granddaddy of SNMP monitoring tools. Still in widespread usage, it’s been around since 1995. There’s a reason for this longevity: it gets the job done and it is a totally free and open-source platform. Of course, it might not be the fanciest and the prettiest and its user interface shows signs of age but it’s possibly the most flexible tool. MRTG can monitor many parameters besides bandwidth. In fact, it can monitor, log, and graph any SNMP parameter, and more. While it might not be the most user-friendly monitoring system, it is still possibly the most flexible one. And the fact that it’s the first monitoring system and that it is still around is certainly a testament to its value.
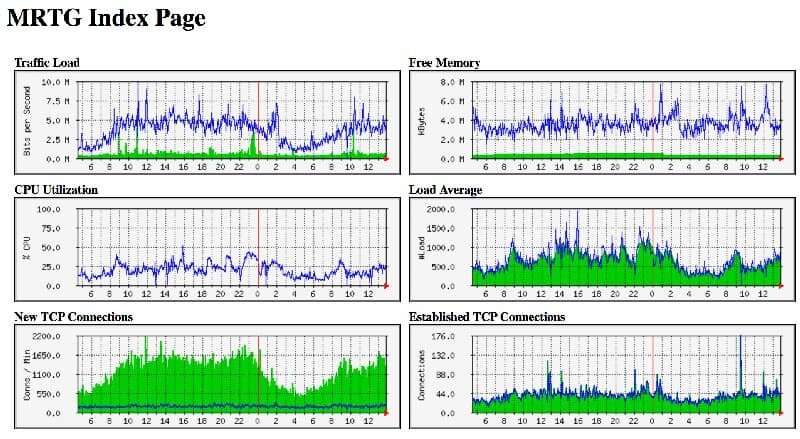
The two main components of MRTG are a Perl script that reads SNMP data from target devices and a C program that takes the data, stores it in a round-robin database and create web pages with bandwidth utilization graphs. The fact that the bulk of the system is written in Perl and is open-source means that anyone can customize the software to their specific needs. The initial setup and configuration might be somewhat more complicated than what you’d experience with some more polished monitoring systems but documentation is readily available to assist you.
Installing MRTG requires that you first install and configure Perl. It won’t run without it. MRTG can be run as a Windows service instead of an application but doing so requires some advanced manipulations including some registry modifications. Once installed, MRTG is configured by editing its configuration file in a true old-style *nix way. Administrators used to GUI configuration could face a steep learning curve. MRTG is best downloaded directly from its developer’s website. It is available as a .zip file for windows or a tarball for Linux. As of this writing, the latest stable release is 2.17.7, released last July. The tool is still in active development with a few minor releases each year.
2. Cacti
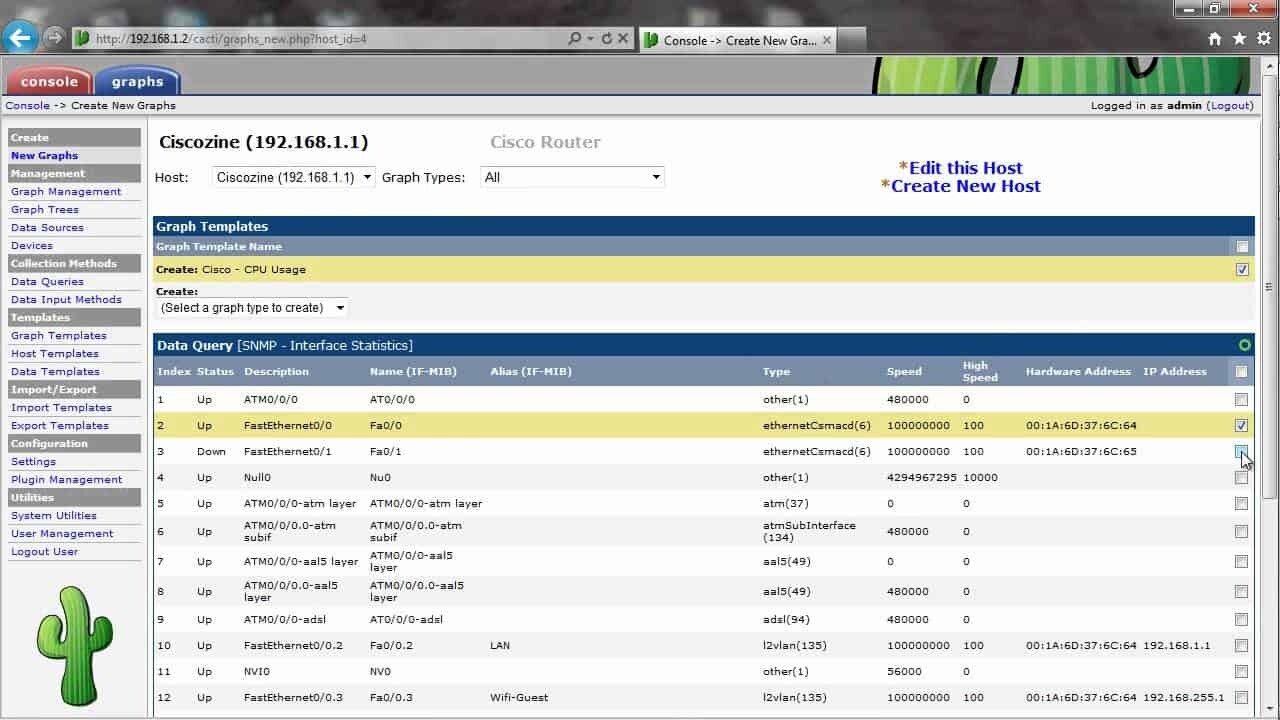
You can think of Cacti as MRTG on steroids. If you look at any of Cati’s graphs, you’ll find a striking resemblance to MRTG’s. This is no surprise as Cacti is built upon RRDTools which is from the same developer and is a direct descendant of MRTG. More about that in a moment.
Cacti is more polished than MRTG with a web-based configuration interface that makes configuring it much easier and more intuitive. It is a complete network monitoring and graphing package. The tool features a fast poller, some advanced device and graph templates, several acquisition methods, and user management features. It is excellent for smaller LAN installations but it will easily scale up to complex networks with thousands of devices over multiple sites.
To better understand Cacti, you need to know more about RRDtool. According to its developer “RRDtool is an open-source industry standard, high-performance data logging and graphing system for time series data. RRDtool can be easily integrated into shell scripts, Perl, Python, Ruby, Lua or Tcl applications.” If you recall how we said that MRTG uses a C program for data storage and graphing, RRDTool is the evolution of that C program.
In a nutshell, Cacti is just a front end to RRDTool. It stores the necessary data to create graphs and populate them with data in a MySQL database. The software maintains its graphs, data sources, and round robin archives in a database and also handles the data gathering, leaving the graphing to RRDTool. Cacti is a step up from MRTG. Many Cacti users are former MRTG users. I, for instance, got into Cacti when I needed to replace MRTG with something that was easier to configure and use as the network I was managing kept growing.
3. LibreNMS
LibreNMS is an open-source port of Observium, a very potent commercial network monitoring platform. It is a fully featured network monitoring system that provides a wealth of features and device support. Among its best features is its auto-discovery engine. It doesn’t only rely on SNMP to discover devices. It can automatically discover your entire network using CDP, FDP, LLDP, OSPF, BGP, SNMP and ARP. Talking about the tool’s automation features, it also has automatic updates so it will always stay current.
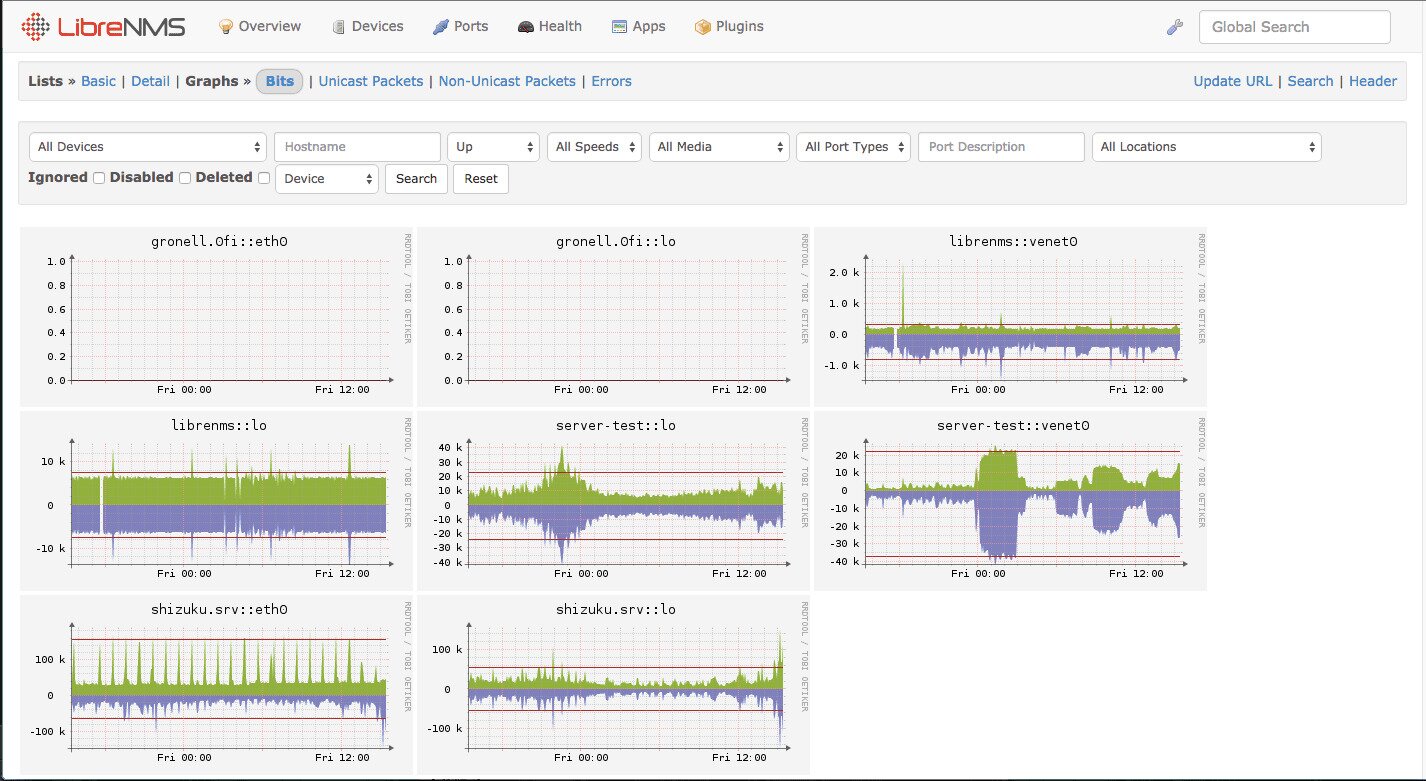
Another major feature of the product is its highly customizable alerting module. It is very flexible and it can sed alert notifications using multiple technologies such as email, like most of its competitors but also IRC, slack, and more. If you’re a service provider or your organization bills back each department for their use of the network, you’ll appreciate the tool’s billing feature. It can generate bandwidth bills for segments of a network based on usage or transfer.
For larger networks and for distributed organizations, the distributed polling features of LibreNMS allow for horizontal scaling to grow with your network. A full API is also included, allowing one to manage, graph, and retrieve data from their installation. Finally, mobile apps for iPhone and Android are available, a rather unique feature with open-source tools.
4. Icinga
Icinga is yet another open source monitoring platform. It has a simple and clean user interface and, more importantly, a feature set that rivals some commercial products. Like most bandwidth monitoring systems, this one uses SNMP to gather bandwidth utilization data from network devices. But one of the areas where Icinga particularly stands out is its use of plugins. There are thousands of community-developed plugins that can perform various monitoring tasks, thereby extending the product’s functionality. And in the unlikely event that you couldn’t find the right plugin for your needs, you can write one yourself and contribute it to the community.
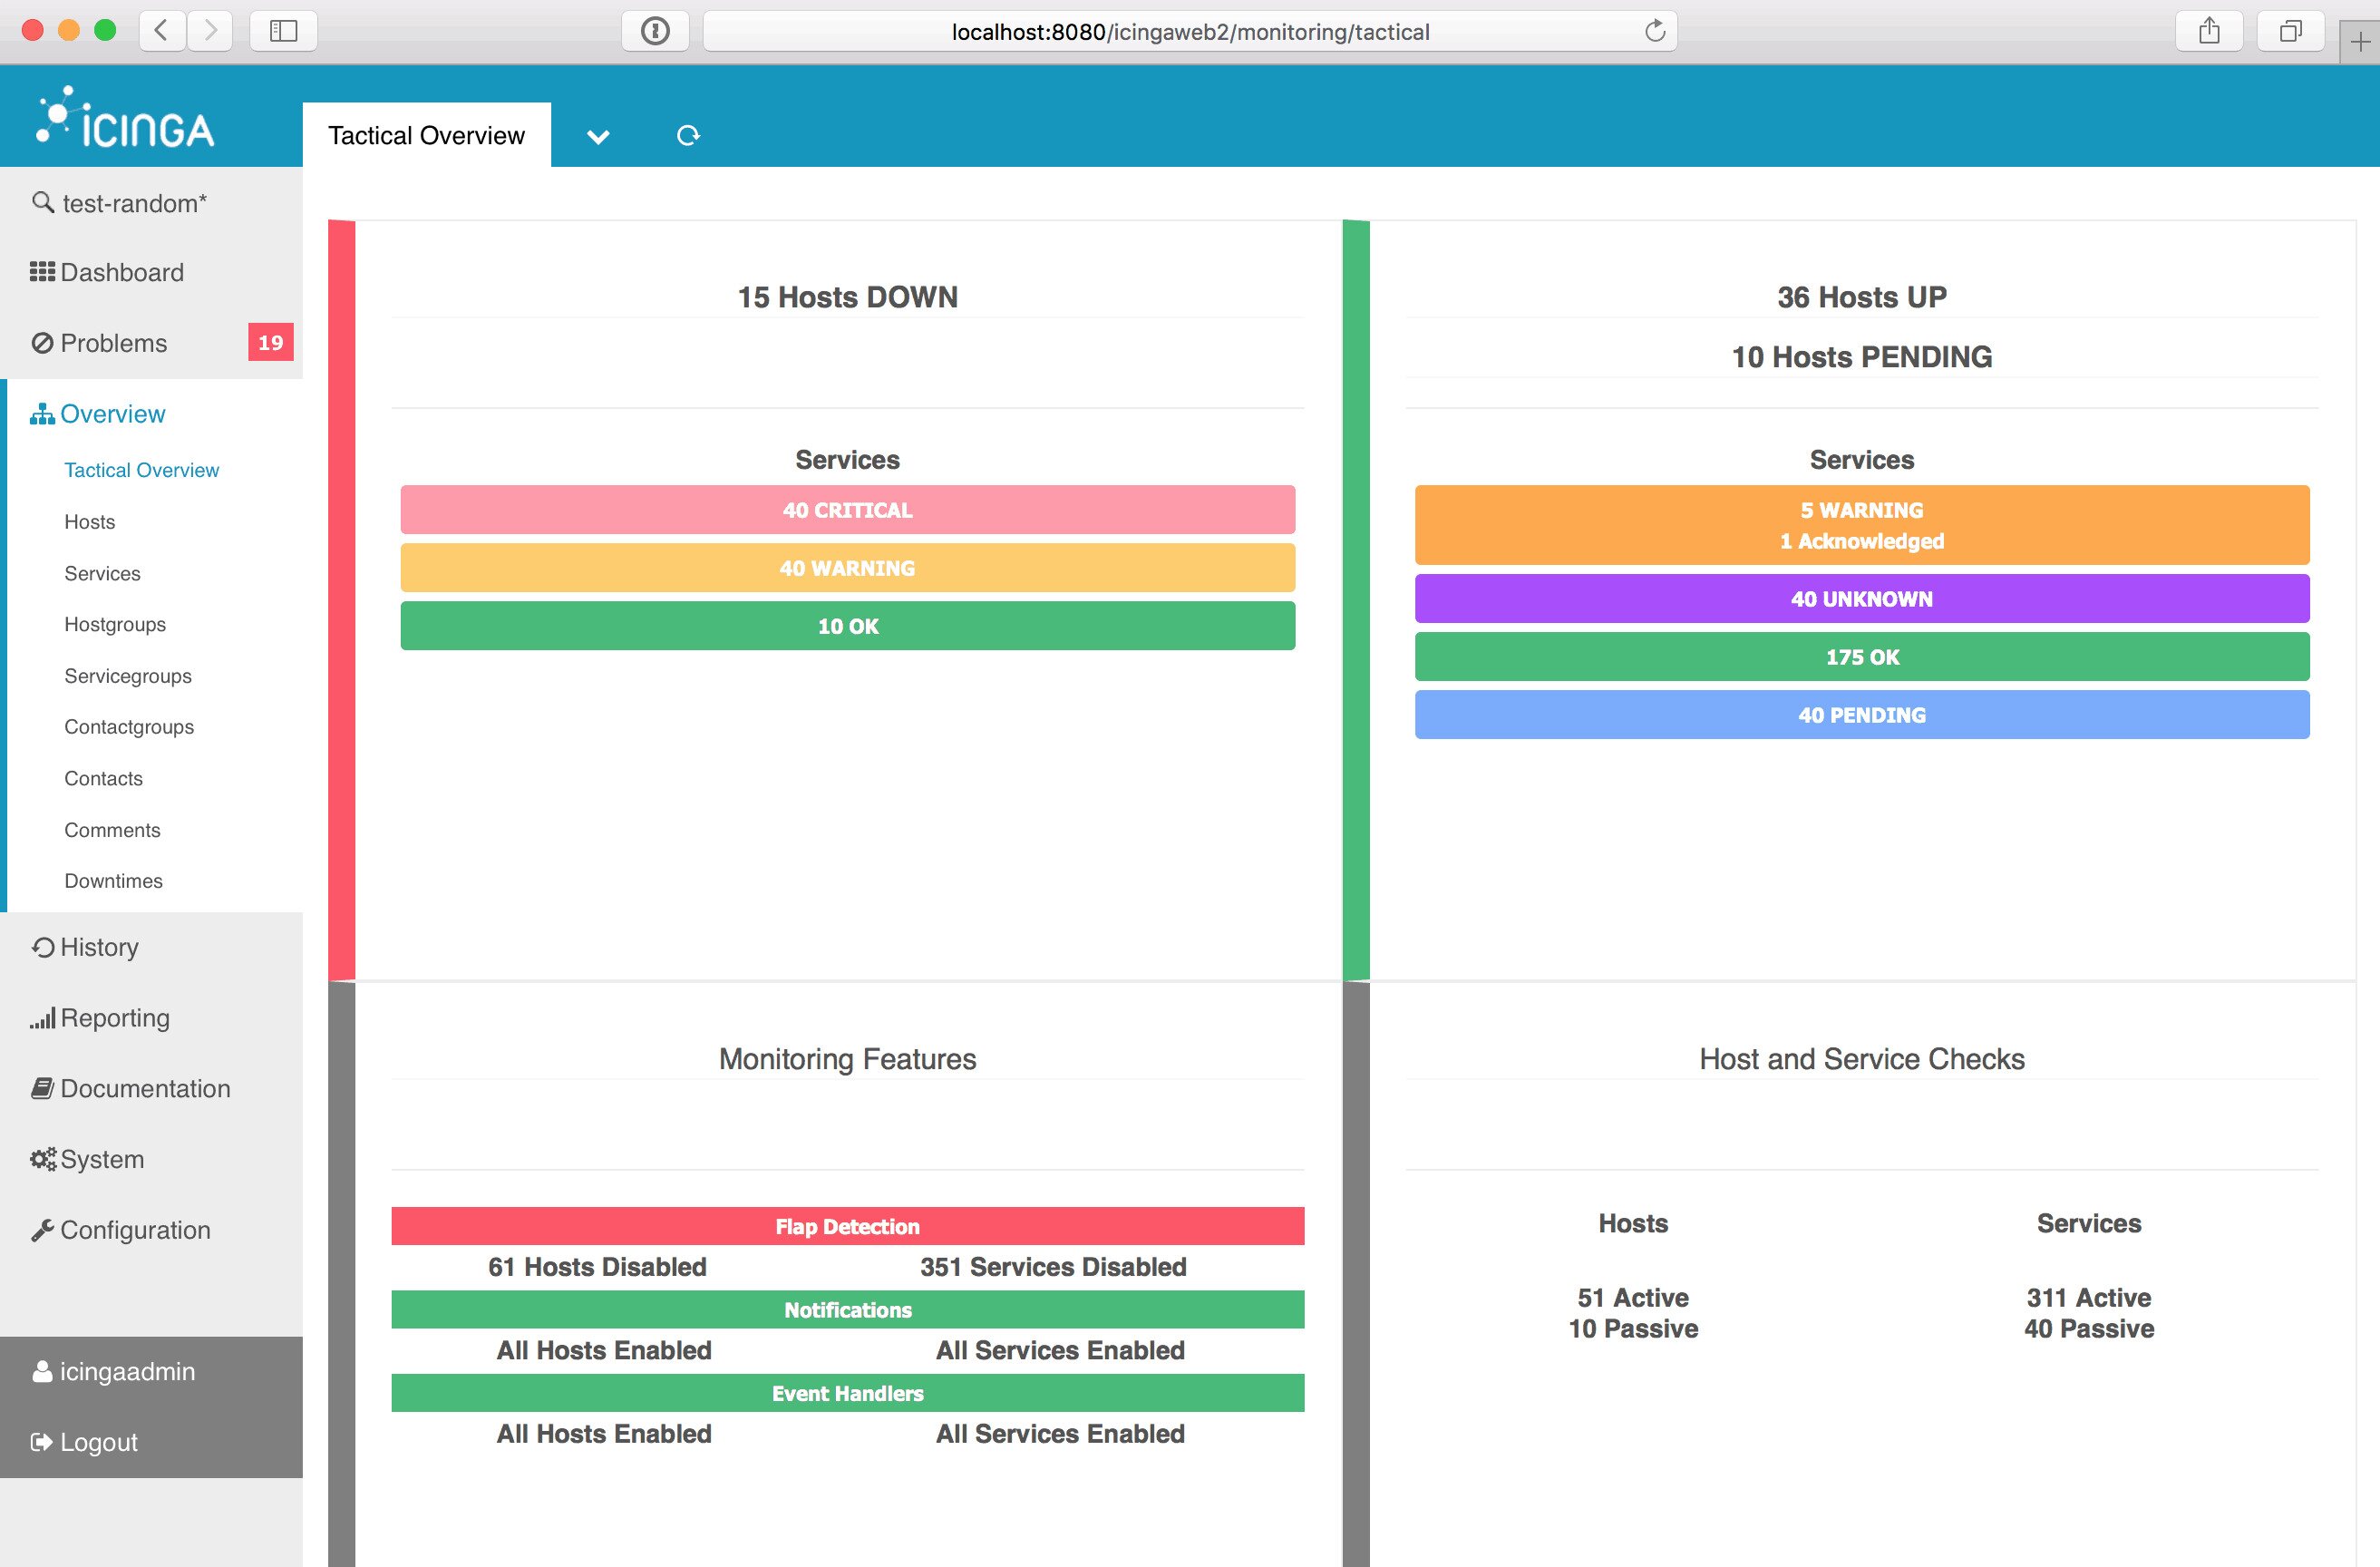
Alerting and notification also among Icinga’s great features. Alerts are fully configurable in terms of what triggers them and how they are transmitted. The tool also features what is referred to as segmented alerting. This feature will let one send some alerts to one group of users and other alerts to different people. This is nice to have when you monitor different systems managed by different teams. It can ensure that alerts are transmitted only to the proper group to address them.
5. Zabbix
Zabbix is another free and open-source product but it has has a highly professional look and feel, much like you’d expect from a commercial product. But the good looks of its user interface are not its only assets. The product also has an impressive feature set. It will monitor most network-attached devices in addition to networking equipment. It would be an excellent choice for anyone in need of monitoring servers in addition to network bandwidth utilization.
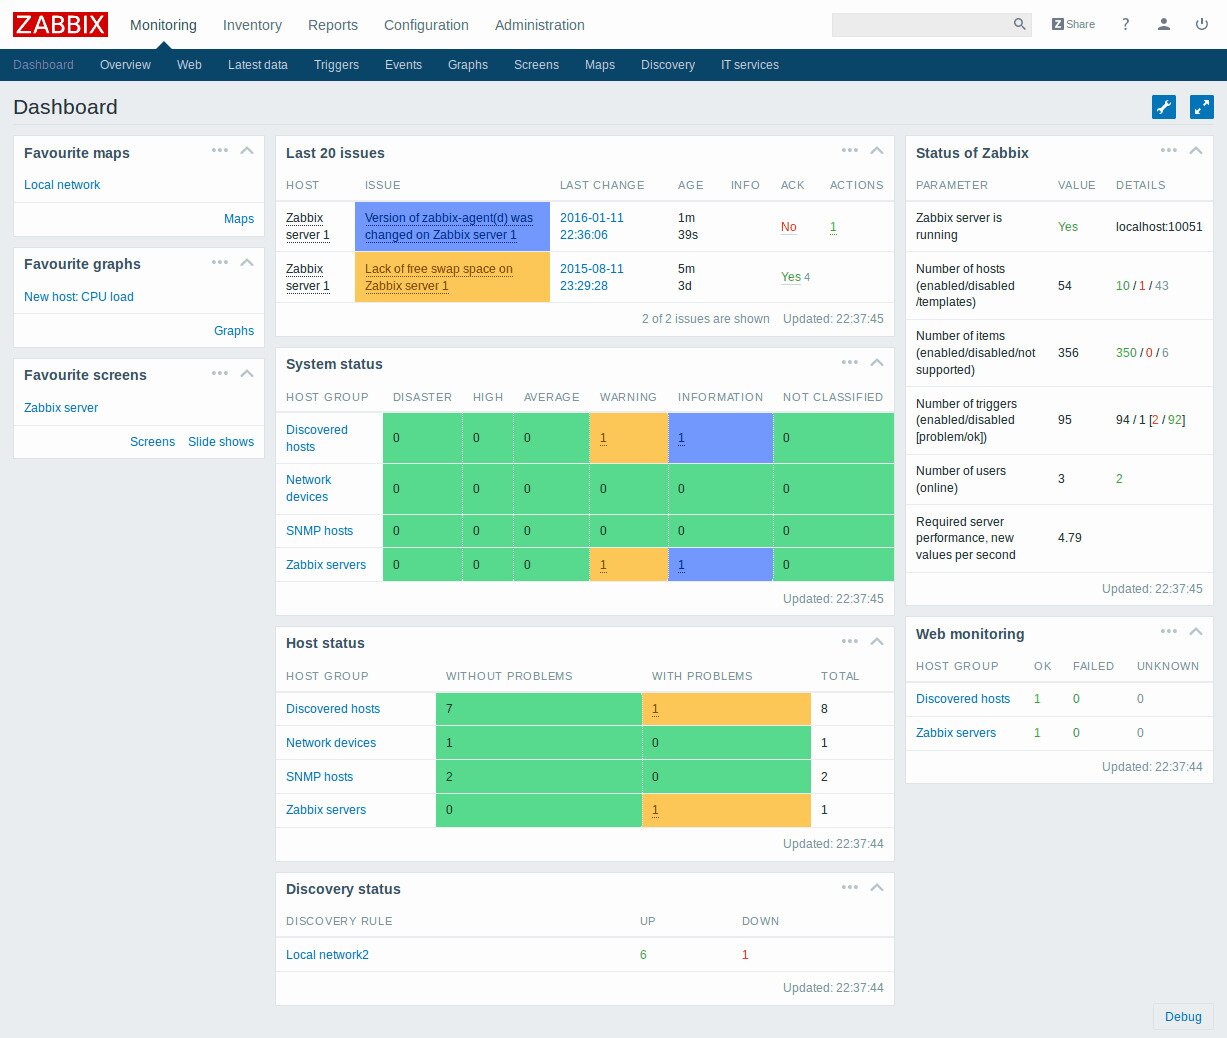
Zabbix uses SNMP as well as the Intelligent Platform Monitoring Interface (IMPI) for monitoring devices. You can use the software to monitor bandwidth, device CPU and memory utilization, general device health and performance as well as configuration changes, a rather unique feature within this list. This tool does way more than simple network bandwidth utilization monitoring. It also features an impressive and completely customizable alerting system which will not only send email or SMS alerts but also run local scripts which could be used to fix some issues automatically.