

5 Best SNMP Network Monitoring Software Tools
The quality of a craftsman’s work is often determined by the tools he uses, and this principle applies to nearly every field, including network administration. Thankfully, network administrators are equipped with a plethora of superior tools to assist them in various tasks. One such task is monitoring, for which a wide range of tools are available. Among these tools are NetFlow Analyzers and S-FLow Analyzers, which provide administrators with a comprehensive view of the data flowing through their network.
However, our focus today is on a different kind of monitoring – SNMP network monitoring. SNMP, or Simple Network Management Protocol, is a communication protocol that allows monitoring tools to read operational metrics from network equipment and other devices such as servers.
In our quest to find the best SNMP monitoring software tools on the market, we have identified five top contenders. These include SolarWinds Network Performance Monitor, ManageEngine OpManager, Paessler Router Traffic Grapher (PRTG), and Zabbix. We will be reviewing these tools to help you make an informed decision..

Before we reveal our top SNMP network monitoring tools, we’ll spend a little time explaining what SNMP is and how it works. This is by no means a technical paper so we’ll try to keep our explanations as non-technical as possible. Our idea is just to give you the big picture so you can better understand how network monitoring tools operate. We’ll look at SNMP specifically in the context of monitoring networks. After all, isn’t that what this article is all about? And when we’re done with the theory, we’ll review the five best SNMP Monitoring software tools for networks.
An SNMP Primer
Many texts about SNMP make it look like a hugely complex matter. There’s a reason to that. It is. But just like you don’t have to be a mechanic to drive a car, you don’t have to be an SNMP expert to configure a monitoring tool, much less to understand and compare their features. But in reality, it’s not that complex. At least not in the context of network monitoring. Let’s shed some light on the subject.
The SNMP protocol is primarily used as a way for external devices–which we’ll call SNMP managers for lack of a better term–to read information from and write information to SNMP-enabled devices. Such devices–which could be networking equipment like switches and routers or other network-attached devices like servers or appliances–make a certain number of parameters available either in read-only or in read-write mode. For example. an SNMP-enabled printer would have read-only parameters for the level of its ink cartridges or the total number of pages printed. Similarly, an SNMP-enabled server would have CPU utilization, available disk space, or system temperature. The SNMP manager communicates with the SNMP-enable device using get requests to read parameters and set requests to write them.
MIBs and OIDs
The MIB, or Management Information Base, is a special type of text file which identifies each parameter of a given device. Each SNMP-enabled device has a corresponding MIB. It doesn’t mean that each and every device has an individual one, though. For example, there’s a MIB for Cisco switches that covers most models. A MIB contains a hierarchical list of all the available SNMP parameters for that device. A typical MIB entry looks like this:
Iso(1).org(3).dod(6).internet(1).private(4).transition(868).products(2).chassis(4).card(1).slotCps(2).-cpsSlotSummary(1).cpsModuleTable(1).cpsModuleEntry(1).cpsModuleModel(3).3562.3
You can think of each dot-separated element as one level in the hierarchy, just like directories on a storage device tree structure. A MIB file will often contain hundreds of these entries, one for each parameter. Did you notice the numbers in parenthesis next to each text value? They can be used to simplify the communication between managers and clients. A manager would use the string 1.3.6.1.4.868.2.4.1.2.1.1.1.3.3562.3 to refer to our example parameter. This makes for smaller requests that use less bandwidth. By the way, these strings–no matter if they use text or just numbers–are called OIDs or Object Identifiers.
Now, for any SNMP manager to be able to get or set parameters in an SNMP-enabled device, it needs to have access to that device’s MIB file. Most SNMP management or monitoring software already has all the standardized MIBs and often some of the popular ones from the major manufacturers built-in. If you need to access some device-specific OID that’s not included in the software’s built-in MIBs, you’ll need to add the proper MIB. This is often just a matter of downloading the MIB file from the equipment manufacturer’s website and copying it to the MIB directory of your software.
SNMP was first created back in 1988, much before there were any serious threats on the Internet and certainly before network security was a big concern. For that reason, there is not much security built into the protocol. SNMP does not use encryption and uses a very crude authentication mechanism. Each SNMP request sent by a manager includes a community string. You can think of it as a rudimentary password. The community string in the request must, of course, match that of the target device. As for SNMP enabled devices, administrators can configure two different types of community strings: read-only and read-write. By default, many devices used to have public as their read-only community string and private as their read-write one. Some still do. This tells you a lot about how security is not a priority with SNMP.
Using SNMP for Network Monitoring
When using SNMP for network monitoring, only a handful of OIDs is of interest. They are of two types that I like to call gauges and counters. Gauge-type OIDs are used for things like processor utilization or percentage of free memory. Counter-type OIDs are used to count bytes in and out of a device’s interfaces or to count interface input and output errors. SNMP-enabled networking equipment has one such set of gauge-type OIDs per interface.
A typical SNMP monitoring tool will read the value of relevant OIDs at regular, predefined–often five minutes–intervals. For gauge-type OIDs, it will usually store the value in some sort of database and likely display it on its dashboard in either numerical or graphical form. Some tools will graph the evolution of the parameter over time.
For counter-type OIDs, things are more complicated. Since the number of bytes in and out of an interface is not an interesting metric, instead of using it as is, it is used to compute the interface’s bandwidth utilization in bits per second. Likewise, the error rate in errors per second is a much more interesting parameter than just the cumulative number of errors.
Here’s how it works. The SNMP monitoring tool reads the value of the counter at the same regular interval of five minutes. It stores the value in its database but, instead of displaying it as is, it does some math with it. It will first subtract the previous value of the counter from the current one to get the number of bytes transmitted–or received–in the last five minutes. It will then multiply that number by eight–the number of bits in a byte–and divide it by three hundred–the number of seconds in five minutes–to get the average bandwidth utilization in the past five minutes. This is the value that the tool will display or plot on a graph.
An important point here is that what you get out of this is average utilization. Imagine a 100 Mbps interface. In the five minutes between samples, the traffic level could have been at 100 Mbps for 150 seconds and at 0 for 150 seconds and it would display an average traffic of 50 Mbps although the interface was maxed out for half of the five minutes. This is a shortcoming of every SNMP monitoring software that you need to be aware of.
The Best SNMP Network Monitoring Software — Our Top 5
There are many SNMP monitoring software tools available on the market. So many that picking one can be a daunting task. In order to make it somewhat easier, we’ve assembled this list of the best five SNMP monitoring software tools we could find. Some are commercial software and some are free and open-source. Each commercial tool we’ve reviewed has a free trial available so you are free to try any or all of our suggestions.
1. SolarWinds Network Performance Monitor (Free Trial)
First on our list is an excellent tool from SolarWinds: the Network Performance Monitor, or NPM. SolarWinds, in case you don’t know, makes some of the best software tools for network administration and management. The company is also well-known for its free tools, some of which have been reviewed as we recently discussed the best free TFTP servers or the best free SCP servers.

The Network Performance Monitor is a feature-rich professional SNMP monitoring system. It boasts an easy to use web-based dashboard, it is easy to set up and configure and, more importantly, it does a great job. The tool has customizable alerting features that can notify you whenever specific metrics exceed a predefined value.
This tool can build intelligent maps of your network and will show you the critical path between any two points, allowing you to quickly troubleshoot issues. There’s also wireless network monitoring and management built right into the software. This software truly has too many features to be able to mention them all here. Take advantage of the 30-day free trial to see for yourself what this great tool can do for you.
Pricing for the SolarWinds Network Performance Monitor starts at $1,785 and varies according to the number of monitored devices. The software is highly scalable and adding more devices than its current capacity is just a matter of upgrading the license.
2. ManageEngine OpManager
ManageEngine is another one of the top makers or network administration tools. OpManager is one of its best products. The software is available for Windows or Linux and is packed full of great features. One of its most significant is the device auto-discovery that doesn’t just find devices but also map your network, giving you a unique graphical dashboard. And talking about the dashboard, it is both intuitive and easy to use with drill-down functionality. For mobile device users, there are also mobile client apps available for iOS and Android.
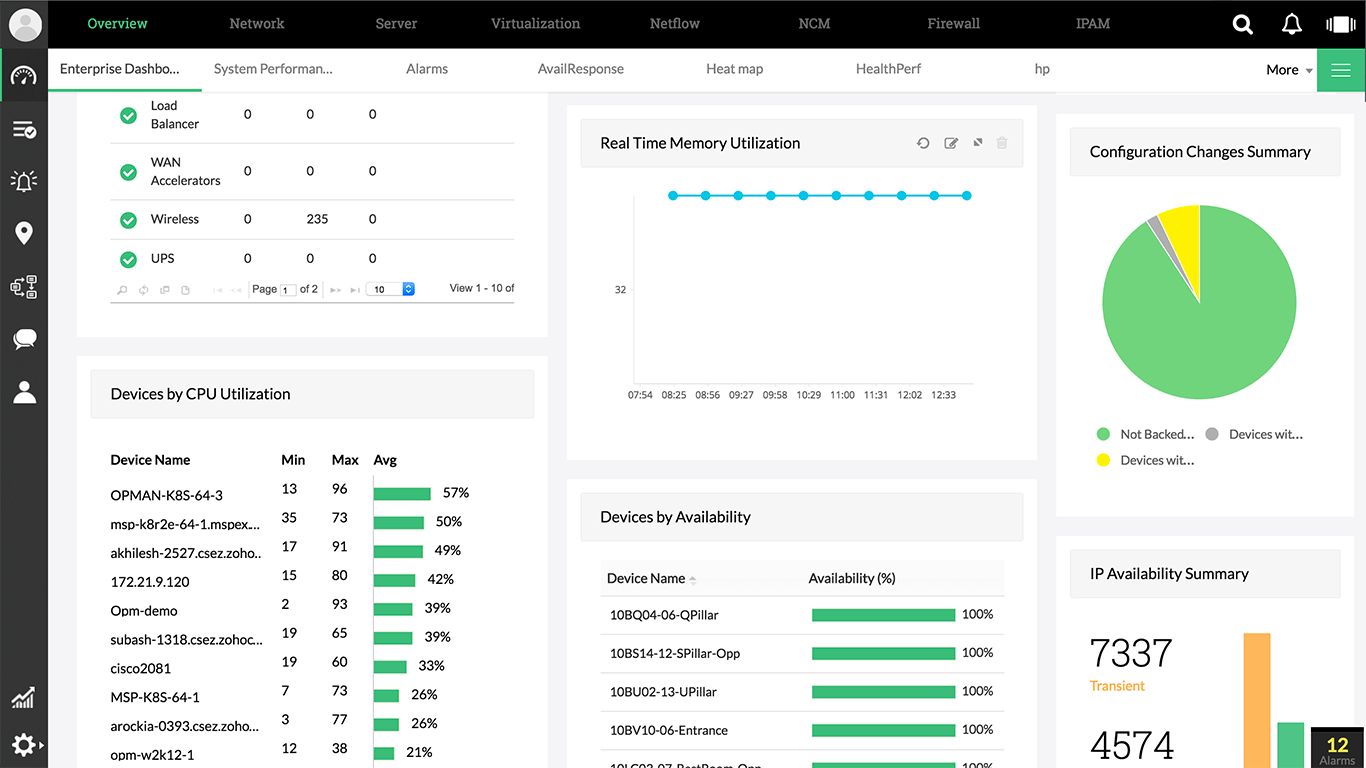
When it comes to alerting, the ManageEngine OpManager leaves nothing to be desired. There’s a vast array of threshold-based alerts that can assist you in detecting, identifying, and troubleshooting network issues. Alerts and notifications of this SNMP monitoring software are highly customizable and you can set easily multiple thresholds with various notifications for every metric.
The ManageEngine OpManager is available in three versions: Free, Essential, or Enterprise. The Free version is limited to monitoring up to 10 devices and has a reduced feature set. The Essential version will let you monitor up to 1,000 nodes with a price starting at $715 for 25 devices. As for the Enterprise version, it can monitor up to 10,000 devices with a price starting at $19 795 for 500 devices.
3. PRTG
The Paessler Router Traffic Grapher, or PRTG, claims to be the fastest monitoring tool to set up. According to its manufacturer, you could be up and running within a couple of minutes. In reality, it could take a bit more time than that but it’s still one of the fastest and easiest SNMP monitoring tools to install and configure. The product comes with several user interfaces to interact with it. There’s a Windows enterprise console, an Ajax-based web interface as well as mobile apps for Android and iOS.
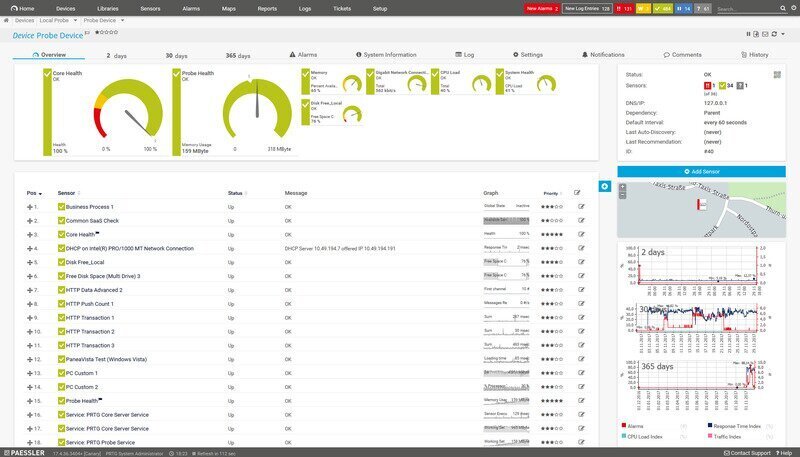
This SNMP monitoring software tool has device auto-discovery that will not only detect devices but also create sensors for them based on predefined templates. PRTG’s alerts and notifications are just as good as it’s competitors’. Alerts can be transmitted as push notifications to the mobile client apps, a pretty unique feature. This, of course, is in addition to more “standard” alerting such as email or SMS.
PRTG’s basic accounting unit is the sensor which is any parameter or metric you need to monitor. It is available in a full-featured free version which is limited to monitoring 100 sensors. If you need more, paid licenses can be purchased. Their prices vary according to sensor capacity from $1 600 for 500 sensors to $14 500 for unlimited sensors.
4. Zabbix
Zabbix claims to be the ultimate enterprise-class monitoring platform. And it possibly is, especially when compared to other free and open-source tools. Given its price, Zabbix is indeed hard to beat. It can use SNMP to monitor network devices but also local or cloud-based servers. It will let you monitor multiple metrics such as bandwidth, CPU and memory utilization, device health in general as well as configuration changes, a rather unique feature.
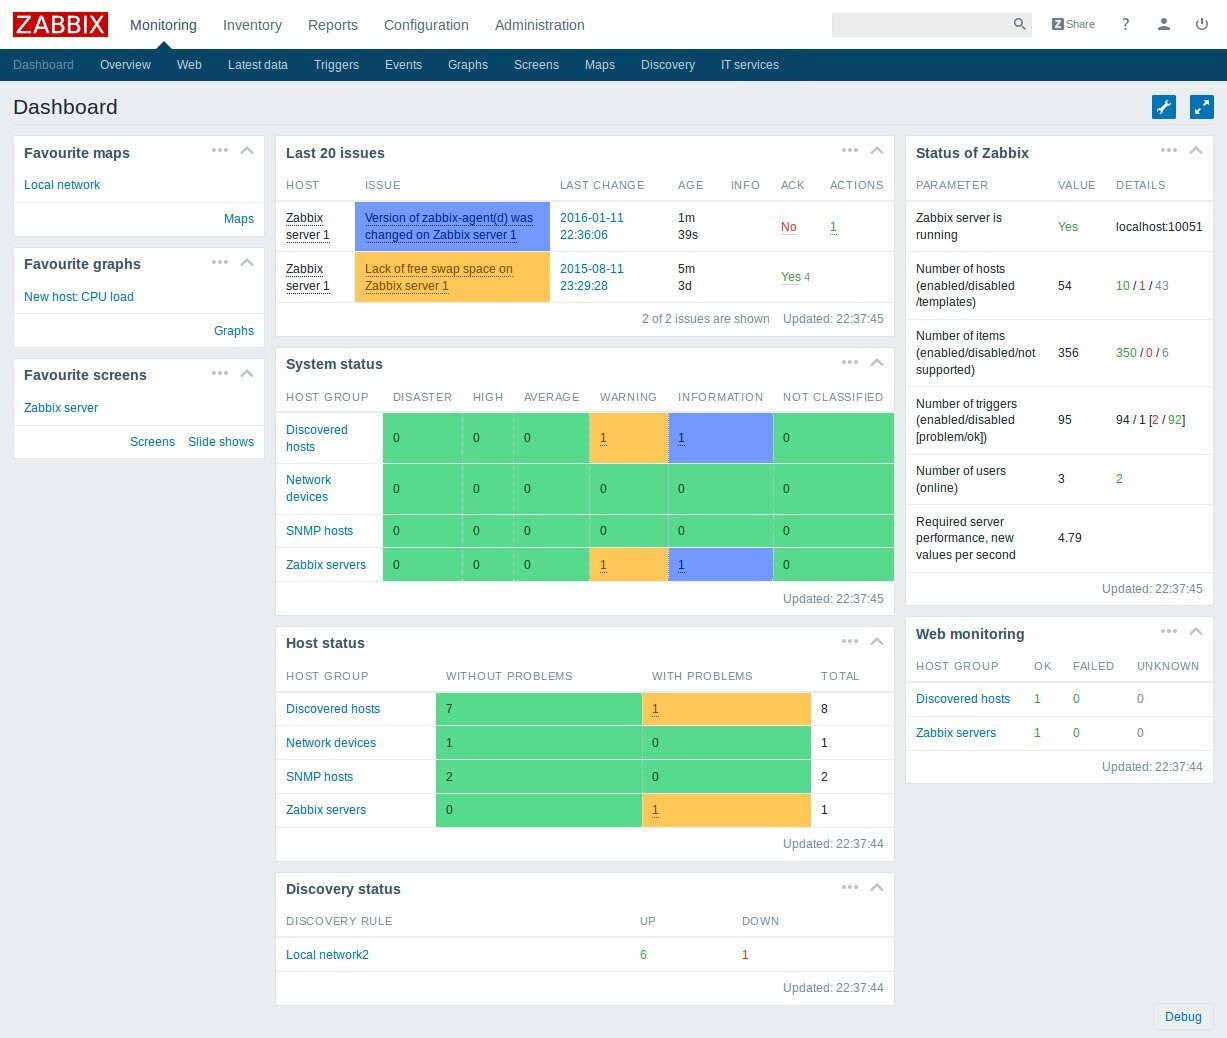
The software features an easy to understand and use web-based interface and an impressive feature set. It compares very well to commercial products costing thousands of dollars more. Its alerting system is possibly among the best on the market with the ability to run local scripts in response to alerts triggered by monitoring events.
Zabbix itself is free but various services can be purchased from the publisher. These include technical support which is available in five levels and a complete training and certification program with classes throughout the world. Community support is also available for free.
5. Cacti
The last product on the list of the best SNMP monitoring software is the well-known Cacti. Despite a few shortcomings, it is likely the most-used and one of the oldest free and open-source monitoring platform. It is certainly not as feature-rich as some commercial products but it’s still an excellent tool. Its web-based user interface is quite easy to use despite its somewhat antiquated look. At its core, Cati has a fast poller, advanced graphing templates, and multiple acquisition methods. It will typically use SNMP polling but custom scripts can be devised to get data from virtually any source and plot it on Cacti’s graphs. User accounts can be used to limit access to a subset of devices for some users, a useful feature in large organizations with multiple support groups. And talking about large organizations, the product can scale very well from small business networks to large installations of thousands of devices over multiple sites.
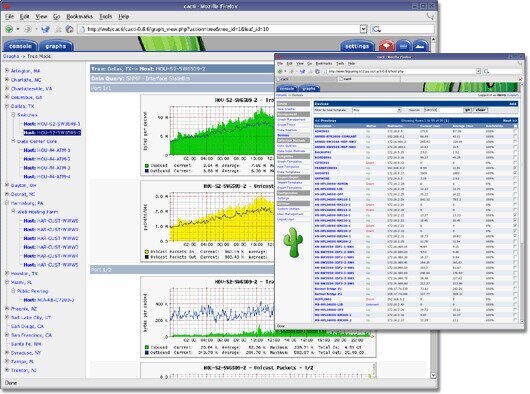
However, this SNMP monitoring software is not perfect. In fact, it’s missing one important component, alerting. Cacti’s strength is in polling devices and graphing the data on web pages. It’s very good at that but that’s all it will do. On the other hand, Cacti is written in PHP and is open-source so nothing stops you from writing some code to add some functionality. And if you don’t need alerting, Cacti’s simplicity might be just what you need. It is hugely customizable and you can easily adapt it to our specific needs.
Cati makes extensive use of templates to facilitate configuration. There are device templates for many common types of devices as well as graph templates. There’s a huge online community that writes custom templates for many devices and equipment manufacturers sometimes have Cacti templates that you can download.
A Special Mention
Although it might not deserve to be on this list, I’d like to give an honorable mention to the Multi Router Traffic Grapher, or MRTG, which is the ancestor of all SNMP monitoring systems. Its developers were the first to use SNMP for monitoring rather than managing equipment. Some of MRTG’s original code is still used today in Cacti and possibly several other open-source tools.
Conclusion
SolarWinds Network Performance Monitor stands out as the Best SNMP Monitoring Software among the top 4 options. While all these tools have their merits, SolarWinds NPM offers an impressive array of features, including an easy-to-use web-based dashboard, customizable alerting, intelligent network mapping, and wireless network monitoring. Its 30-day free trial allows users to experience its capabilities firsthand. While other tools like ManageEngine OpManager, PRTG, Zabbix, and Cacti have their strengths, SolarWinds NPM shines as the top choice for SNMP network monitoring tool.