

10 Best Tools For Monitoring Local Area Networks
Monitoring local area networks, or LANs, in one of the most important tasks of any network administrator. Monitoring allows one to verify that all is running smoothly. But monitoring is not just a matter of looking at the network, at least not with the naked eye. Network traffic happens at a subatomic level within electrical or optical conductors. And it’s not only small, it’s also blazingly fast. So, to monitor LANs, you need the proper tools. The good thing about this is that there are lots of tools available. On the other hand, the main drawback is that there are lots of tools available. Having so many tools to choose from can turn what should be a simple selection process into a terrible ordeal. We’ve done the initial work of weeding out what available and we’re glad to present the ten best tools for monitoring local area networks.

Before revealing what out top ten tools are, we’ll sidetrack briefly to discuss network monitoring. We’ll do our best to explain what it is and its benefits are. And if you’re of the curious type, we’ll also talk about how it works. Knowing how a tool works often makes it easier to choose the one that best suits your needs. And finally, we’ll reveal what the ten best tools are. For each one, we’ve done a mini review of its most important features.
The Benefits Of Network Monitoring Tools
Other than just knowing what’s going on with our networks, monitoring tools have several benefits. For instance, they are an invaluable troubleshooting tool. Its, not uncommon for such tools to be deployed in such a way that every single segment of a local area network, every single switch port is monitored. This makes it super easy to pinpoint sources of heavier than usual traffic, a common source of problems.
There’s also a huge benefit from a capacity planning standpoint. Most, if not all, monitoring tools keep historical data. In fact, they usually plot graphs depicting the evolution of bandwidth usage. This makes it easy to see trends. One can, therefore, evaluate which segments of a local area network has a utilization growth pattern that warrants upgrading it. It can also come in handy as a concrete proof of the need to upgrade to help with justifying the expense.
Another major benefit of local area network monitoring tools lies in their alerting capabilities. Many such tools have alerting and notification features. Alerts can be triggered whenever certain thresholds are reached or exceeded, notify the administrators of an abnormal situation often before it becomes a service-impacting issue.
How Network Monitoring Tools Work
Network monitoring tools typically rely on the Simple Network Management Protocol, or SNMP to accomplish their feat. Despite its misleading name, SNMP is a relatively complex protocol. Devised some 30 years ago, it is a communication protocol that lets network administrators manage networking equipment and monitor and diagnose them from a remote location. For the sake of this discussion, we’ll ignore the management capabilities of the protocol but let’s see, in a not-too-technical way, how the monitoring works.
Every SNMP-enabled device exposes a certain number of its operational parameters. These are accessible by a suitably configured SNMP monitoring or management system. Some parameters can only be read while others can be modified. For monitoring, only the read-only ones are interesting. Those parameters are referred to as OIDs, an acronym for Object IDentifiers. In the context of monitoring local area networks, some OIDs are specifically interesting. SNMP-enabled networking devices have a pair of OIDs for each interface that counts the bytes in and the bytes out.
Monitoring tools use these counters to measure each interface’s traffic in bits per second. Here’s how they do it. A typical tool will poll each device at known intervals–5 minutes is a standard value, read the value of the bytes in and out counters, and store them in some form of database. The rest is just mathematics. The previous value of the counter is subtracted from the current one, giving the total number of bytes in five minutes. This number is then multiplied by eight to get the number of bits and divided by 300–the number of seconds in five minutes–to obtain the average bandwidth utilization over the last five minutes in bits per second. This information is also stored in a database and used to plot graphs or tables of its evolution in time.
Our Top 10 Best Tools For Monitoring Local Area Networks
We’ve searched the market for the best tools for monitoring local area networks and we’re glad to present our top ten products. Our list features a combination of paid and free tools. Some have more features than others but don’t assume than less-featured products are not as good. It really depends on your needs. If, for instance, all you want is to keep historical utilization data, you won’t mind a product with limited alerting capabilities–or even no alerting at all.
1. SolarWinds Network Performance Monitor (FREE TRIAL)
First on our list is a product from SolarWinds, one of the best-known names in the field of network and system administration tools. With over 30 full-featured tools, it has something for pretty much every need. In particular, SolarWinds is known to make one of the best NetFlow collectors and analyzers and one of the best bandwidth monitoring tools, the SolarWinds Network Performance Monitor. SolarWinds is also known to make some great free tools that address specific needs such as a subnet calculator or a TFTP server.

The SolarWinds Network Performance Monitor, or NPM as it is often called, is packed with many excellent features. One of the primary features of this product is its simplicity. We don’t mean simple as incomplete; we mean simple as easy. Furthermore, the product is highly flexible and its dashboard, views, and charts can be customized at will. Setup requires little effort and you can start monitoring within minutes. NPM is also totally scalable and will monitor networks of almost any size from the smallest ones to huge corporate networks spanning multiple sites.
The SolarWinds Network Performance Monitor periodically polls your networking equipment to read their interface counters, computes the bandwidth utilization, and displays it as graphs showing its evolution over time. Configuring this tool is easy and only requires that you specify a device’s IP address and then pick which parameter you want to monitor. An auto-discovery engine makes initial setup super easy. NPM has many advanced features. It can, for instance, built network maps. It can also display the critical path between two devices, a handy feature when troubleshooting slowdowns.
Prices for the SolarWinds Network Performance Monitor start at $2 995 and vary according to the number of monitored elements. Should you prefer to try the product before buying it, a free 30-day trial version can be downloaded from SolarWinds.
2. PRTG
The Paessler Router Traffic Grapher, or PRTG, is one of the easiest and fastest to set up. According to Paessler, you could be up and running within minutes. Part of the speed and ease of setting up the product is its auto-discovery feature. Upon installation, PRTG will scan your network and automatically add the components it finds.
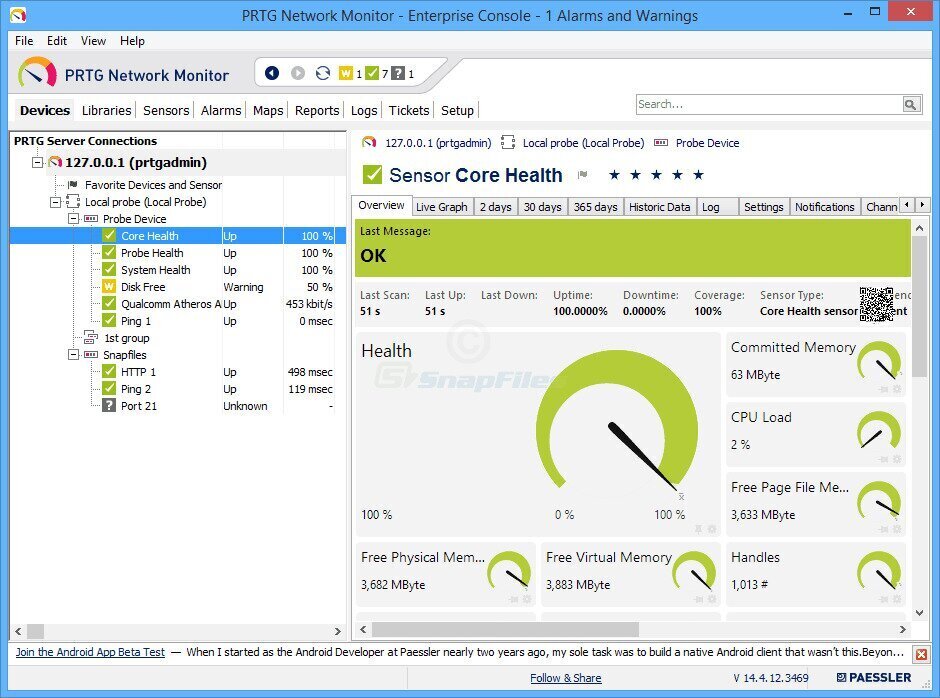
PRTG comes with a choice of user interfaces. This is another one of the tool’s strength. You can choose between a native Windows console, an Ajax-based web interface or mobile apps for Android or iOS. The mobile apps exploit their platform’s capabilities and will, for example, let you scan a QR code printed on a label by the software and affixed to your equipment to quickly view its status. PRTG can monitor several parameters–not just bandwidth utilization–using SNMP, WMI, NetFlow, and Sflow.
3. ManageEngine OpManager
The ManageEngine OpManager allows you to monitor routers, switches, firewalls, servers, and VMs for fault and performance. Network devices’ performance is monitored in real time and can be viewed on live dashboards and graphs. In addition to bandwidth utilization, critical metrics such as packet loss, errors, and discards are monitored. The tool will also monitor physical and virtual servers’ performance metrics like availability, CPU, disk space, and memory utilization.
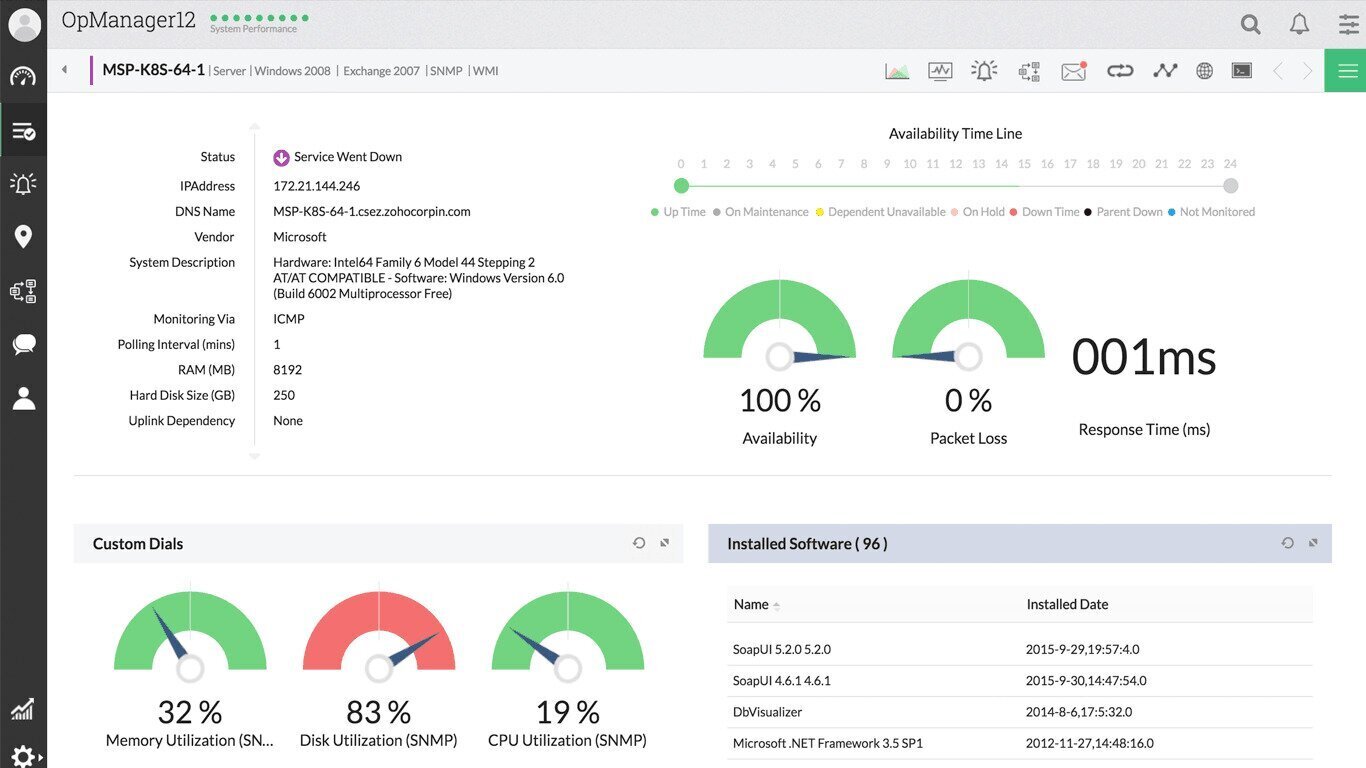
With more than 100 built-in reports that can be scheduled, customized, and exported as needed, reporting is one for OpManager’s best features. The software is available in three versions: Free, Essential and Enterprise. They differ in the number of devices they can monitor–from 10 or the Free version to 10 000 for the Enterprise–and their feature set, with higher versions sporting additional advanced features.
4. Cacti
Cacti is one of the most-used and of the oldest free and open-source monitoring platform. And while it might not be as feature-rich as some commercial products, it is still an excellent tool. The tool’s web-based user interface has a definite vintage feel but it is well laid out and easy to use. It mainly uses SNMP polling but custom scripts can be devised to get data from virtually any source.
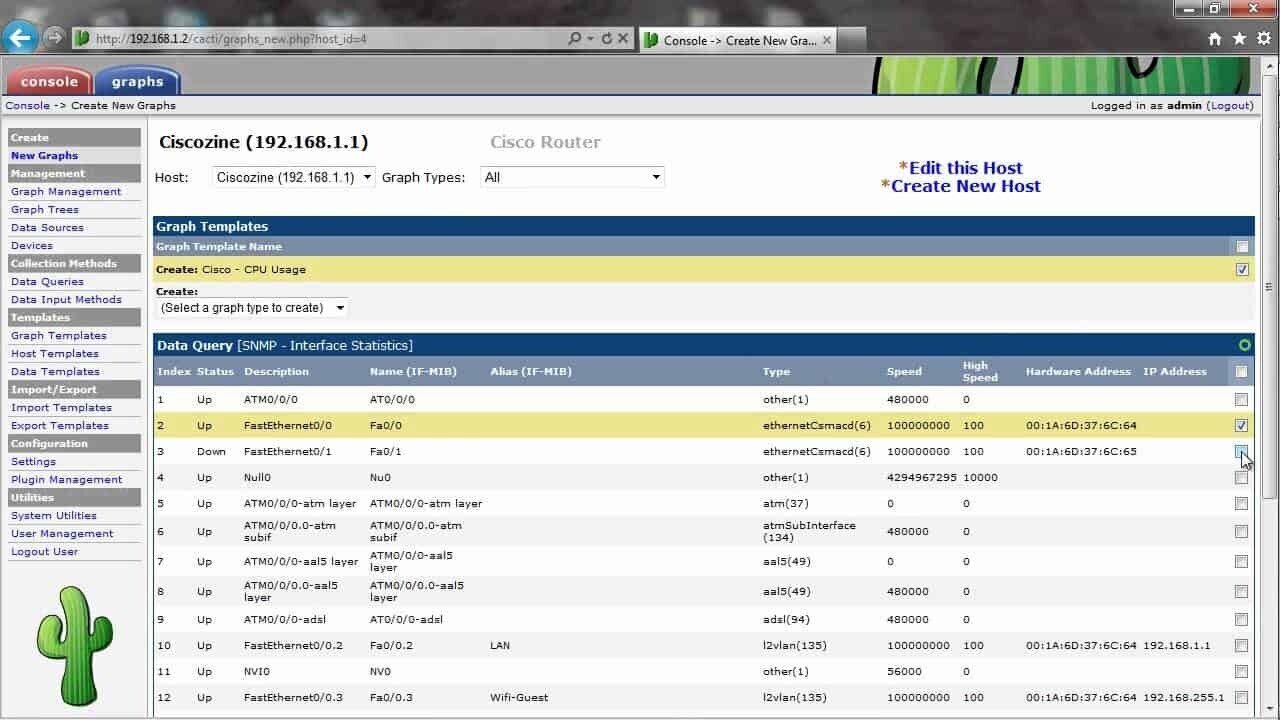
Cacti’s tool’s main strength is polling devices and graphing the data on web pages. It does that really well but that’s about all it will do. Then again, if you don’t need alerting or other extras, the product’s simplicity might be just what you need. And since the software is open-source and almost entirely written in the PHP language, it is highly customizable and you could adapt it to our specific needs.
One of Cacti’s strongest features is its templates. There is, for example, a built-in template for Cisco switches that already includes most of the elements you might want to monitor on such a device. And there are not only device templates, there are also graph templates and data source templates. Together, they make configuring the tool easier. You can also build device-specific templates yourself if they don’t already exist. There are also many device-specific templates that can be downloaded either from each device manufacturer’s website or from community-driven Cacti forums.
5. Observium
Observium is a monitoring platform featuring low-maintenance and auto-discovery. It supports a wide range of device types, platforms, and operating systems from multiple vendors including, among others, Cisco, Windows, Linux, HP, Juniper, Dell, FreeBSD, Brocade, Netscaler, and NetApp. The product’s primary focus is providing a beautiful, intuitive, and simple yet powerful user interface showing the health and status of your network.
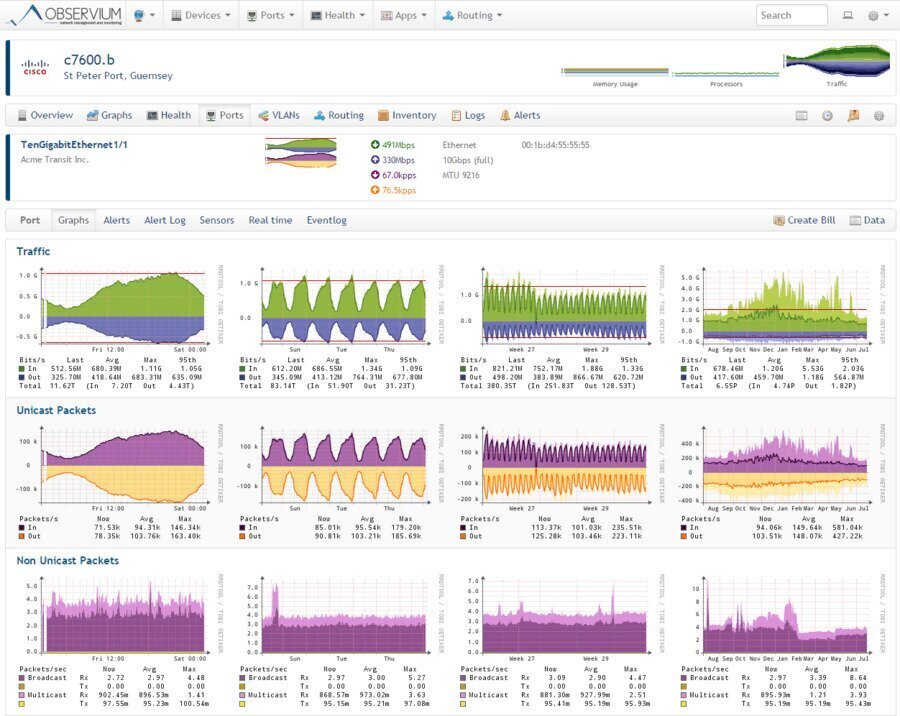
Observium offers way more than just bandwidth monitoring. For instance, there’s an accounting system that will measure total monthly bandwidth usage in the 95th percentile or in total transferred bytes. It also has an alerting function with user-defined thresholds.
Observium is only available for Linux. It is easy to set up and it almost configures itself. The main drawback is obtaining the software which can be a challenge. Instead of having a download page on Observium’s website, what you’ll find are detailed installation instructions for several Linux distributions that do include the links to get the package. In a way, it makes sense as it guides you into downloading the right package for your distro.
6. Nagios
Two versions of Nagios are available. There’s a free, open-source version that can be downloaded and used by anyone and there’s a commercial product called Nagios XI. The commercial product has more features but even the free edition is a very potent tool, within its limitations. Nagios’ and original purpose was up or down monitoring but it can also monitor several operational parameters.
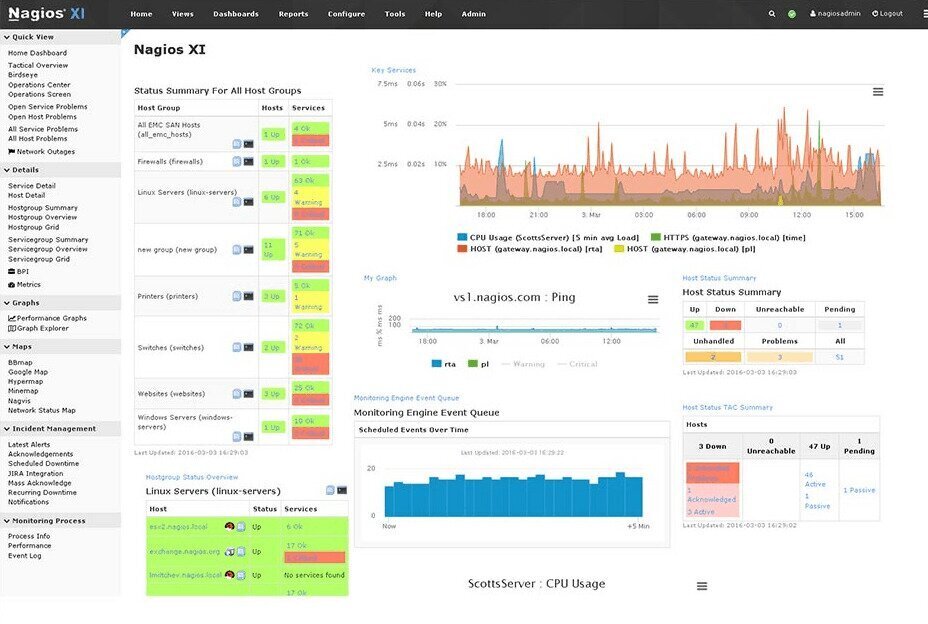
One of the best features of Nagios–especially the open-source version–is its community support. Several community-developed plugins, front ends, and add-ons are available directly from the Nagios website. If you want even more functionality, including bandwidth monitoring, you’ll have to go for Nagios XI which has bandwidth usage monitoring and many more useful features. A free trial of Nagios XI is available if you want to see for yourself what this tool can do for you.
7. WhatsUp Gold
WhatsUp Gold from Ipswitch has been around for a while. This tool’s primary function used to be monitoring system availability rather than operational parameters. As its name implies WhatsUp Gold will tell you what’s up and what’s not. It has one of the best alerting systems and can be configured to transmit alerts using a multitude of ways including email and SMS.
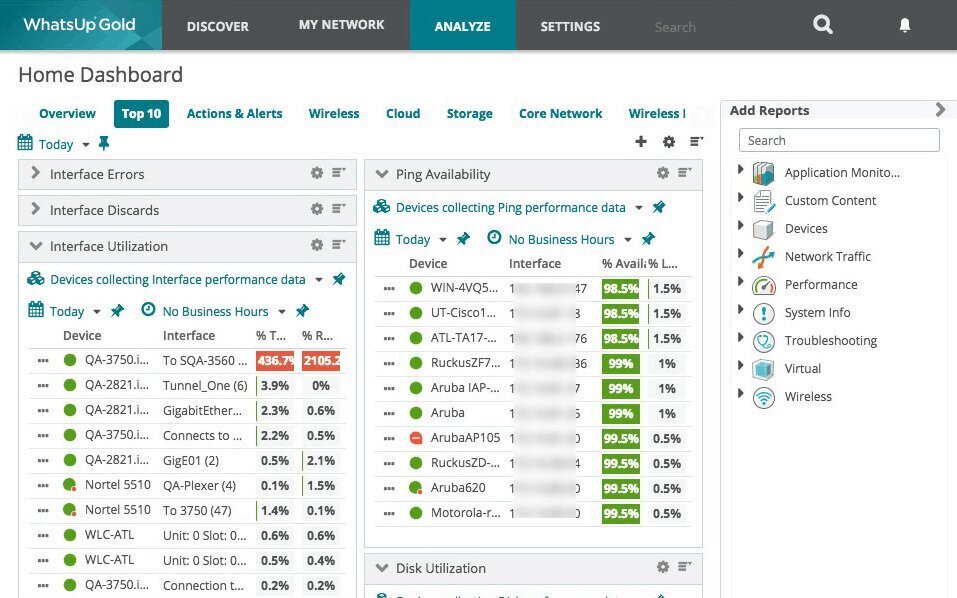
Today, WhatsUp Gold lo longer only monitors devices up and down status, it can also measure bandwidth usage and check that services are responding. It can, for instance, monitor the availability of Exchange and SQL servers, Active Directory, IIS and Apache Web services. And if your server farm is cloud-based, WhatsUp Gold will also monitor AWS or Azure installations.
8. Zabbix
Another open-source product, Zabbix has a highly professional look and feel, much like you’d expect from a commercial product. But it doesn’t just have a good-looking web-based interface, it also has an impressive feature set. Zabbix will monitor most network-attached devices, not just networking equipment. It would be a good option if you also want to monitor servers, for instance.
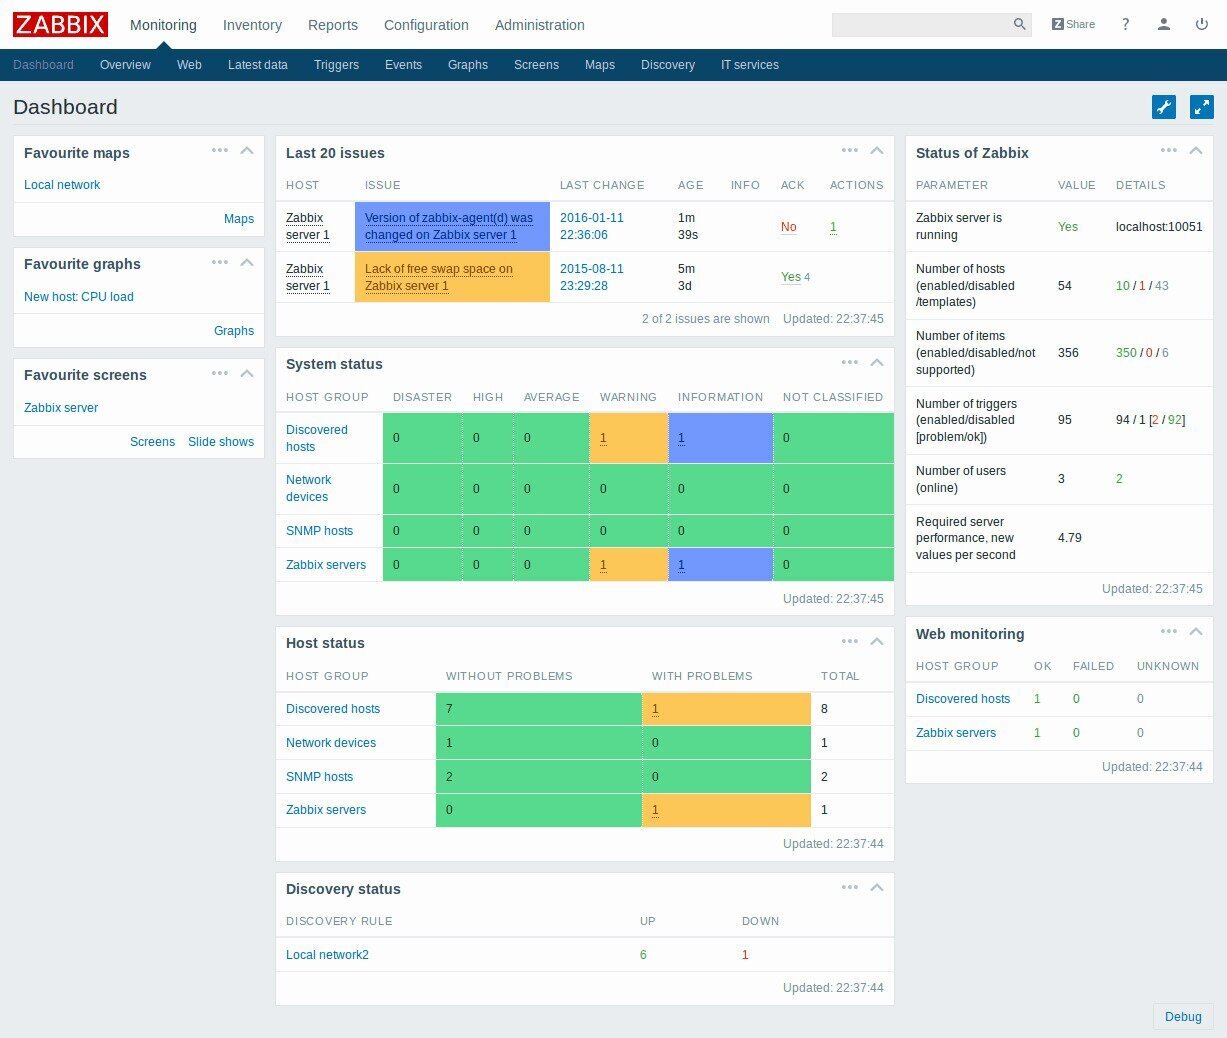
Zabbix uses SNMP as well as the Intelligent Platform Monitoring Interface (IMPI) for monitoring devices. You can use the software to monitor bandwidth, device CPU and memory utilization, general device health as well as configuration changes. Zabbix also features an impressive and completely customizable alerting system. It will not only send email or SMS alerts but also run local scripts which could be used to fix some issues automatically.
9. Icinga
Icinga is yet another open source monitoring platform. It’s got a simple and clean user interface and a feature set that rivals a few commercial products. Like most bandwidth monitoring systems, Icinga uses SNMP to gather usage data from devices. One of the areas where Icinga particularly shines is its use of plugins. There are thousands of community-developed plugins to perform various monitoring tasks and extend the product’s functionality. And if you can’t find the right plugin for your needs, you can write one yourself and contribute it to the community.
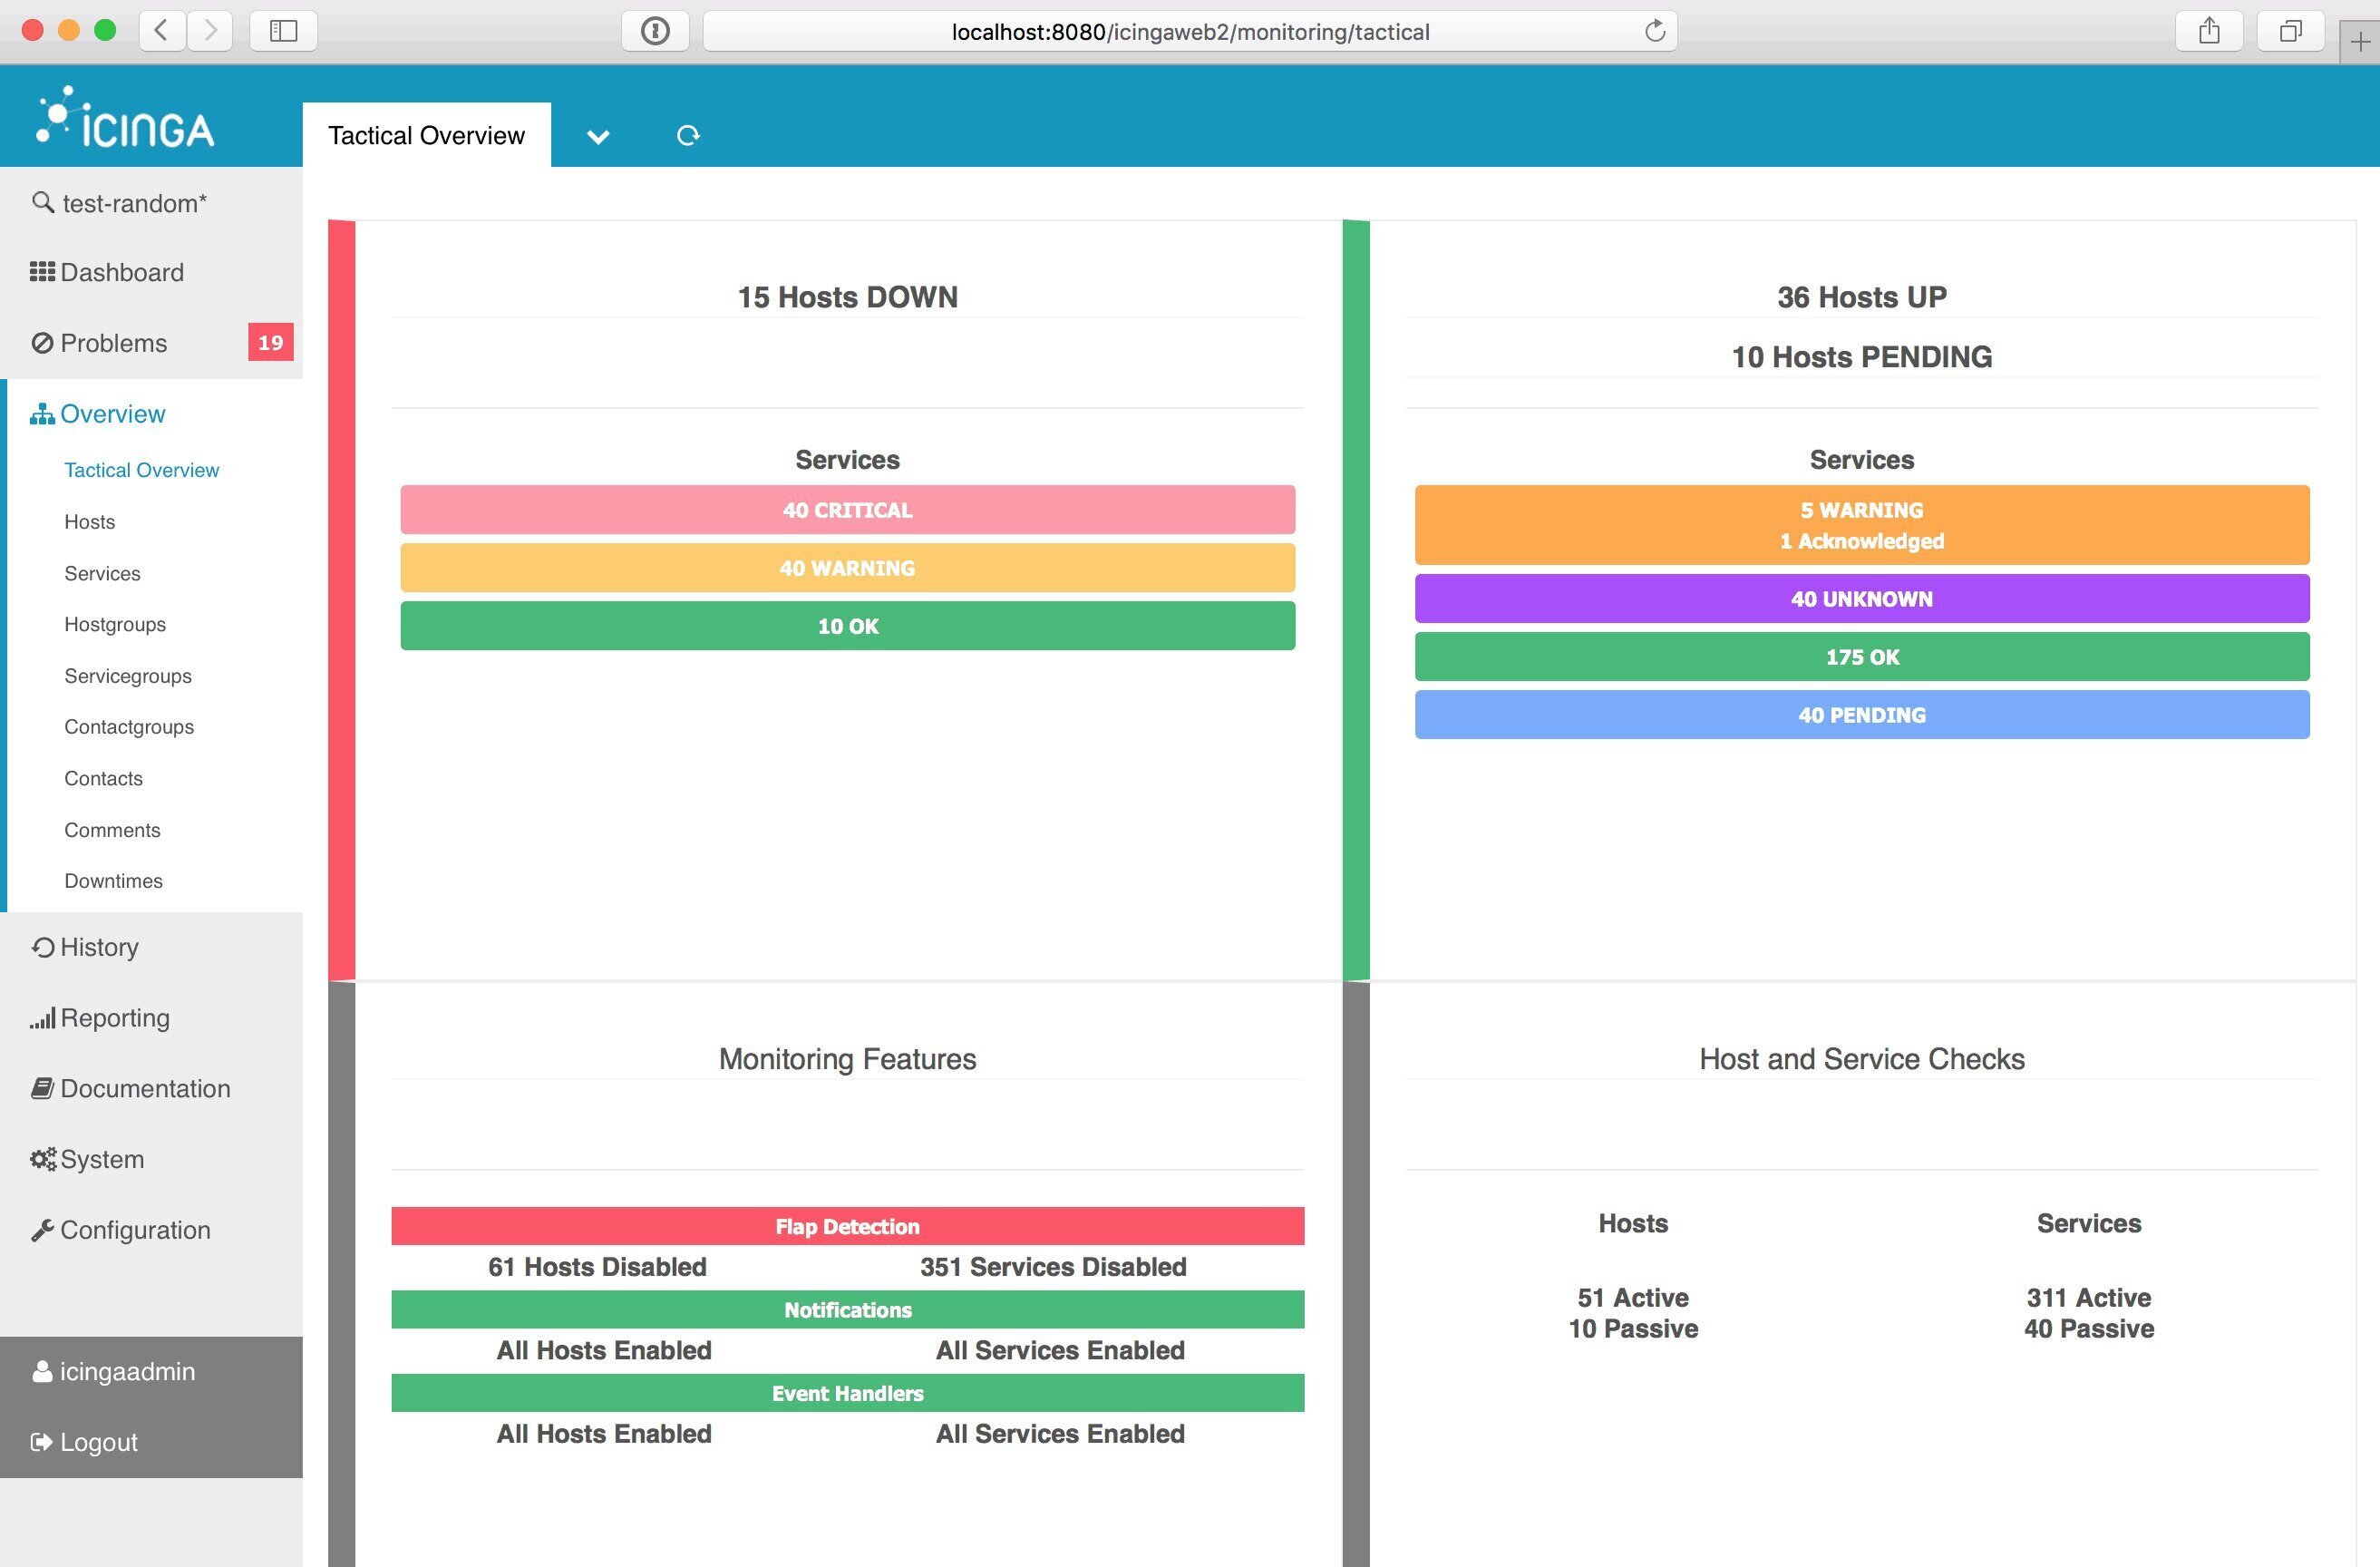
Alerting and notification also among Icinga’s best features. Alerts are fully configurable in terms of what triggers them and how they are transmitted. The tool also features segmented alerting. This means that you can send some alerts to some users and other alerts to different people. This is a great feature when you have different systems managed by different groups.
10. Zenoss Core
Last on our list is Zenoss Core. This might not be the best-known monitoring tool but it certainly deserves a spot on our list, thanks to its feature set and professional aspect. This tool can monitor many things such as traffic flows or services like HTTP and FTP. It’s got a clean and simple interface and its alerting system is excellent. We particularly loved the multiple alerting mechanisms that will alert a second person if the first one does not respond within a predefined delay.
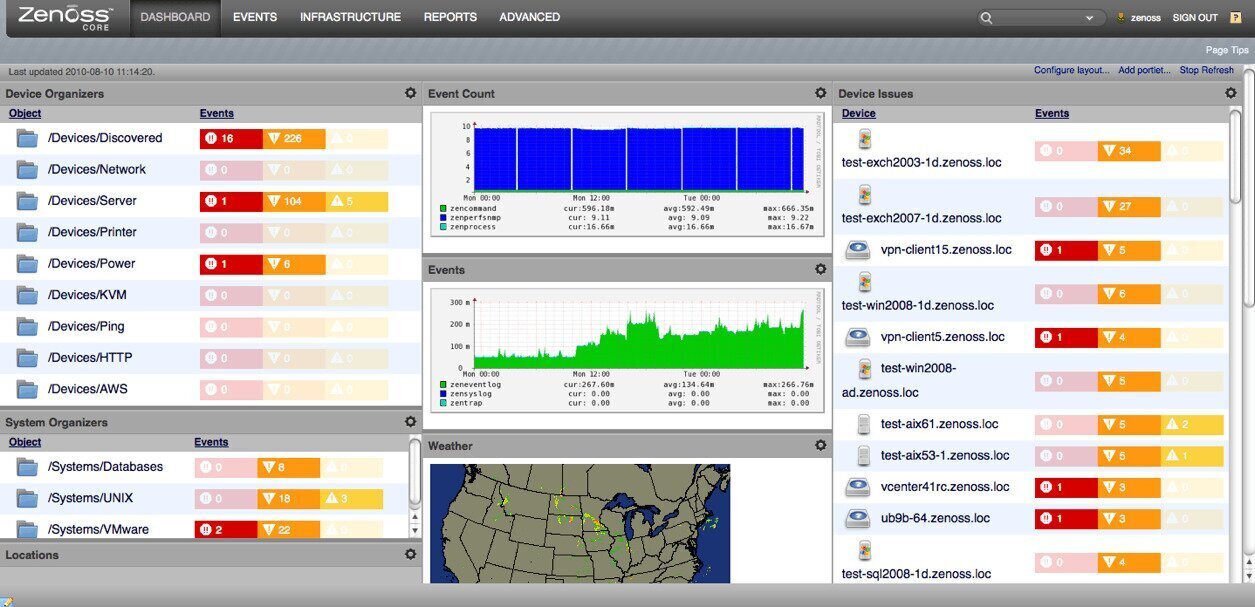
Unfortunately, Zenoss Core is one of the most complicated systems to install and set up. The process is entirely command-line driven. When used to GUI installers, configurations wizards, and auto-discovery engines, this may seem a bit archaic. However, there is ample documentation available, eliminating much of the guesswork.
In Conclusion
With so many products available, this list of the best tools for monitoring local area networks could be dozens of items long. We’ve tried to give you a good sample of what the best available tools are. Each has its strengths and weaknesses but they are all excellent products and we’re comfortable recommending any one of them. As always, the main determining factor in choosing a monitoring tool should be its feature set.