

Our Top 10 Linux Network Performance Tools
Every single network administrator wants to ensure that the performance of whatever they manage is optimal. It’s a simple matter of keeping the users happy. After all, they tend to be the first to notice even the slightest performance degradation. So, if you want to be able to respond to any performance complaint that you’re aware of it and working at fixing it, you need some performance tools. If you work in a Linux shop, this post is for you. We’re about to review some of the best Linux network performance tools.

We’ll start off by briefly discussing network performance monitoring. Our goal is not to make you a subject matter experts but rather to ensure that we are all on the same page as we explore the different tools which are available. We’ll then jump right into the core of the matter end introduce some ten different Linux tools you can use to monitor, manage, and troubleshoot the performance of your network.
About Network Performance Monitoring And Testing
The thing with network performance monitoring and testing is that it seems like everyone has his own idea of what that means. For instance, we’re often seeing network bandwidth monitoring tools being referred to as performance monitoring. The same is true of traffic analysis tool or packet sniffers. This raises the following question: What is network performance monitoring and testing?
For the purpose of this post, let’s just leave that debate aside and accept that network performance monitoring tools are simply any tool that can be used to measure, assess, troubleshoot, or improve network performance. By using such an all-encompassing definition, we’ll be able to bring you the best assortment of tools and leave it up to you to pick those that can help you with your specific situation or issue.
The Best Network Performance Tools For Linux
So, we’ve compiled this list of some of the most-used Linux tools that can be used to test or monitor various metrics associated with network performance. They are available under most Linux distributions. Each one is useful to monitor and find the actual causes of performance issues. Among all the suggestions below, one is almost certain to fit your specific need.
1. Tcpdump
Tcpdump is the original packet sniffer. It is a tool that is used to dump—hence its name—the content of all the network traffic to the standard output. Through the magic of redirection and pipes, its output can, of course, be directed to any file or even to another process. Since its initial release, the tool went through some improvements and bug fixes but it remains essentially unchanged. It is available on virtually every Linux distribution and it has become the de-facto standard for a quick tool to capture packets. Tcpdump uses the libpcap library for the actual packet capture.
One of the drawbacks of a tool such as tcpdump is that it can collect a huge amount of data. So much so that it could be impossible to find exactly what one is looking for. Fortunately, one of the key’s to the tool’s strength and usefulness is the possibility to apply filters that will let you specify precisely what traffic to capture. You can also pipe the command’s output to grep—another common command-line utility—for further filtering. Someone mastering tcpdump, grep and the command shell can get it to capture precisely the right traffic for any debugging task.
Here’s an example of using tcpdump:
# tcpdump -i eth0

tcpdump: verbose output suppressed, use -v or -vv for full protocol decode

listening on eth0, link-type EN10MB (Ethernet), capture size 96 bytes

22:08:59.617628 IP tecmint.com.ssh > 115.113.134.3.static-mumbai.vsnl.net.in.28472: P 2532133365:2532133481(116) ack 3561562349 win 9648

22:09:07.653466 IP tecmint.com.ssh > 115.113.134.3.static-mumbai.vsnl.net.in.28472: P 116:232(116) ack 1 win 9648

22:08:59.617916 IP 115.113.134.3.static-mumbai.vsnl.net.in.28472 > tecmint.com.ssh: . ack 116 win 64347
You’ll certainly agree that such an output can be a bit cryptic. This is where a true network protocol analyzer can come in handy.
2. Wireshark
You can think of Wireshark as tcpdump on steroids but, in fact, it is much more than that. The reference in packet sniffers, it has become the de-facto standard and most other tools try to emulate it. This does way more than tcpdump, though. It will not only capture traffic. It is a network traffic analyzer as much as it is a packet capture tool. It’s so powerful than many administrators use other tools—such as tcpdump—to capture traffic to a file then load it into Wireshark for analysis. In fact, it is such a common way of using Wireshark that upon startup, you’re prompted to either open an existing capture file or start capturing traffic. Another strength of Wireshark is all the filters it incorporates which allow you to zero in on precisely the data you’re interested in.
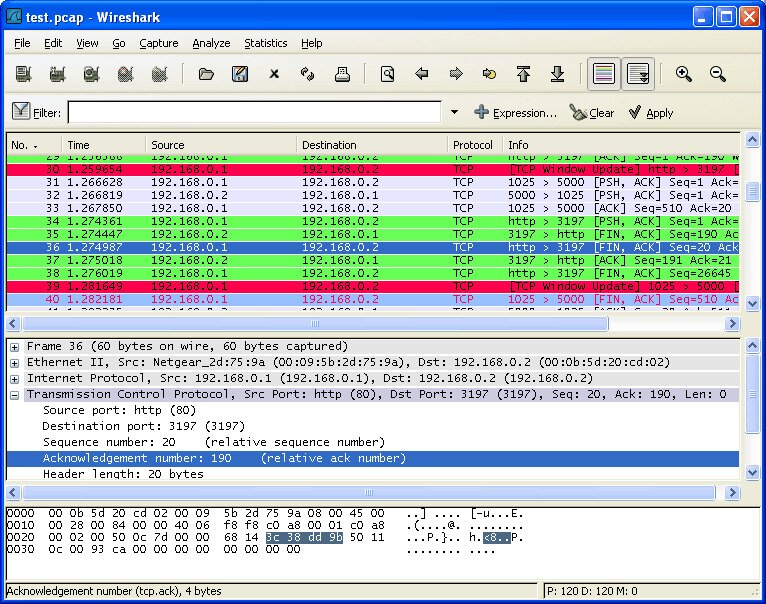
Wireshark has a steep learning curve but it is well worth learning. It will prove invaluable time and time again. And once you’ve learned it, you’ll be able to use it everywhere as it has been ported to almost every operating system. And to make it even better, it is open-source and available for free.
3. Netstat
One of the problems with troubleshooting TCP/IP connectivity issues comes from the huge number of connections and services typically running on any system. Netstat can be used to help identify the status of each connection and which process is servicing each one, helping you narrow down the search. Netstat, which is available on every Linux distribution, can quickly provide details about client services and TCP/IP communications. In its most basic form, the command displays all active connections on the local computer, both incoming an outgoing.
Netstat can also display listening ports on the computer where it’s run. In fact, the command accepts many options. However, the available options differ between platforms and some options work differently on different platforms. For instance, the -b option on Windows would display the name of the executable associated with each connection—the process servicing the connection—whereas, on Mac OS X or BSD, it is used in conjunction with -i to display statistics in bytes rather than bits. The best way to learn about all the available parameter of your specific version on Netstat is to run it with the -? option to display the tool’s help screen. On Linux, you can also display the Netstat man page to get basically the same information.
Here’s how a typical netstat command and its output look like:
# netstat -a | more

Active Internet connections (servers and established)

Proto Recv-Q Send-Q Local Address Foreign Address State

tcp 0 0 *:mysql *:* LISTEN

tcp 0 0 *:sunrpc *:* LISTEN

tcp 0 0 *:realm-rusd *:* LISTEN

tcp 0 0 *:ftp *:* LISTEN

tcp 0 0 localhost.localdomain:ipp *:* LISTEN

tcp 0 0 localhost.localdomain:smtp *:* LISTEN

tcp 0 0 localhost.localdomain:smtp localhost.localdomain:42709 TIME_WAIT

tcp 0 0 localhost.localdomain:smtp localhost.localdomain:42710 TIME_WAIT

tcp 0 0 *:http *:* LISTEN

tcp 0 0 *:ssh *:* LISTEN

tcp 0 0 *:https *:* LISTEN
4. IPTraf
IPTraf is a console-based network statistics utility for Linux. You can use the tool to gather a variety of information such as TCP connections packet and byte counts, interface statistics and activity indicators, TCP or UDP traffic breakdowns, and LAN station packet and byte counts. It features an IP traffic monitor that shows information about the IP traffic on your network, including TCP flag information, packet and byte counts, ICMP details, and OSPF packet types. With the most recent version dating back to 2005, it is somewhat of a dated tool yet it can provide a lot of useful information if you care to learn how to use it.
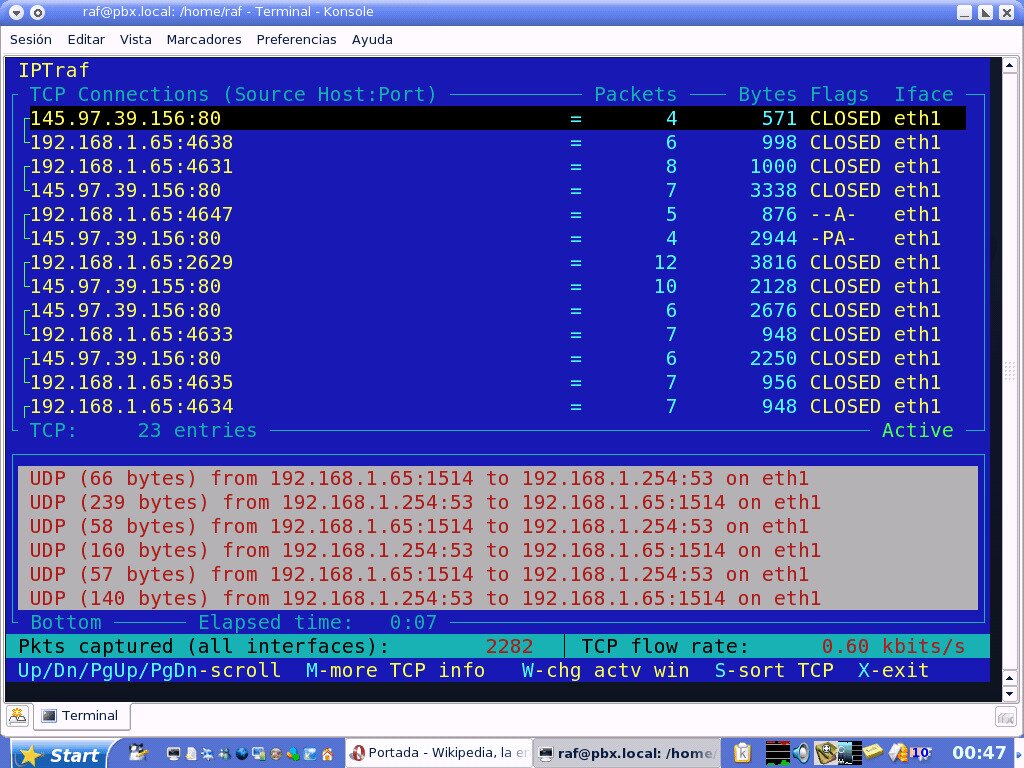
Other features of IPTraf include general and detailed interface statistics showing IP, TCP, UDP, ICMP, non-IP and other IP packet counts, IP checksum errors, interface activity, packet size counts. It also boasts a TCP and UDP service monitor showing counts of incoming and outgoing packets for common TCP and UDP application ports. Furthermore, a built-in LAN statistics module discovers active hosts and shows statistics showing their data activity. Finally, the tool also has TCP, UDP, and other protocol display filters, allowing you to view only the traffic you’re interested in.
The tool which sports a full-screen, menu-driven operation, will handle most types of network interfaces and it uses the built-in raw socket interface of the Linux kernel. This allows it to be used over a wide range of supported network cards.
5. Nagios
Nagios is different from the previous tools in that it is a full-fledged network monitoring solution rather than a performance testing or assessment tool. It is available in two different versions, the free and open-source Nagios Core and the paid Nagios XI. Both share the same underlying engine but the similarity stops there. Nagios Core is an open-source monitoring system that runs on Linux. The system is completely modular with the actual monitoring engine at its core. The engine is complemented by dozens of available plugins which can be downloaded to add functionality to the system. Each plugin adds some features to the core.
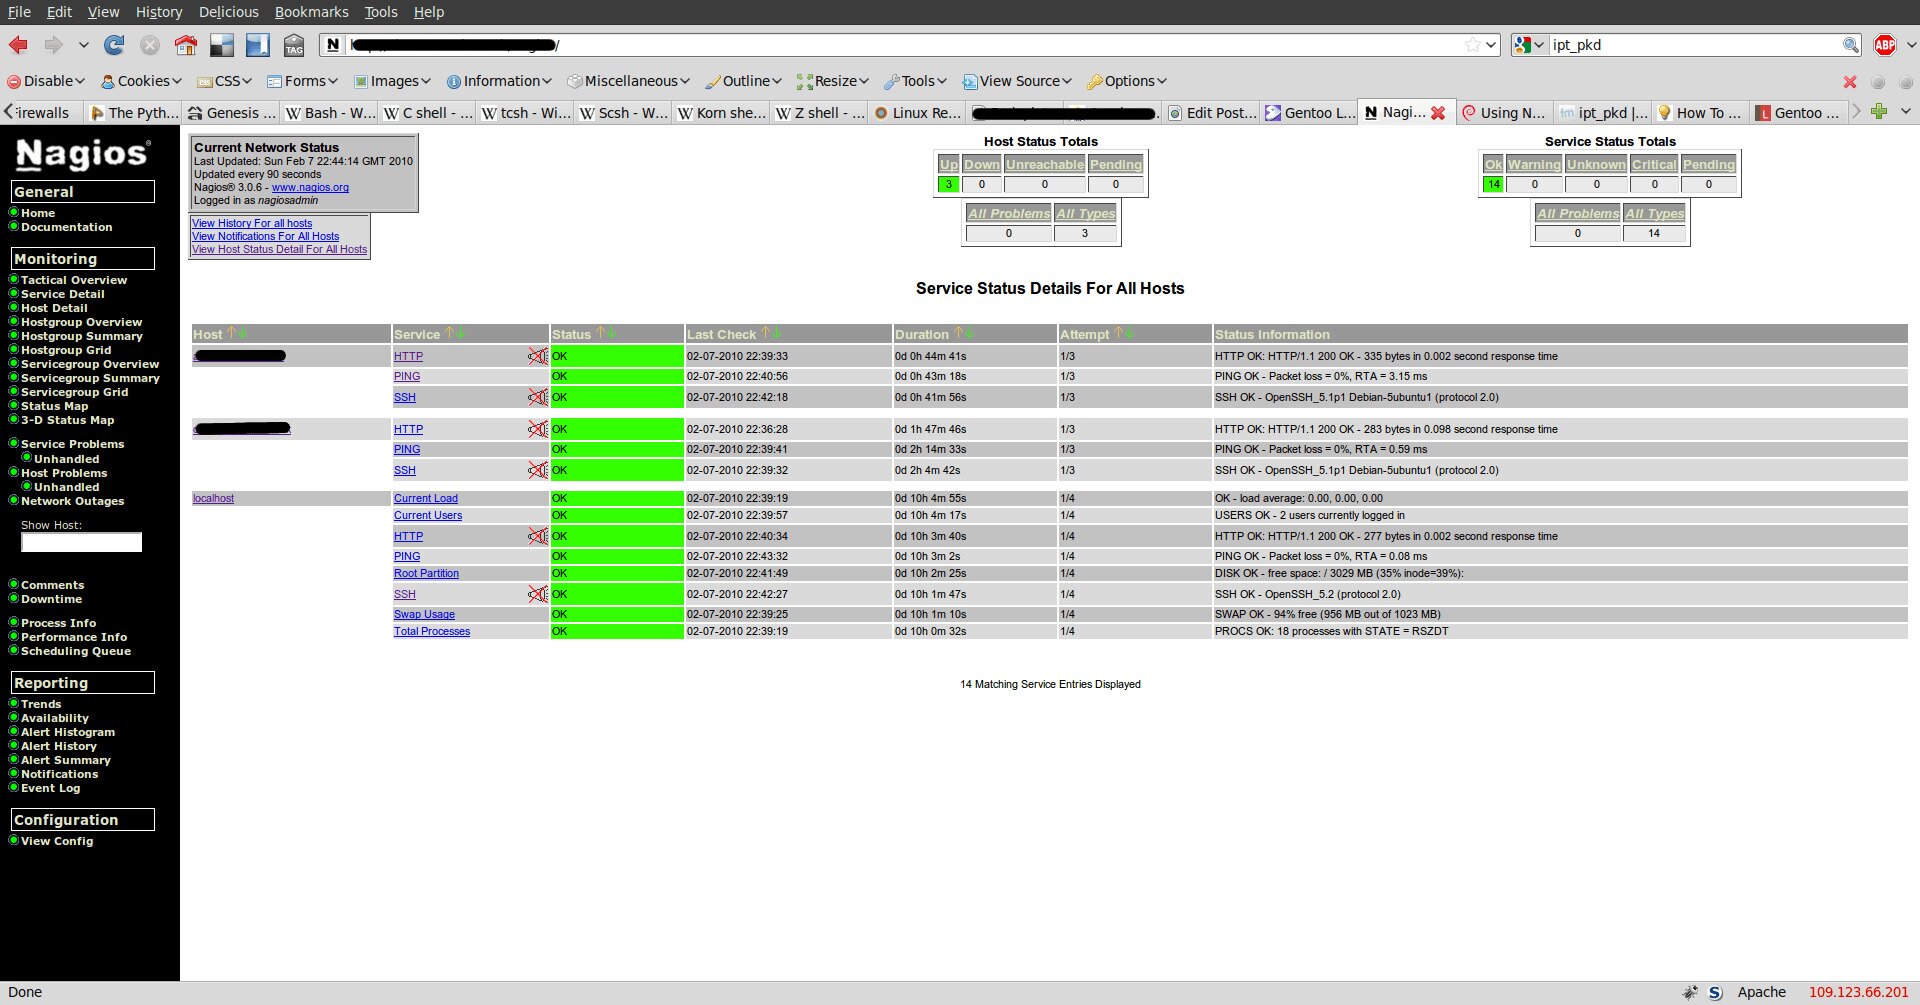
Preserving this modular approach, the tool’s user interface is also modular and several different community-developed options are also available for download. The Nagios core, the plugins and the user interface combine to make a complete monitoring system. This, of course, can mean that setting up Nagios Core is not for the faint-hearted.
As for Nagios XI, it is a commercial product based on the same core engine. It is, however, a complete self-contained monitoring solution. No need to assemble it from various parts. The product targets a wide audience from small businesses to large corporations. As you would have guessed, it is much simpler to install and configure than Nagios Core, thanks in part to a configuration wizard and auto-discovery engine. The main drawback of Nagios XI is its price which starts at around $2 000 for a 100-node license.
RELATED READING: SolarWinds NPM vs Nagios
6. Observium
Observium is another all-encompassing monitoring platform. It supports a wide range of device types, platforms and operating systems including, among others, Cisco, Windows, Linux, HP, Juniper, Dell, FreeBSD, Brocade, Netscaler, NetApp. I doubt that you can find a network-connected device that’s not supported. The tool’s primary focus is providing a beautiful, intuitive, and simple yet powerful user interface visually depicting the health and status of your network.
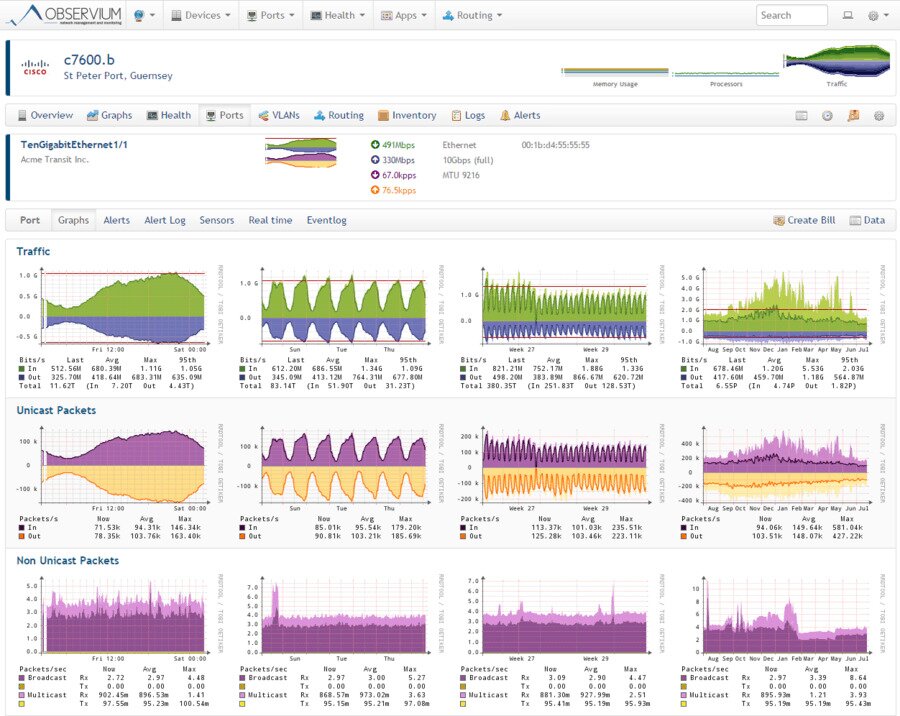
Although many think of Observium as a bandwidth monitoring tool, it has much more to offer. For instance, it features an accounting system that will measure total monthly bandwidth usage in the 95th percentile or in total transferred bytes. It also has an alerting function with user-defined thresholds. Furthermore, Observium integrates with other systems and can pull their information and display it within its interface.
Observium it is to set up and it almost configures itself through its auto-discovery process. Although there doesn’t appear to be a download section on Observium’s website, there are detailed installation instructions for several Linux distributions that do include the links to get the right package for each distribution. The instructions are very detailed so finding and installing the software should be easy.
This product is available in two versions. There’s the Observium Community is which available for free to everyone. This version receives updates and new features twice a year. There’s also Observium Professional which has additional features and comes with daily updates.
7. Icinga
Icinga is yet another open-source network monitoring platform. The tool is provided with a simple and clean user interface and a feature set that rivals some commercial products. Like most bandwidth monitoring systems, Icinga primarily uses SNMP to gather usage data from devices. However, one of the areas where the tool stands out is in its use of plugins. There are tons of community-developed plugins to perform various performance monitoring tasks and extend the product’s functionality. And if you can’t find the right plugin for your needs, you can write one yourself and contribute it to the community.
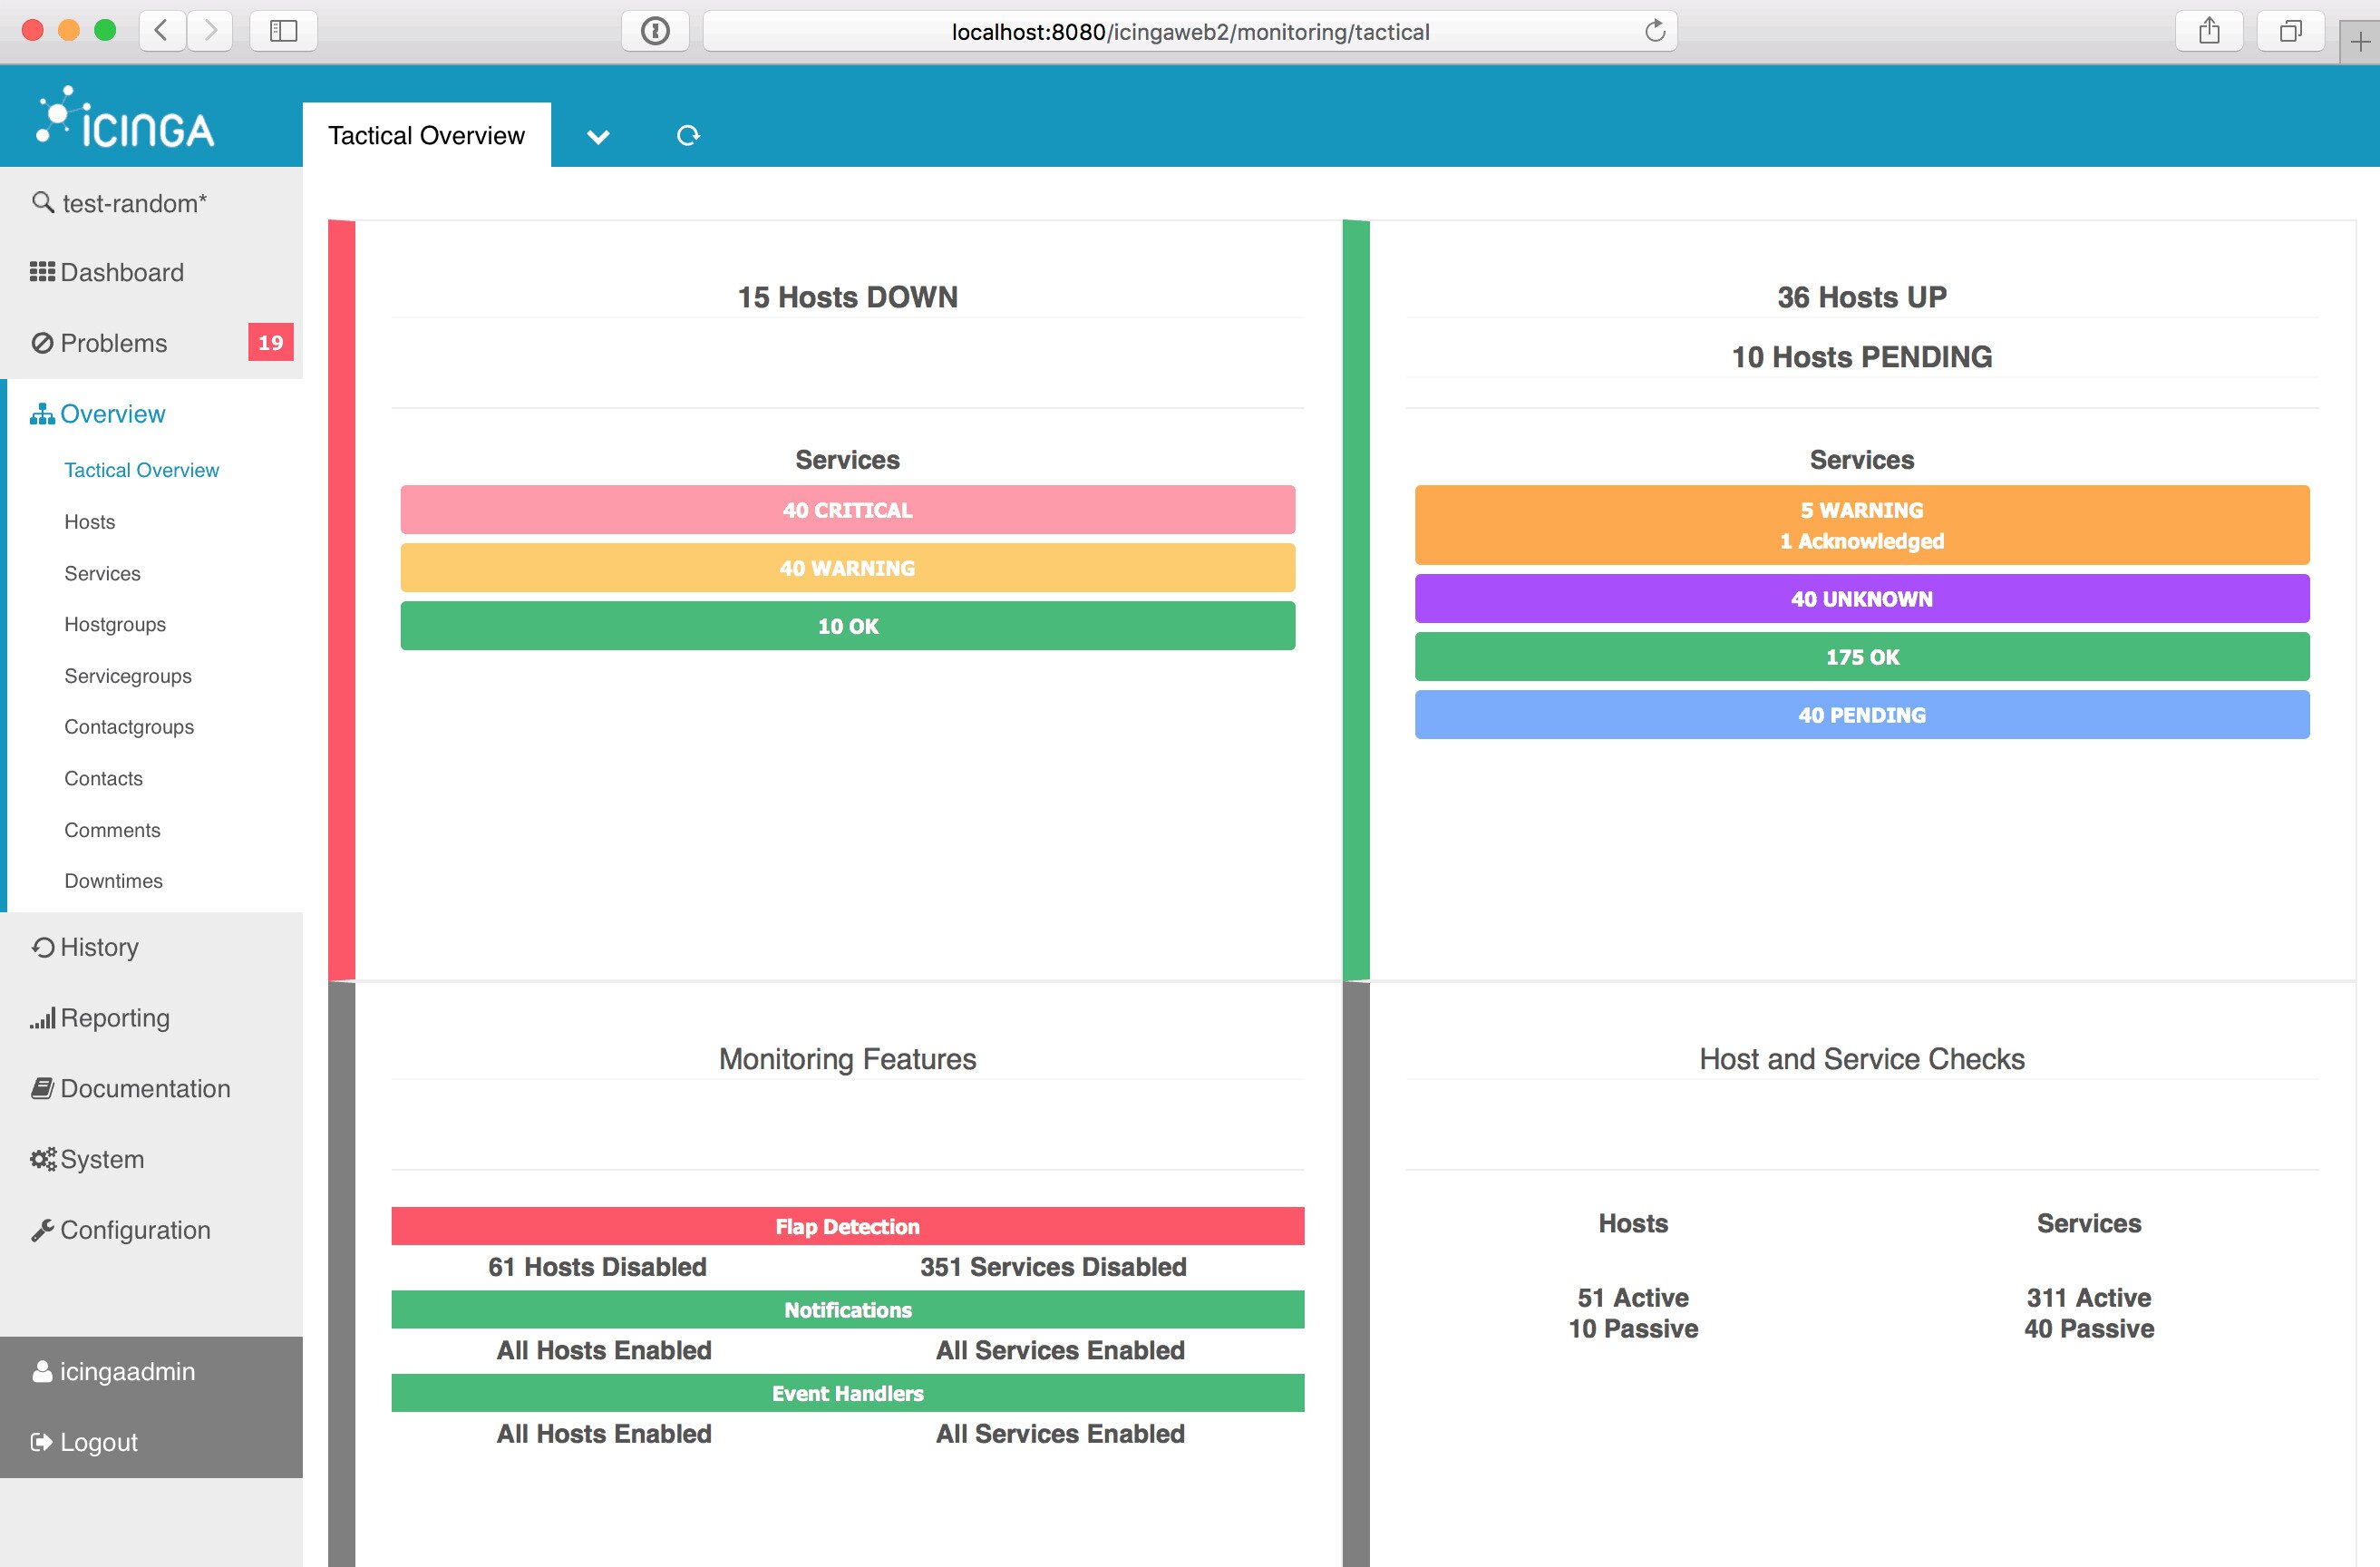
Alerting and notification are two of Icinga’s best features. Alerts are fully configurable in terms of what triggers them and how they are transmitted. The tool also features segmented alerting. With this feature, you can send some alerts to some users and other alerts to different people. This is a great feature when you have different systems managed by different groups. You could, for example, have all alerts related to server sent to the server administration team and all alerts related to networking sent to the network support team.
8. Zabbix
Zabbix is another free and open-source network performance monitoring tool. It’s got a highly professional look and feel, much like you’d expect from a commercial product. The good looks of its user interface are not its only asset, though. The product also boasts an impressive feature set. The platform can monitor most network-attached devices in addition to networking equipment. It is a perfect option for monitoring the performance of your whole infrastructure.
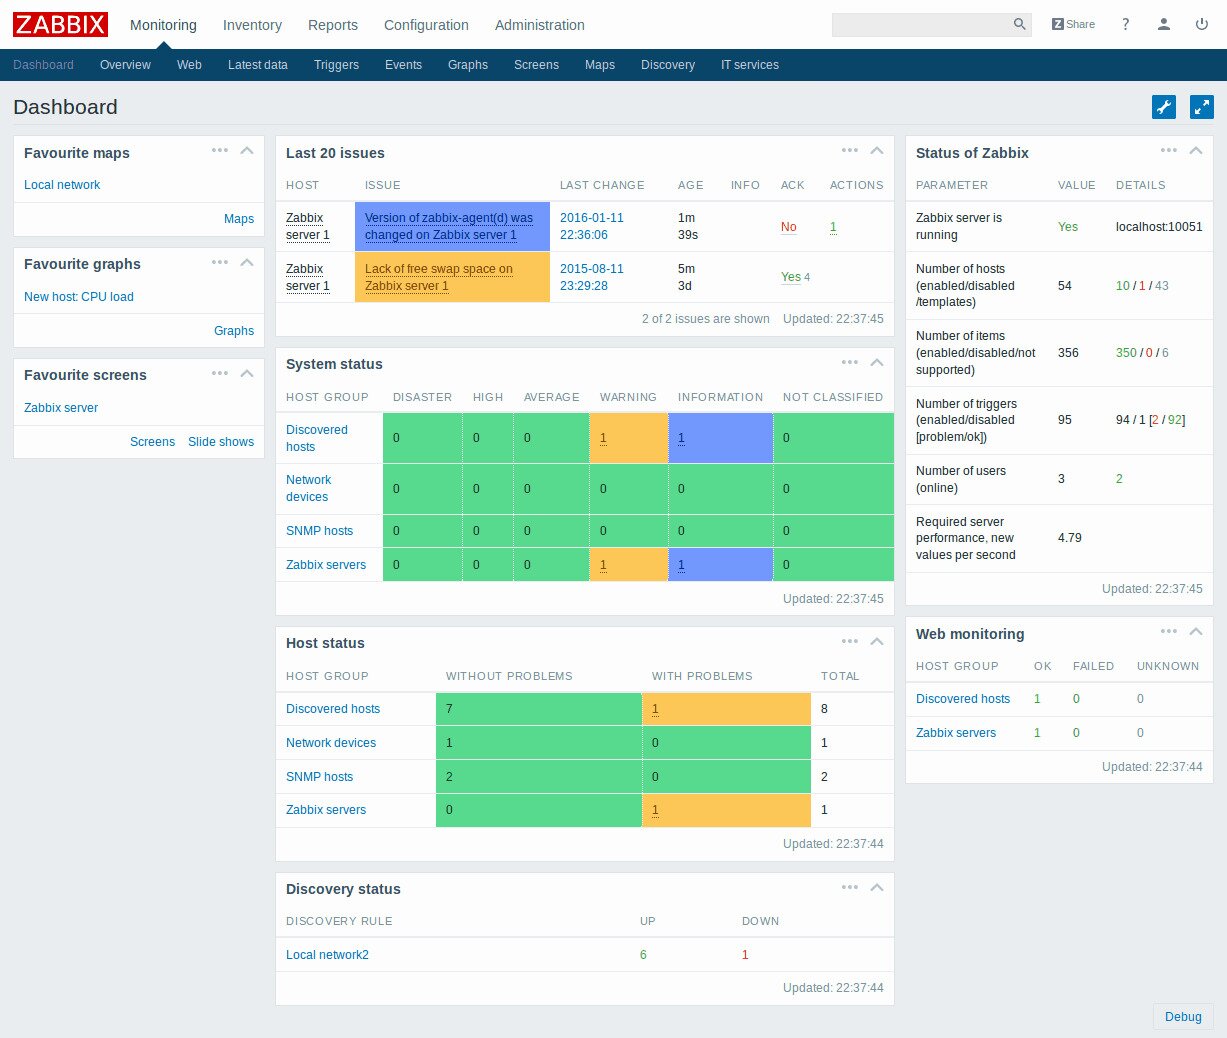
Zabbix uses SNMP as well as the Intelligent Platform Monitoring Interface (IMPI) for monitoring devices. You can use the software to monitor bandwidth, device CPU and memory utilization, general device health and performance as well as configuration changes. The product also features an impressive and completely customizable alerting system. It will not only send email or SMS alerts but can also run local scripts which could be used, for instance, to fix some issues automatically.
9. Cacti
A post about Linux network performance tools wouldn’t be complete without a mention of Cacti, a free and open-source complete network performance monitoring tool. It’s been around for some fifteen years or so and, although it might not be the most sophisticated of tools, it is still actively developed—with the latest version just a month old—and it gets the job done quite efficiently. Its main components are a fast poller, advanced graph templates, and multiple data acquisition methods. Cacti features user access control built right into the product and the product also boasts an easy to use albeit antique-looking web-based user interface. The tool scales very well from the smallest single device installations up to complex networks with many different WAN sites.
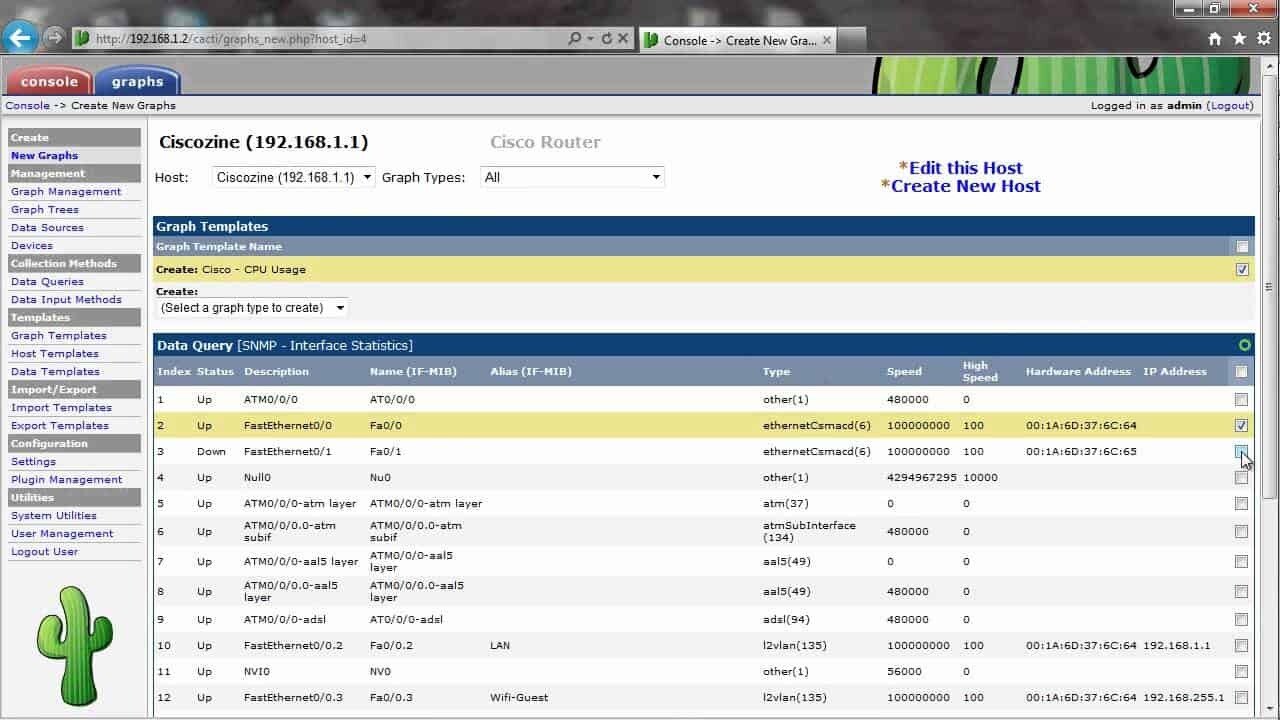
Cacti, which, at its core is a front end to the RRDtools, uses SNMP to fetch data which it stores in a SQL database. It is written in PHP and can be modified to suit your needs. One of the product’s strongest features is its use of templates. There are built-in templates, for example, for Cisco routers that already includes most of the elements you might want to monitor on such devices. But there are not only device templates, there are also graph templates. Together, templates make configuring the software much easier. You can also build your own customized templates if suitable ones aren’t already available. Also, many device-specific templates can be downloaded from device vendor’s websites and several community-driven Cacti forums offer them for download.
10. Munin
Munin is yet another GUI front end to RRDtools, it is written in Perl and it is licensed under GPL. It is a good tool to use to monitor the performance of networks, systems, applications, and services. It works on all Unix-like operating systems and features an excellent plugin system with some 500 different plugins available to monitor almost anything you want on your network.
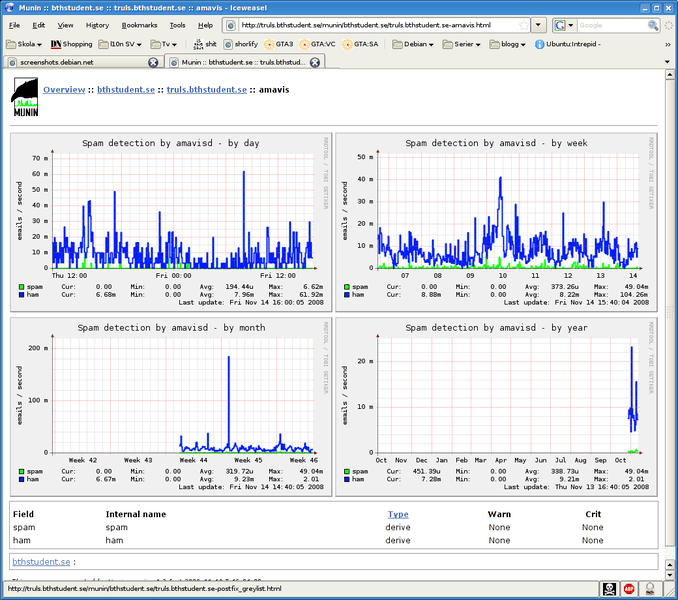
Munin presents all the information it gathers in graphs on a web interface but its main strength is how it relies on comparative analysis to try to identify what has changed to cause a performance degradation. A notifications system is available to send messages to the administrator when there’s an error or when the error is resolved.