

5 Best Memory Monitoring Tools And Software
My first computer had merely 64 kilobytes of RAM and monitoring memory usage was not much of a concern except when writing software. Today’s computers are different, although they commonly have up to a million time more RAM, they also run multiple applications and processes. And each of them is competing for memory. And when a computer runs out of memory — fortunately a rare occurrence–things really start to go wrong. To avoid that, a system administrator must keep a watchful eye on memory utilization at all time. Using the right tool, memory monitoring is not any harder than monitoring anything else such as network bandwidth. Today, we’re having a look at some of the best tools you can use to monitor you various system’s memory usage.

Before we hit the core of our subject, we’ll begin by having a look at memory monitoring in general. We’ll try to explain what it is, why one needs it and how it can be done. We’ll see that the Simple Network Management Protocol, or SNMP, offers an easy and unobtrusive mean of monitoring all types of device operational parameters, including memory usage. And so that you better understand how many of the tools on our list operate, we’ll dig a little deeper into how SNMP does its monitoring magic. Only then will we be ready to review five of the best memory monitoring tools and software we could find.
Memory Monitoring – The What, The Why, and The How
Let’s start by trying to define memory monitoring. After all, it will certainly help if we all agree on what it is that we’re trying to monitor. In the context of this article, the type of memory monitoring we’re interested in has to do with memory usage. There are some advanced server and infrastructure testing tools that can report on memory performance–i.e. how fast the computer can write to and read from memory– but this is not what we have in mind here. The parameter we want to monitor is simple how much free memory is available. Some tools will report on the percentage of available memory while other will give you an absolute number representing the amount of available memory. These will often also give the total quantity of memory, making it easy to calculate the percentage. As a matter of fact, this is typically how tools which give you a percentage compute it.
Although there could be many reasons to monitor memory usage it all boils down to a simple thing: performance. As available memory goes down on a typical computer, so will its performance; plain and simple. And you don’t want to even begin to think of what would happen when a computer runs out of memory. Although most modern operating systems have some built-in protection against that unlikely event, many things can go wrong if and when it happens.
Knowing what we want to monitor and why we need to monitor it is one thing but we need to figure out how we’re going to do that. The answer is simple, we’re going to use the right tool for the job. And while there are countless tools that can monitor system memory, some do rely on locally-installed agents which run on the monitored computer, potentially robbing them of the precious resource that is RAM. We’d, therefore, rather use an agentless approach. Thanks to the Simple Network Management Protocol, this is easy and many different tools are available.
A Few Words About SNMP
Despite having “simple” in its name, SNMP is quite complicated. Fortunately, just like you don’t have to be a mechanics to drive a car, you don’t have to be an expert to use the protocol. Here’s what you need to know. SNMP is used by an SNMP manager–in our case, the monitoring tool–to remotely read and write operational parameters in SNMP-enabled devices. SNMP is built into most operating systems and networking devices. Some OSes will require that you install or enable the service while networking devices typically only need you to configure it.
The connection between the monitoring tool and the monitored device is done in clear text with barely any security. SNMP enabled devices are configured with public (read-only) and private (read-write) “community strings” and each request from the monitoring tool must include the proper community string.
The SNMP-enabled device makes some of its operational parameters available. Each of them is referred to as an OID, a short for Object IDentifier. For memory monitoring, the monitoring tool will be reading the total memory and the available memory values. A simple math calculation is then necessary to compute the percentage of available memory. Most SNMP monitoring tools read the values periodically–typically every five minutes–and often plot the results on graphs or display them in table format.
The Best Tools For Memory Monitoring
Most tools used to monitor memory can also monitor several other operational parameters. In fact, most SNMP monitoring tool can monitor memory. The tools that made it on our list are some of the best we could find and they are all tools that make it relatively easy to monitor memory.
1. SolarWinds Memory Monitor Tool (FREE Trial)
SolarWinds is known for making some of the best network and system administration tools. In particular, the SolarWinds Network Performance Monitor seem to consistently score among the top tools for network monitoring. And to make it even better, SolarWinds also makes several free tools, each addressing a specific task of network administrators. And when it comes to memory monitoring, SolarWinds makes no exception and offers at least two different tools to do the job.
First and foremost is the SolarWinds Memory Monitor Tool. This tool is only one of the many tools bundled as the Engineer’s Toolset. More about that in a moment. For now, let’s concentrate on the Memory Monitor Tool. This is a relatively simple tool. It will let you analyze memory utilization in real time and display information in tabular form. You can use it to view the current memory utilization alongside the total memory available.

Using this tool can help reduce network performance problems by tracking memory utilization in routers and other devices. If and when the memory utilization on a device reaches the user-defined threshold for a warning, the corresponding load bar will turn yellow. If a critical level is reached, the bar turns red. The SolarWinds Memory Monitor Tool will also record the peak load level and when it happened.
As we said, the SolarWinds Memory Monitor Tool is part of the Engineer’s Toolset, a bundle of over 60 different tools. And while some of the included tools can be obtained for free from SolarWinds, many are exclusive to the toolset. One nice feature of the toolset is how most of the tools are integrated into a common dashboard from where you can easily start any tool.
Price-wise, the SolarWinds Engineer’s Toolset (including the Memory Monitor Tool) sells for $1 495. This is the price per desktop installation and per named web user. You’ll need one such license per user of the tool. Considering all the included tools, it’s very reasonably priced. And if you want to give the toolset a test-run, a 14-day trial version can be obtained from the SolarWinds Website.
Other Components Of The SolarWinds Engineer’s Toolset

This SolarWinds Engineer’s Toolset includes some excellent dedicated troubleshooting tools. There tools such as Ping Sweep, DNS Analyzer and TraceRoute which can be used to perform network diagnostics and help resolve complex network issues quickly. And for the security-conscious among our readers, Some of the toolset’s tools can be sued to simulate attacks on your network and help identify vulnerabilities.
The SolarWinds Engineer’s Toolset also has some excellent monitoring and alerting features. It will monitor your devices and raise alerts when it detects availability or health issues. This can often give you time to react before users even notice there is a problem. And to make thing even better, you can use some of the included tools for configuration management and log consolidation.
Here’s a list of some of the other tools you’ll find in the SolarWinds Engineer’s Toolset.
- Port Scanner
- Switch Port Mapper
- SNMP sweep
- IP Network Browser
- MAC Address Discovery
- Ping Sweep
- Response Time Monitor
- CPU Monitor
- Interface Monitor
- TraceRoute
- Router Password Decryption
- SNMP Brute Force Attack
- SNMP Dictionary Attack
- Config Compare, Downloader, Uploader, and Editor
- SNMP trap editor and SNMP trap receiver
- Subnet Calculator
- DHCP Scope Monitor
- DNS Structure Analyzer
- DNS Audit
- IP Address Management
- WAN Killer
There are simply way too many tools included in the SolarWinds Engineer’s Toolset to mention them all. With a free 14-day trial available, download the bundle and see for yourself all that the toolset can do for you.
2. SolarWinds Server And Application Monitor (FREE Trial)
Next on our list is another great tool from SolarWinds, the SolarWinds Server and Application Monitor. This tool was designed to help administrators monitor servers, their operational parameters, their processes, and the applications they are running. This is a tool which can easily scale from very small networks to large ones with hundreds of servers–both physical and virtual–spread over multiple sites. The tool can also monitor cloud-hosted services like those from Amazon Web Services and Microsoft Azure. And of course, among the parameters that the tool will monitor is the servers’ memory utilization. It wouldn’t be on this list otherwise.

The SolarWinds Server and Application Monitor is very easy to set up and its initial configuration is just as easily done with the help of its auto-discovery process. Setup and configuration is a two-pass process. The first pass will discover servers, and the second one will find applications. The process can be sped up by supplying the tool with a list of applications to look for. Once the tool is up and running, its user-friendly GUI makes using the tool very easy. You can choose to display information in either a table or a graphic format.
Prices for the SolarWinds Server and Application Monitor start at $2 995 and vary based on the number of components, nodes, and volumes monitored. And like with most SolarWinds products, a free 30-day trial version is available for download, should you want to try the product before purchasing it.
3. PRTG
The Paessler Router Traffic Grapher, or PRTG in an excellent SNMP monitoring tool with lots of extra features. One of its primary selling points is its speed of installation. In fact, Paessler claims that PRTG can be set up in a couple of minutes. While this figure is debatable, this tool is still very easy and quick to set up. This is in part due to its auto-discovery feature that will scan your network to find devices and automatically add them to the tool. Then, further information on the detected devices can be retrieved using various communication protocols. The system uses a combination of Ping, SNMP, WMI, NetFlow, jFlow, sFlow, but can also communicate via DICOM or the RESTful API.
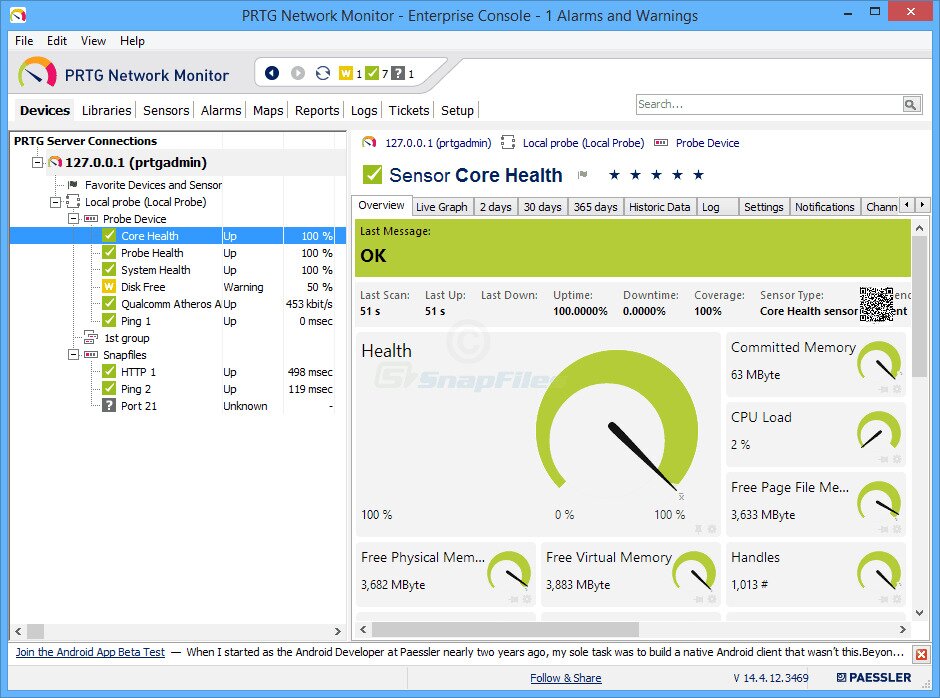
PRTG uses a concept called sensors which each monitor a specific type of data. There are obviously SNMP sensors–one for each monitored parameter–but also HTTP, SMTP/POP3 (e-mail) application sensors, hardware-specific sensors for switches, routers, and servers. Overall, PRTG has more than 200 different predefined sensors that retrieve statistics such as response time, processor utilization, memory load, operating temperature or system status.
PRTG comes with several user interfaces. In addition to an Ajax-based web interface, you can also opt for a Windows enterprise console or mobile apps for Android and iOS. Those mobile apps can use push notification for alerts triggered within PRTG. SMS or email notifications are also available, of course. Although the server only runs on Windows, it can be administered from any device with an Ajax-compatible browser.
PRTG is offered in two versions. The free version is full-featured but it will limit your monitoring ability to 100 sensors and each monitored parameter counts as one sensor. For example, if you monitor two interfaces on a router, it will count as two sensors. For more than 100 sensors, you need to purchase a license. They are priced based on the number of supported sensors and start at $1 600 for 500 sensors. A free, sensor-unlimited and full-featured 30-day trial version is also available.
4. ManageEngine OpManager
Next on our list is a product from ManageEngine which is also among the top makers of network administration tools. One such tool, and one of the company’s most popular products, is called the ManageEngine OpManager. This is another all-in-one package that will monitor the vital signs of networking devices, servers (both physical and virtual) and alert you as soon as something is out of range. It is, of course, perfectly suited for memory monitoring but if you start using this product, chances are you’ll soon want to monitor more than that.
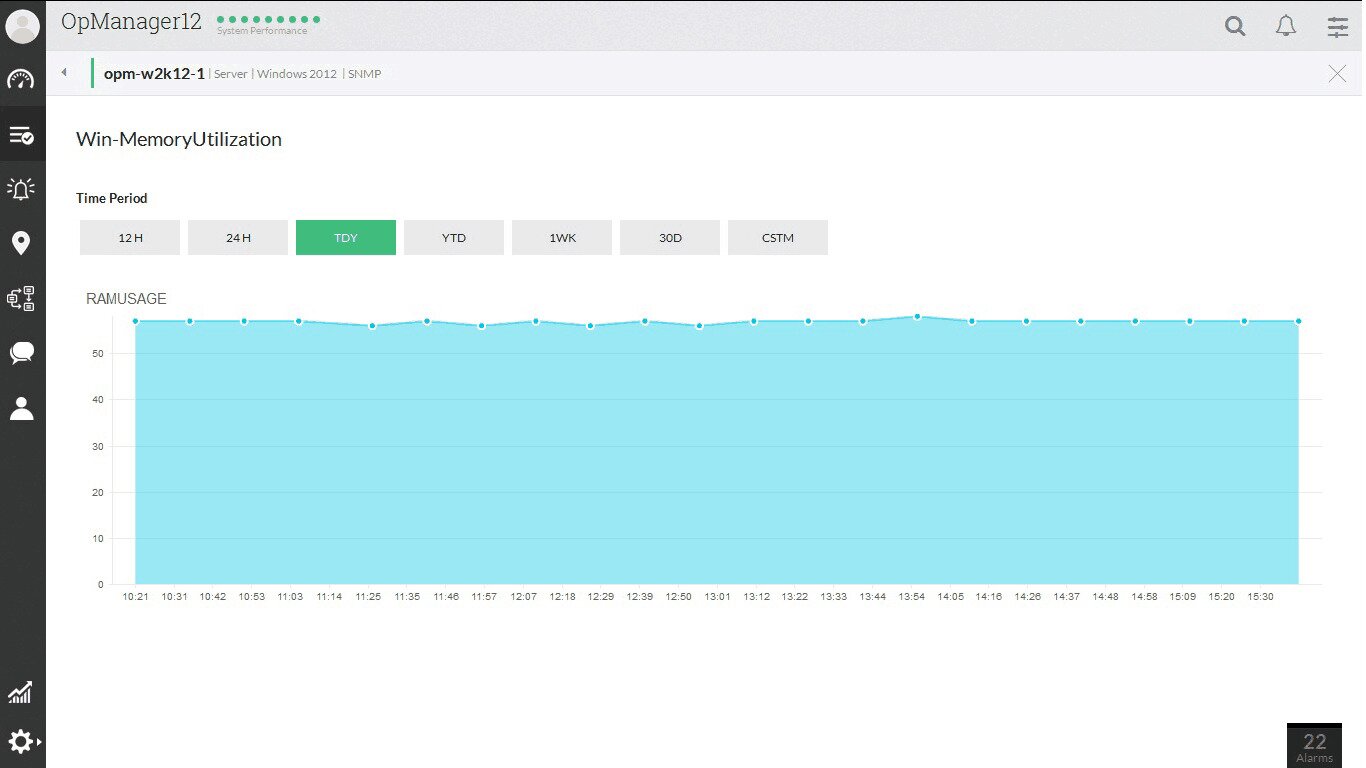
ManageEngine also claims its OpManager can be installed in less than two minutes. And again, this is more than likely an overstatement. Once installed, the tool will discover your devices and start monitoring them without requiring any complex configuration steps. The system boasts a very intuitive graphical user interface where you’ll easily find the information you need. Reports-wise, this tool has a full complement of excellent pre-built ones and you can also create custom reports to better suit your needs. Alerting in this product is excellent and at par with what you’ll find in competing products.
The ManageEngine OpManager is available in the Essential edition which is better sized for small and medium businesses with up to a thousand devices at prices starting just over $700 for 25 devices. For larger organizations, there’s an Enterprise edition which can scale up to ten thousand devices. Its price starts at under $20k for 500 devices. Prices for either edition vary according to the number of monitored devices and a free 30-day trial is available.
5. WhatsUp Gold
Our last entry for today is WhatsUp Gold from Ipswitch, another common name in the field of monitoring tools. This product, which once was just an up-or-down monitoring tool has since evolved into one of the best system and network monitoring platform. It has everything that’s expected from a full-fledged monitoring tool. You get the monitoring of operational parameters–including memory, of course–and you also get completely customizable alerting and reporting.
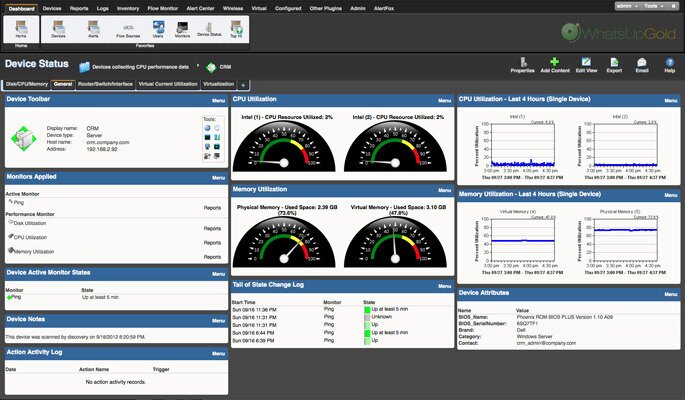
WhatsUp Gold is another tool that is rather easy to install, thanks to its auto-discovery engine which will find your devices and add them to the monitoring console. The tool can find physical servers, virtual servers, cloud servers, applications, and networking equipment. The tool’s dashboard features a map view where you can see the different component’s interconnections. And the map view is clickable for more information on each device.
WhatsUp Gold is available as a free version but that one is limited to monitoring only five devices. Paid licenses are available in three levels of increasing functionality. Licensing costs are based on the number of monitored devices. A free, time-limited trial version is also available