

7 Best Network Switch Monitoring Tools
Have you ever wondered why they put so many LEDs on the front panel of networking equipment? I sure have, and I never found an answer. Perhaps the networks that I managed were not typical but all of them had networking equipment hidden in server rooms or wiring closets where no one ever saw them. However, one of the tasks of network administrators is to keep a constant watchful eye on the equipment they manage. How can it be done? By using monitoring tools, of course. How else could you monitor something that’s in a remote location? Luckily, there are plenty of monitoring tools out there. Perhaps too many to make it easy to pick one that best suits your particular needs. We’re going to help you by reviewing some of the best switch monitoring tools.

We’ll start off by talking about monitoring, what it is and why it is useful. Then, we’ll have a look at two different types of network monitoring tools, As you’ll see, these tools don’t just monitor your network switches, they also monitor the traffic they handle. Without going too technical, we’ll also do our best to explain how the two main types of monitoring work. It will help you better appreciate our reviews of the best products. And talking about reviews, this is what we have next. We’ll first have a look at the bandwidth monitoring tools and then look at the flow analysis tools.
Monitoring Is Everything!
Monitoring network switches can mean different things to different people. To me, there are two primary components of monitoring these devices. First, you need to ensure that they are up and running and that their operational parameters are within an acceptable range. On top of that basic monitoring, you might also want to monitor the traffic that these devices handle. It is an excellent way of ensuring all is operating normally.
Network traffic is often compared to road traffic. Network circuits can be thought of as highways and the data they transport are like vehicles travelling on them. However, while car traffic is visible and any problem or congestion that happens is readily observable, seeing what’s going on on a network can be tricky. Network traffic is hidden within copper cables or glass fibres and is way too fast for anyone to see it.
Network monitoring tools are used to poll devices to get their operational metrics and to let you “see” exactly what data travels on your network.
Two Types Of Monitoring
Of the many types of network monitoring tools, two are of particular interest in the context of this post. Bandwidth utilization monitors are the most basic of these tools. They will read the network switches operational parameters such as CPU and memory loads and, more importantly, they will measure how much data is transported on each device interface.
The second type of tools we’ll look into is called flow analyzers. They will typically give yo much more details about the data carried on the networks. They don’t just tell you how much traffic is passing by, they tell you what type of traffic it is, where it’s coming from and where it’s going to.
Quantitative Monitoring
Most network monitoring tools rely on the Simple Network Management Protocol or SNMP to poll devices and read their operational metrics as well as the amount of traffic going through their interfaces. They can use the polled data to build graphs that depict the evolution of the monitored parameters over time. They will often let you zoom in into a short time span where graph resolution is high and shows, for instance, 5-minute average traffic or zoom out to a longer time span–often up to a month or even a year–where it shows daily or weekly averages.
SNMP Explained
The Simple Network Management Protocol it the most used technology to remotely monitor and networking equipment. Despite its name, implementing it can prove to be a complex task. SNMP-enabled network switches make a certain number of parameters available. Some are modifiable configuration parameters, allowing one to change them while others are read-only counters, used for monitoring purposes. There are, for example, CPU and memory usage gauges available via SNMP.
Monitoring bandwidth usage is a bit more elaborate. Two counters called bytes in and bytes out are read by the monitoring tool at precisely timed intervals. A typical network bandwidth utilization monitoring system will poll each device at 5 minutes intervals. It will then subtract the previous value of the counter from the current one to get the number of bytes transferred in five minutes. It will multiply that number by 8 to get the number of bits. And finally, it will divide it by 300 to get the bandwidth in bits per second.
Qualitative Monitoring
If you need to know more than the amount of traffic passing by, you need a more advanced monitoring system such as a flow analysis tool. These systems rely on software that’s built into the networking equipment’s firmware to send them detailed usage data. They can typically display top talkers and listeners, network usage by source or destination address, network usage by protocol or by application and several other useful information about what is going on.
Several flow analysis technologies exist but Cisco’s NetFlow is the most common of them. Furthermore, most other technologies, such as Juniper’s J-flow or NetStream on HP and Huawei equipment. There’s even an IETF standard protocol called IPFIX which is based on the latest version of NetFlow. Most flow analysis tools will support several—if not all—technologies.
Flow Analysis In A Nutshell
Originally created as a way of simplifying the creation of access control lists, NetFlow was developed by Cisco Systems where engineers quickly realized that the collected data could be put to a different use by exporting it to a device that can analyze the information.
NetFlow uses a three-component architecture. The exporter runs on the monitored device, aggregates packets into flows, and exports flow records to a flow collector. The flow collector handles the reception, storage and pre-processing of the flow data. Finally, the flow analyzer is used to analyze the flow data. Many systems combine the collector and analyzer in one device.
The Best Bandwidth Monitoring Tools
Because they are the most common monitoring tools and because they are likely to be the first you deploy, let’s start by reviewing the top bandwidth monitoring tools. All of them use SNMP to periodically poll your network—and other—devices, and create graphic gauges and bandwidth utilization graphs, giving you some visibility on the status of your equipment and the network’s usage.
1. SolarWinds Network Performance Monitor (Free Trial)
SolarWinds enjoys a solid reputation for making some of the best network and system administration tools. Many of the company’s products have received rave reviews and are considered among the very best in their respective fields. But SolarWinds is also famous for its free tools, smaller tools which address a specific need of network administrators. Two good examples of those free tools are the Real-time Bandwidth Monitor and the Kiwi Syslog Server.
The SolarWinds Network Performance Monitor (NPM), it is primarily an SNMP monitoring tool. At its core, it offers comprehensive fault monitoring and performance management using SNMP and it is thereby compatible with most equipment. It also comes with many advanced features such as its NetPath feature lets you view the critical network path between any two monitored points on your network. It can also automatically generate intelligent network maps.

Other features of the NPM include advanced alerting and the tool’s PerfStack performance analysis dashboard. The Network Insights functionality is another advanced feature which allows for complex device monitoring. The tool can monitor Software Defined Networks (SDN) and has built-in Cisco ACI support as well the ability to monitor wireless networks and to generate network performance baselines. The SolarWinds Network Performance Monitor is a highly scalable tool that can be used on any network from the smallest to the largest.
The SolarWinds Network Performance Monitor’s pricing structure is quite simple. Licensing is based on the number of monitored elements. Five licensing tiers are available for 100, 250, 500, 2000, and unlimited elements at prices ranging from $2 955 to $32 525, including the first year of maintenance. If you’d rather give the tool a test run before committing to a purchase, a free 30-day trial version can be obtained.
2. PRTG Network Monitor
The PRTG Network Monitor from Paessler AG is another great product. It is, at its base, an SNMP monitoring tool. However, thanks to a concept called sensors—which can be thought of as add-ons that are already built into the product—additional metrics can be monitored. There are a couple hundred sensors available with the product. Installation speed is another strength of the product. According to Paessler, you can set it up in a couple of minutes.
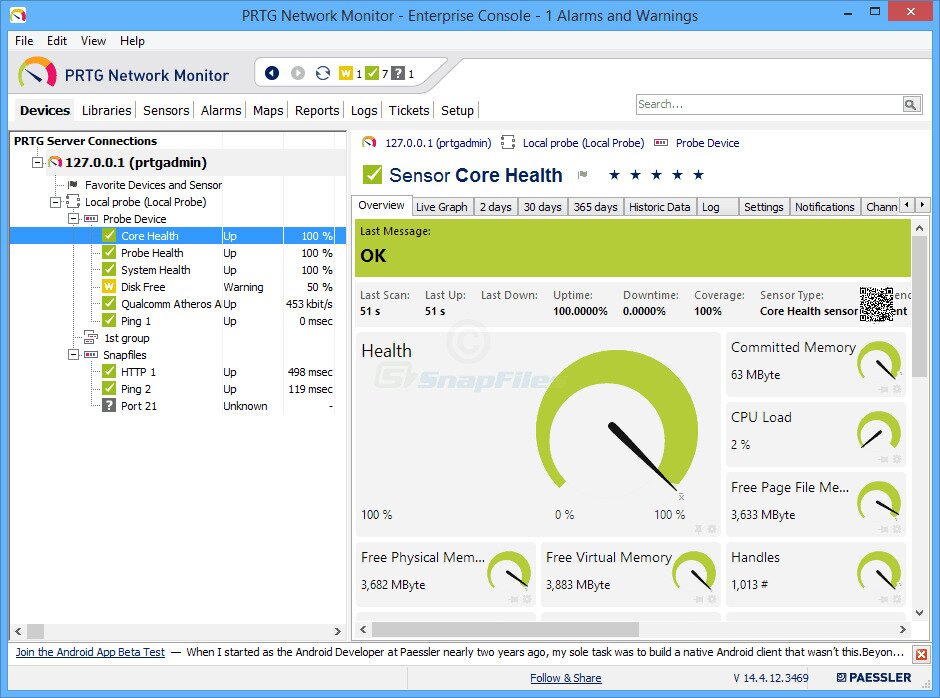
The PRTG Network Monitor is a feature-rich product. It lets you choose between a native Windows enterprise console, an Ajax-based web interface as well as mobile apps for Android and iOS. Alerting and reporting are excellent and the product boasts a wide range of reports that can be viewed as HTML or PDF or exported to CSV or XML to be processed externally.
The PRTG Network Monitor is available in a free version that will limit your monitoring to 100 sensors. Each parameter you want to monitor counts as one sensor. For example, monitoring bandwidth on each port of a 48-port switch will require 48 sensors and monitoring the CPU and memory on that same switch will use up 2 more. For more than 100 sensors you’ll need a paid license which starts at $1 600 for up to 500 sensors, including the first year of maintenance. A free 30-day trial version is also available.
3. ManageEngine OpManager
The ManageEngine OpManager is a complete management solution that will address most monitoring needs. The tool can run on either Windows or Linux and it is loaded with excellent features. For instance, its auto-discovery feature can graphically map your network, giving you a uniquely customized dashboard.
The tool’s dashboard is another one of its strong points. It is super easy to use and navigate and has drill-down functionality. If you’re into mobile apps, they are available for tablets and smartphones and will allow you to access the system from anywhere. Overall, this is a very polished and professional product.
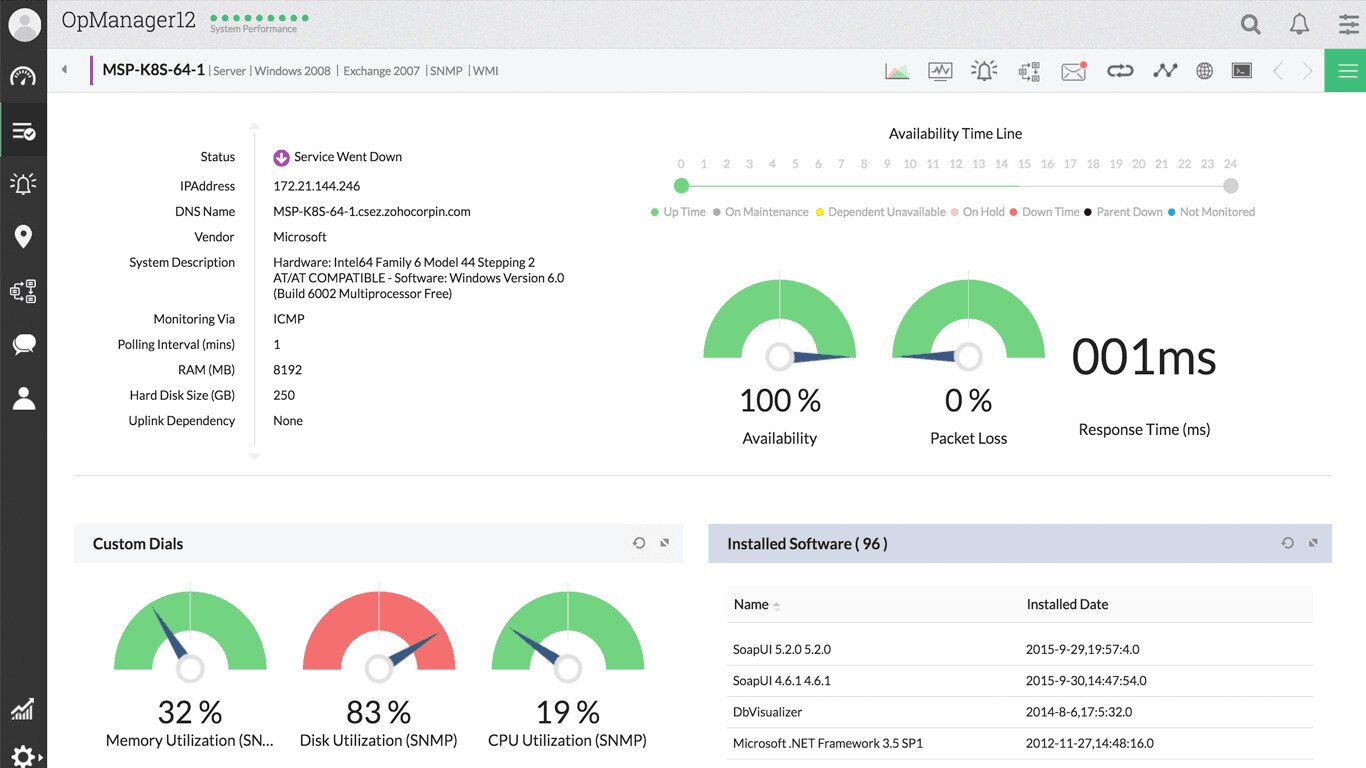
Alerting in OpManager is another of the product’s strengths. There is a full complement of threshold-based alerts that will help detect, identify, and troubleshoot network issues. Multiple thresholds with various notifications can be set for every performance metric.
If you want to try the ManageEngine OpManager, get the free version. It is not a time-limited trial version. It is, instead, feature-limited. It won’t, for instance, let you monitor more than ten devices. While this might be sufficient for testing purposes, it will only suit the smallest networks. For more devices, you can choose between the Essential or the Enterprise plans. The first will let you monitor up to 1 000 nodes while the other goes up to 10 000. Pricing information is available by contacting ManageEngine’s sales.
4. Cacti
Cacti is one of the most used free and open-source monitoring systems. It might not be as feature-rich as some commercial products but, given its price, it a great tool. Aside from MRTG–which is the mother of all network monitoring tools and a distant parent, Cacti is possibly the oldest monitoring tool still around. The simple fact that it is still in widespread use today is a testament to its value.
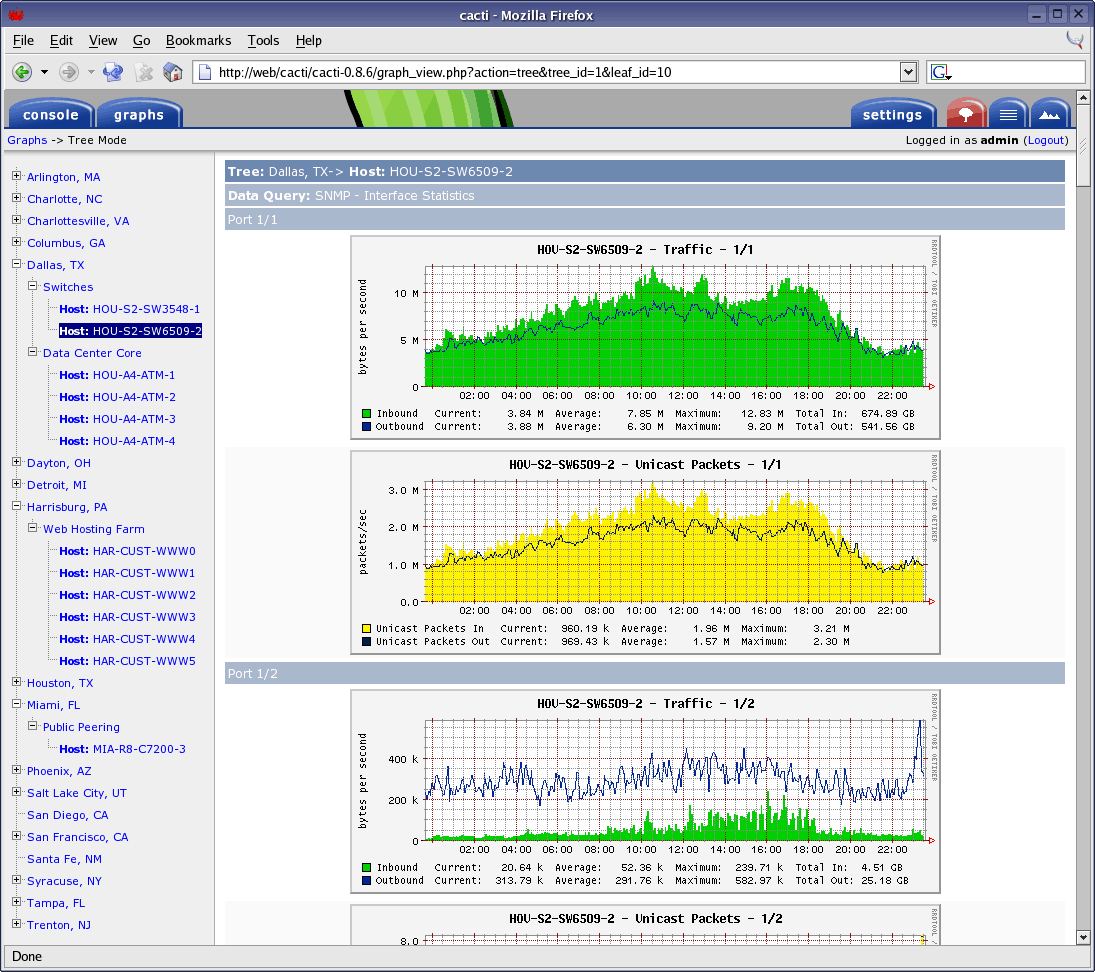
Cacti dates back to 2004 and it originally was meant as a web front-end to RRD tool, the logging and graphing component of MRTG. The tool’s main components are a fast poller, advanced graph templating, and multiple data acquisition methods. Cacti also features customizable user access control where users can be configured to have access to a different set of graphs. This can be useful for large deployments with multiple support teams. The tool also boasts an easy to use albeit somewhat antiquated web-based interface. It can scale from a small business or home LANs to complex networks with thousands of devices on multiple sites.
Cacti is primarily written in PHP, making it easy to modify to suit your needs. It has built-in templates for several types of devices which already include most of the elements you might want to monitor. Cacti is such a popular tool—even today—that many device-specific templates can be downloaded either from device manufacturers’ websites or from community-driven Cacti forums.
The Best Flow Analysis Tools
While SNMP monitoring systems will show you the important metrics of your devices and how much your network is used, it won’t tell you how it is used. For that, you need the next level of monitoring systems, flow analysis tools. These tools use NetFlow and its variants to gather detailed information about what traffic is being transported on your network. Here are the best flow analysis tools we could find.
5. SolarWinds NetFlow Traffic Analyzer (Free Trial)
The SolarWinds NetFlow Traffic Analyzer can monitor network usage by application, protocol, and IP address group. It will monitor NetFlow devices and also J-Flow, sFlow, NetStream, and IPFIX. The tool collects flow data, arranges it into a usable and meaningful format and present it to users in a web-based interface. It can be used to identify which applications and categories consume the most bandwidth. It is one of the best NetFlow collector and Analyzer you can find.

Here are some of the product’s best features.
- The SolarWinds NetFlow Traffic Analyzer can monitor Bandwidth use by application, protocol, and IP address group.
- It can monitor Cisco NetFlow, Juniper J-Flow, sFlow, Huawei NetStream, and IPFIX flow data to identify which applications and protocols are the top bandwidth consumers.
- It collects traffic data, correlating it into a useable format, and presenting it to the user in a web-based interface for monitoring network traffic.
- It Identifies which applications and categories consume the most bandwidth for better network traffic visibility with Cisco NBAR2 support.
The SolarWinds NetFlow Traffic Analyzer is an add-on to the Network Bandwidth monitor. You can save by acquiring both at the same time as the SolarWinds Network Bandwidth Analyzer Pack. Prices start at $4 910 for monitoring up to 100 elements and vary according to the number of monitored devices. While this may seem a bit expensive, keep in mind that you’re getting not one but two of the best monitoring tools available. If you’d prefer to try the product before purchasing it, a free 30-day trial can be downloaded from SolarWinds.
6. Scrutinizer
Scrutinizer from Plixer is not just a flow analysis system. It has the ability to monitor different flow types such as NetFlow, J-flow, NetStream, and IPFIX so you’re not limited to monitoring only Cisco devices. The tool offers efficient data collection and can easily scale up to many million flows per second. It works in both physical and virtual environments and comes with advanced reporting features.
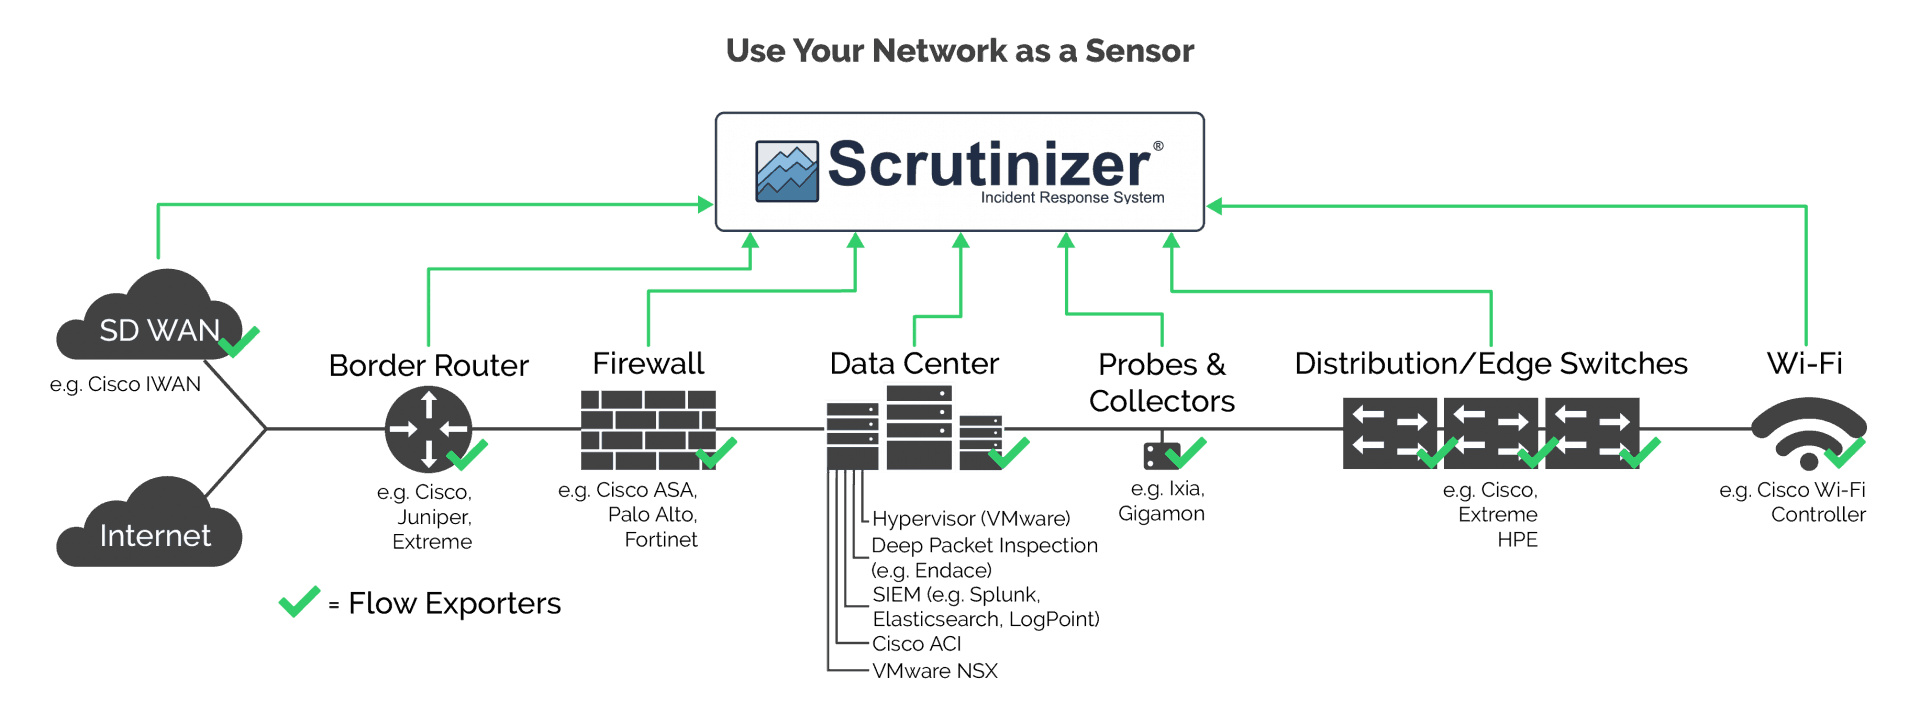
Scrutinizer is available in many versions from the basic free version to the full-fledged “SCR” level which can scale up to over 10 million flows per second. The free version is limited to 10 thousand flows per second and it will only keep raw flow data for 5 hours but it should be more than enough to troubleshoot network issues. A free 30-day trial is available for all the paid versions. And after the trial period is over, it will revert back to the free version.
7. ManageEngine NetFlow Analyzer
The ManageEngine NetFlow Analyzer has a web-based interface that offers an impressive number of different views on your network. You can view traffic by application, by conversation, by protocol, and several more options. You can also set alerts. For example, you could set a traffic threshold on a specific interface and be alerted whenever traffic exceeds it.
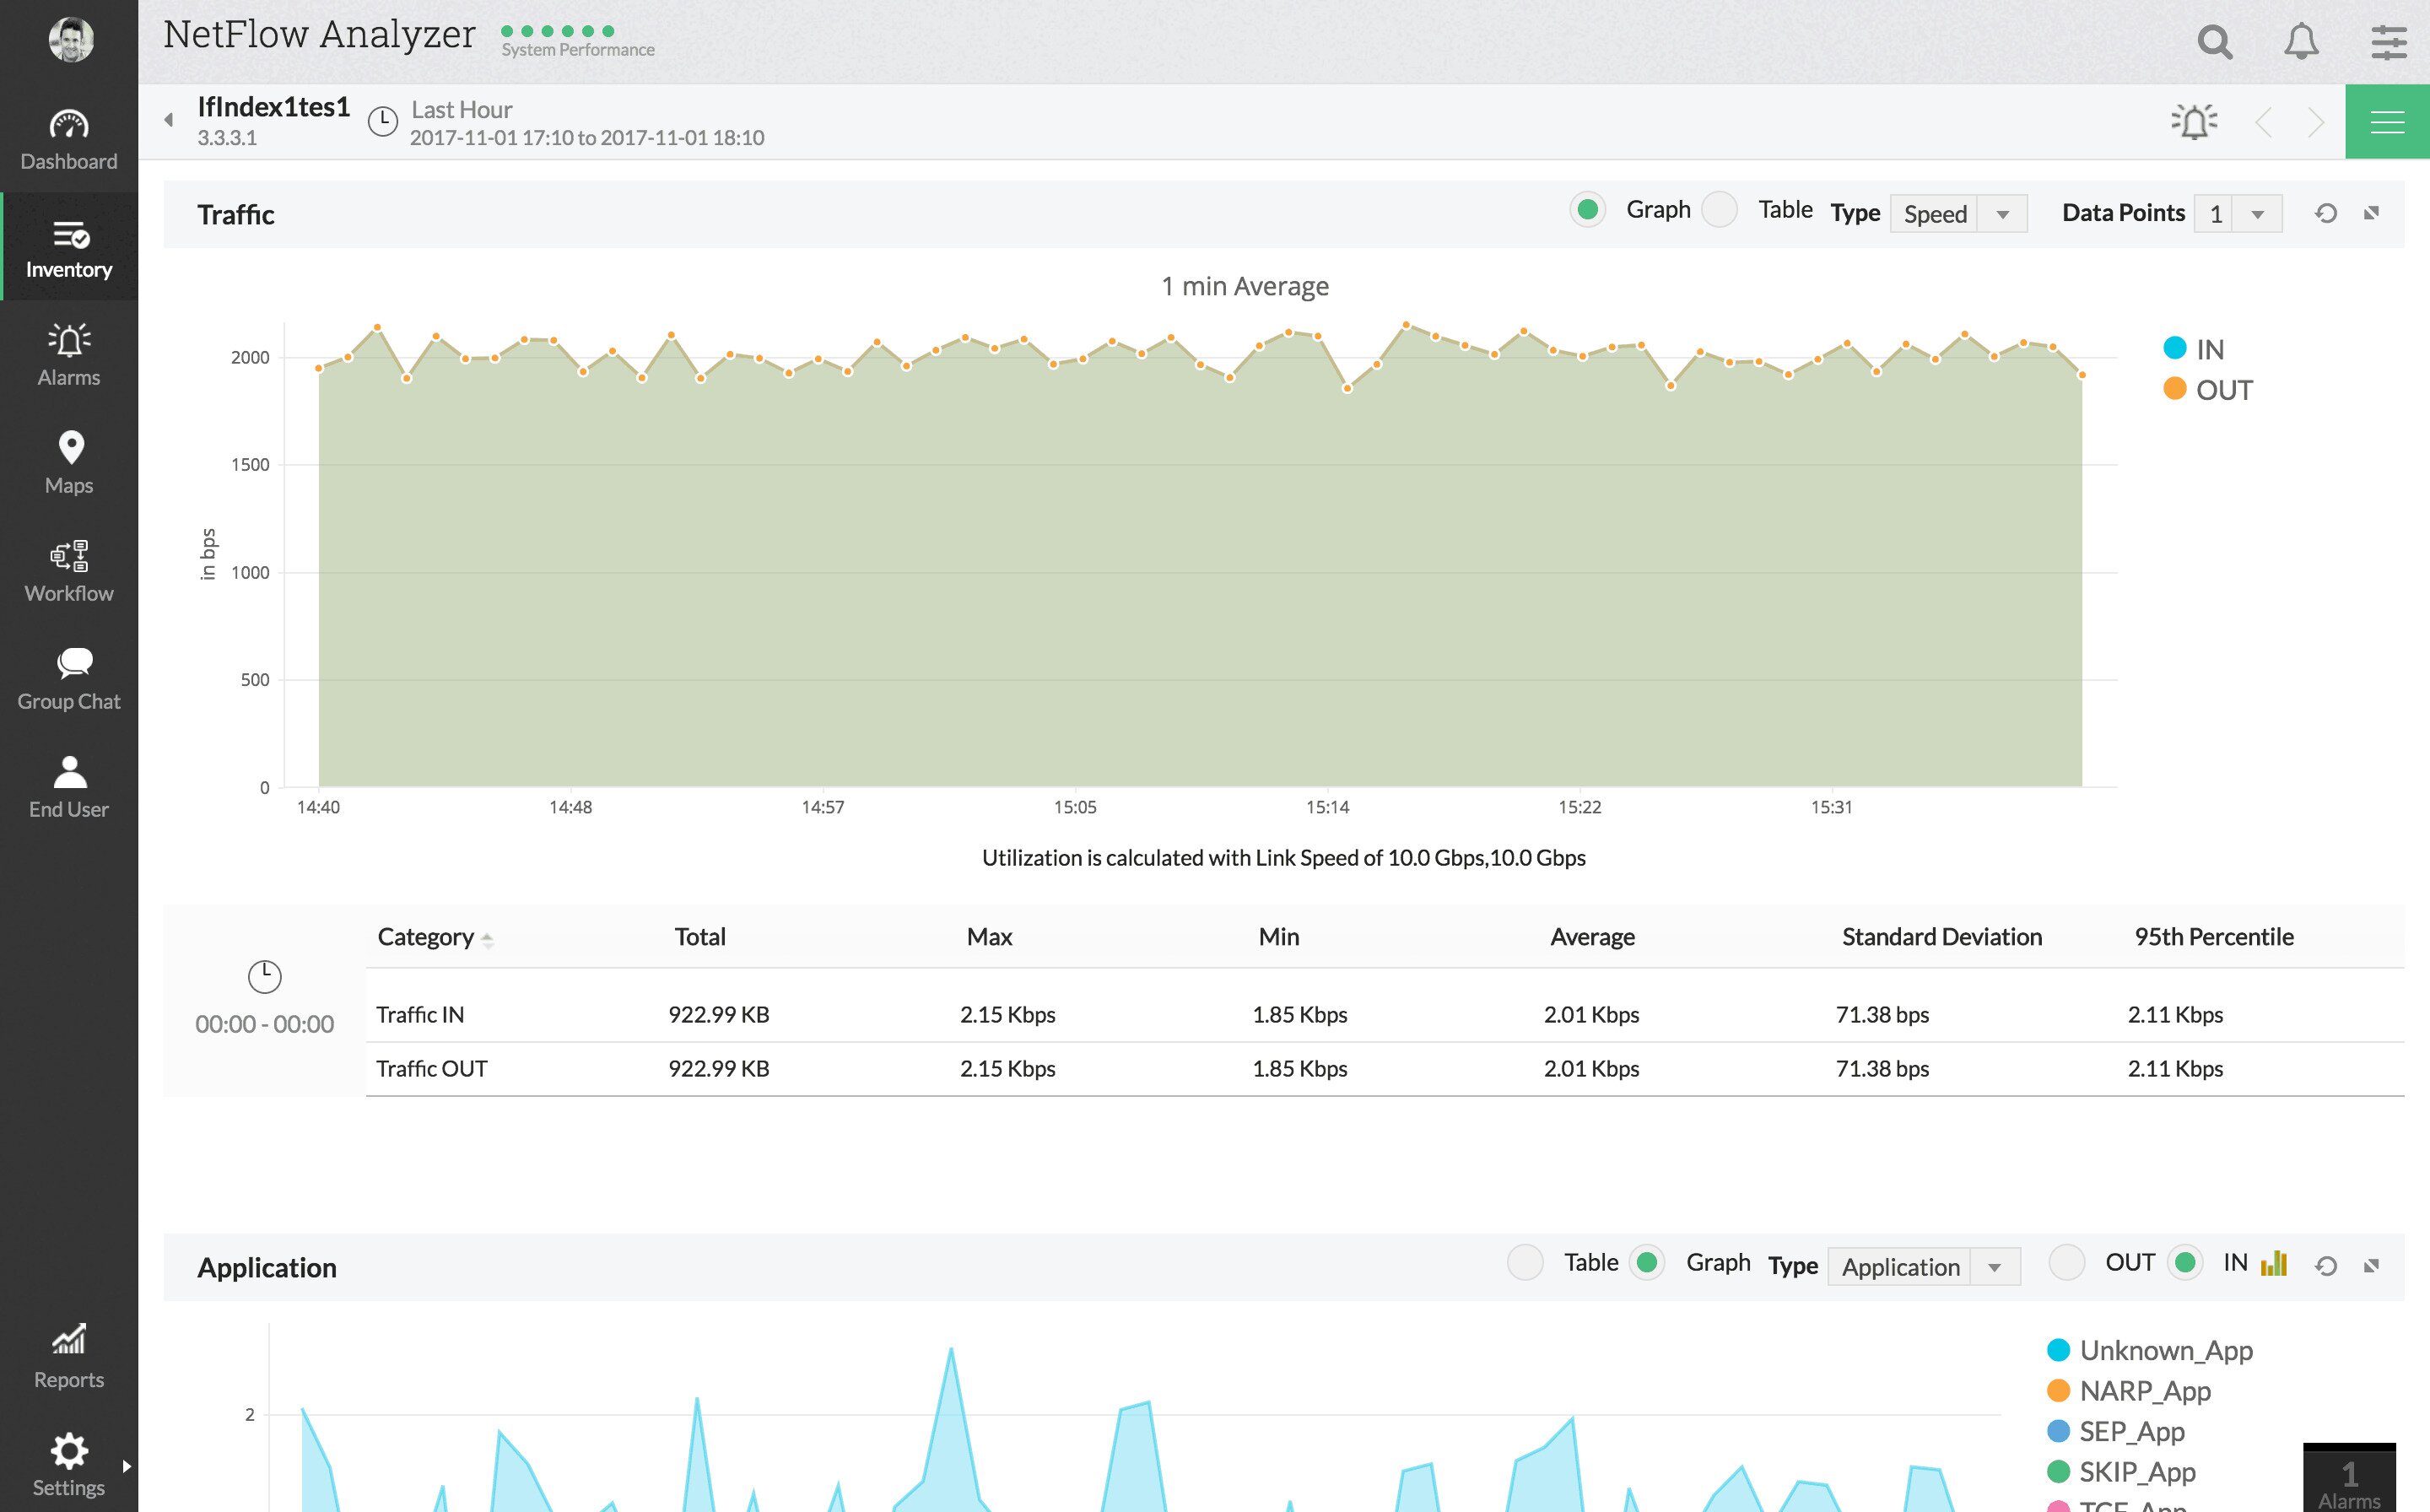
The tool’s dashboard includes several pie charts showing top applications, top protocols or top conversations. It can also display a “heat map” with the status of the monitored interfaces. Dashboards and reports can be customized to include only the information you need. The tool’s dashboard is also where alerts are displayed in the form of pop-ups. A smartphone app that will let you access the dashboard and reports from anywhere.
The ManageEngine NetFlow Analyzer supports most flow technologies including NetFlow, IPFIX, J-flow, NetStream and a few others. The product is available in two versions. The free version is identical to the paid one for the first 30 days but it then reverts to monitoring only two interfaces or flows. For the paid version, licenses are available in several sizes from 100 to 2 500 interfaces or flows.