

6 Best SQL Server Monitoring Software Tools for 2026
Data is omnipresent and forms the backbone of many organizations. The larger the organization, the more data it accumulates and the more crucial it becomes. This data is primarily stored in databases, with SQL databases being the most common type. The data stored in SQL databases often represents an organization’s most valuable asset. Therefore, it is essential to ensure that SQL servers are always operating at their maximum potential. As an administrator, one method to achieve this is by utilizing an SQL server monitoring tool.
These tools, such as the SQL Server Monitoring Tool, SolarWinds Database Performance Analyzer, Paessler PRTG, Idera Diagnostic Manager For SQL Server, SQL Power Tools, and SQL Sentry, provide constant surveillance of your SQL databases and alert you to any irregularities. However, the vast array of products available can make selecting the right one a daunting task. To simplify this process, we have compiled a list of some of the best SQL server monitoring tools and will be reviewing them.
But before we review the SQL server monitoring tools that we’ve found, we’ll briefly pause and talk about SQL. We’ll try to explain what it is, where it’s coming from, and why it is now so prevalent. Then, we will discuss the monitoring of SQL databases, how it’s done, and what can be monitored. This will help us be all on the same page as we review the products. With all that behind us, we’ll explore the core of the matter and review some of the very best SQL server monitoring software on the market.
About SQL
There is a common misconception about SQL. Many think of it as a type of relational database where it actually is a language used to query them rather than the databases themselves. The SQL acronym stands for Structured Query Language, and this is really what SQL is. By extension, we commonly refer to relational database management systems that support the language or one of its variants as SQL databases. This is also what we’ll do today.
Most modern enterprise-grade relational database management systems use the SQL language. It is, therefore, no exaggeration to say that SQL databases are almost everywhere. All the top database management systems, such as Oracle, IBM DB2, Microsoft SQL Server, MySQL, Microsoft Access, and many more, use SQL. In fact, it is because the use of SQL as the query language of databases has become so prevalent that we commonly refer to a Relational Database Management System as an SQL database.
SQL Server Monitoring
If data is everything to an organization, monitoring is everything to a network administrator. Modern networks are big and complex and are comprised of so many components that you simply can’t keep an eye on everything. This is one of the main reasons why monitoring tools have become such an essential part of network administration.
As for SQL server monitoring, it is very similar to monitoring any other component. The primary goal of SQL server monitoring is simply ensuring data is available when needed. While a database and the data it contains can be somewhat of an abstract concept, it is made of concrete elements. Accordingly, database and SQL server monitoring tools must always ensure that all those elements—from hardware to software—are not only working but also operating within their normal range.
The most basic element of an SQL server is the server it runs on. Like any server, there are many operational parameters worth monitoring. For instance, CPU load, available memory, or processor core temperature are all interesting parameters. Monitoring the server running a database is exactly the same as monitoring any other server.
The underlying operating systems are another element that is worth monitoring. Regardless of what operating system the SQL server is running on, there are several important parameters to be monitored, such as disk space or disk usage, for example. Just like hardware monitoring, the OS-level monitoring of a SQL server is not different from that of any other server.
The last thing that needs monitoring is the actual SQL server. I mean, the Relational Database Management System software. At its core, a SQL server is just another piece of software running on the server. The most basic monitoring, then, is to ensure that this specific software or service is running at all times. However, many tools go further than that. Some, for instance, will check the structure of databases, while some will measure their response time. A typical SQL server has a couple of handfuls of parameters that can be monitored to your benefit.
The Best Tools For Monitoring SQL Servers
While looking for the very best SQL server monitoring tools, we found many different products that we thought deserved giving them a closer look. While all the products on our list can monitor SQL servers, several can monitor more. We’ve actually included various tools on our list to give you an idea of the variety that is available.
1. SolarWinds Database Performance Analyzer (FREE TRIAL)
SolarWinds is one of the best-known makers of network and system administration tools and offers robust SQL server monitoring software capabilities. With a broad array of tools covering almost every topic, many administrators have at least heard of the company. Its flagship product, the Network Performance Monitor, consistently scores among the best network bandwidth monitoring tools. SolarWinds, as if the above was not enough, is also famous for its free tools, each addressing a specific need of network administrators.
The SolarWinds Database Performance Analyzer (DPA) monitors and analyzes your SQL database instances. The system uses a Response Time Analysis method, which puts the primary focus on the time between a query request and the corresponding response from the database and analyzes wait types and events to pinpoint the bottlenecks of databases.

The SolarWinds SQL server monitoring tools provides an easy-to-use interface that will assist you in finding issues quickly and easily. But as good as it is a troubleshooting tool (and it is great), it’s also an excellent monitoring tool. Its main screen lets you visualize database instances, wait times, query advice, CPU (with warning and critical alerts), memory, disk, and sessions.
The trend dashboard of any specific database instance shows you in a graphical format the total wait times (or your choice of average or typical day wait times) for users over the course of a month, with each color representing an individual SQL statement. This gives you a visually appealing representation of which statement takes the longest to run.
The are enough features in the SolarWinds Database Performance Analyzer that we could write a whole post about it. For now, Let’s have a look at some of the most important.
Single Point Of Monitoring For All Your Databases
The SolarWinds Database Performance Analyzer works with Microsoft SQL servers as well as most major databases, including Oracle, MySQL, DB2, and ASE. It also supports physical, on-premises servers, Virtual Machines (running under Vmware or Hyper-V) and cloud-based databases.
Highly Scalable
Monitor as many database instances as you need. The DPA easily scales from one to a thousand instances. You just need to upgrade the license.
Monitoring Of All Active Sessions
The tool’s native polling engine records everything that’s happening within your database instances with no additional load to the database itself and without requiring a local monitoring agent. This dramatically reduces—if not eliminates—the risk that the tool could impact the databases’ performance.
Tracking, Monitoring, And Analysis Of Database Components
This tool automatically correlates queries, users, files, plans, objects, wait times, storage, and date/time/hour/minute to accurately discover and diagnose problems on the fly.
Database Tuning Advice
The DPA can give you sound advice for tuning individual database instances to make sure they run at their peak performance. The tool will analyze all parameters of an instance and recommend a course of action to optimize certain queries or even whole database instances.
Prices for the SolarWinds Database Performance Analyzer start at $1,275 and vary according to the number and type of database instances to monitor. If you want to try the product before purchasing it, a fully functional 14-day trial version is available.
2. Paessler PRTG
The Paessler Router Traffic Grapher (PRTG) is a well-known all-in-one monitoring platform that offers SQL server monitoring tools and can monitor most systems, devices, traffic, and applications in your IT infrastructure. The tool comes with several client interfaces to choose from. There’s a Windows enterprise console, an Ajax-based web interface, and mobile apps for Android, iOS, and Windows Phone. The tool is known to be one of the quickest and easiest to install, with Paessler claiming you could start monitoring within 2 minutes.
One of PRTG’s best features is auto-discovery, which will scan your network and automatically recognize a wide range of devices and systems, creating appropriate sensors from predefined device templates. The tool has a map feature that will let you create custom maps with your monitoring data superimposed, offering a unique way of displaying it. When it comes to alerts, PRTG is highly flexible and customizable. The mobile client apps allow you to get push notifications directly to your device. You can also set up notifications via email or SMS, and there’s a powerful API that lets you write your own notification scripts.
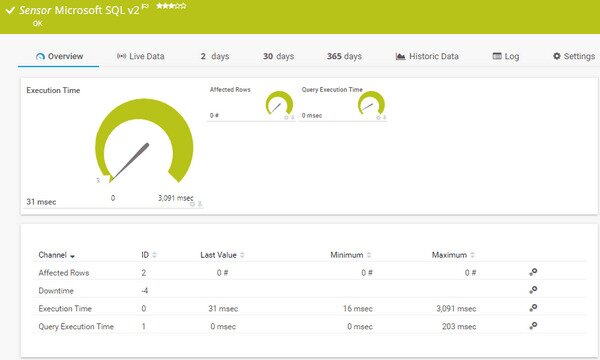
PRTG can monitor anything there’s a sensor for. You can think of sensors as add-ons, although, in the case of this tool, they’re already built-in. Pre-configured database sensors are available out of the box. Most database engines are supported, including Microsoft SQL, MySQL, Oracle, and PostgreSQL. The tool will let you monitor the execution time of a SQL query by measuring the time taken from the moment the connection is established to the end of the connection. It will let you clearly see how your databases perform under pressure.
The PRTG SQL server monitoring software is available in a full-featured free version, which will limit your monitoring ability to 100 sensors, with each parameter counting as one sensor. For instance, monitoring a SQL server requires one sensor per database instance. For more than 100 sensors, a license is necessary. Their prices vary according to the number of sensors and start at $1,600 for 500 sensors. A free, fully-featured 30-day trial version, which allows for unlimited sensors, is available, but it will revert back to the 100 sensors free version once the trial period is over.
3. Idera Diagnostic Manager For SQL Server
Don’t let the Idera Diagnostic Manager for SQL Server’s name fool you. This is primarily SQL server monitoring software that watches over the performance of SQL databases. It provides performance statistics, metrics, and alerts from physical servers as well as virtual machines and their underlying host hardware. The tool can monitor numerous parameters such as CPU, memory, hard disk usage and space, and network usage. Proactive monitoring of SQL queries is also included, along with transactional SQL monitoring. Furthermore, the tool can provide recommendations for the health of SQL databases.
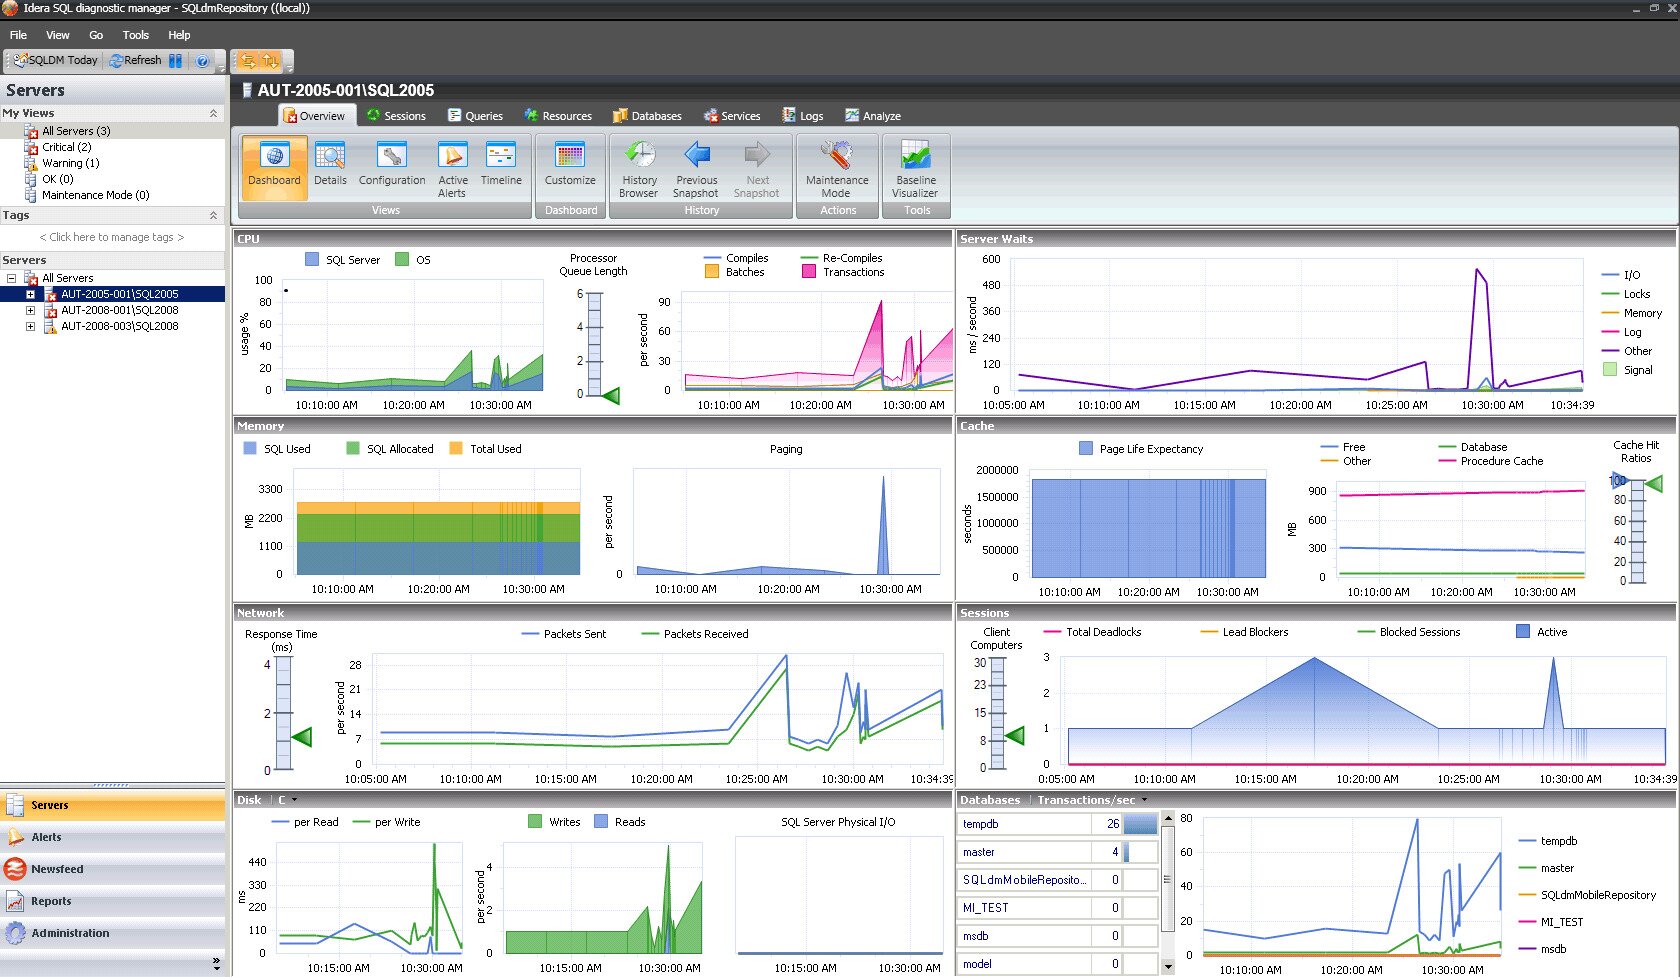
For user interaction, there’s a choice of a web-based interface and mobile apps for Android, iOS, and Blackberry phones and tablets. The tool provides both real-time and historical data about SQL server instances, letting administrators make changes on the fly within the mobile app. Other tasks that can be performed from the feature-reduced mobile apps include viewing and killing processes, starting and stopping jobs as needed, and running queries.
Other features of Idera Diagnostic Manager for SQL Server include easy integration with SCOM using the Management Pack add-on, a predictive alerting system built to avoid any false alerts, and an excellent query performance monitoring function that can pinpoint queries that are not efficient and performing poorly.
Prices for the Idera Diagnostic Manager for SQL Server start at $1,996 per database instance, and a fully functional 14-day trial is available.
4. SQL Power Tools
SQL Power’s SQL server monitoring tools offer an agentless database performance analysis solution whose publisher claims it has the lowest impact on your servers. It is said that monitoring with SQL Power Tools won’t load your databases by more than 1%. Also, the product inserts no table and no stored procedure in the database. All analysis is done completely remotely. It especially won’t load your servers with millions of queries, which could seriously affect their performance. And by virtue of being agentless, you don’t need to install any monitoring component on your servers.
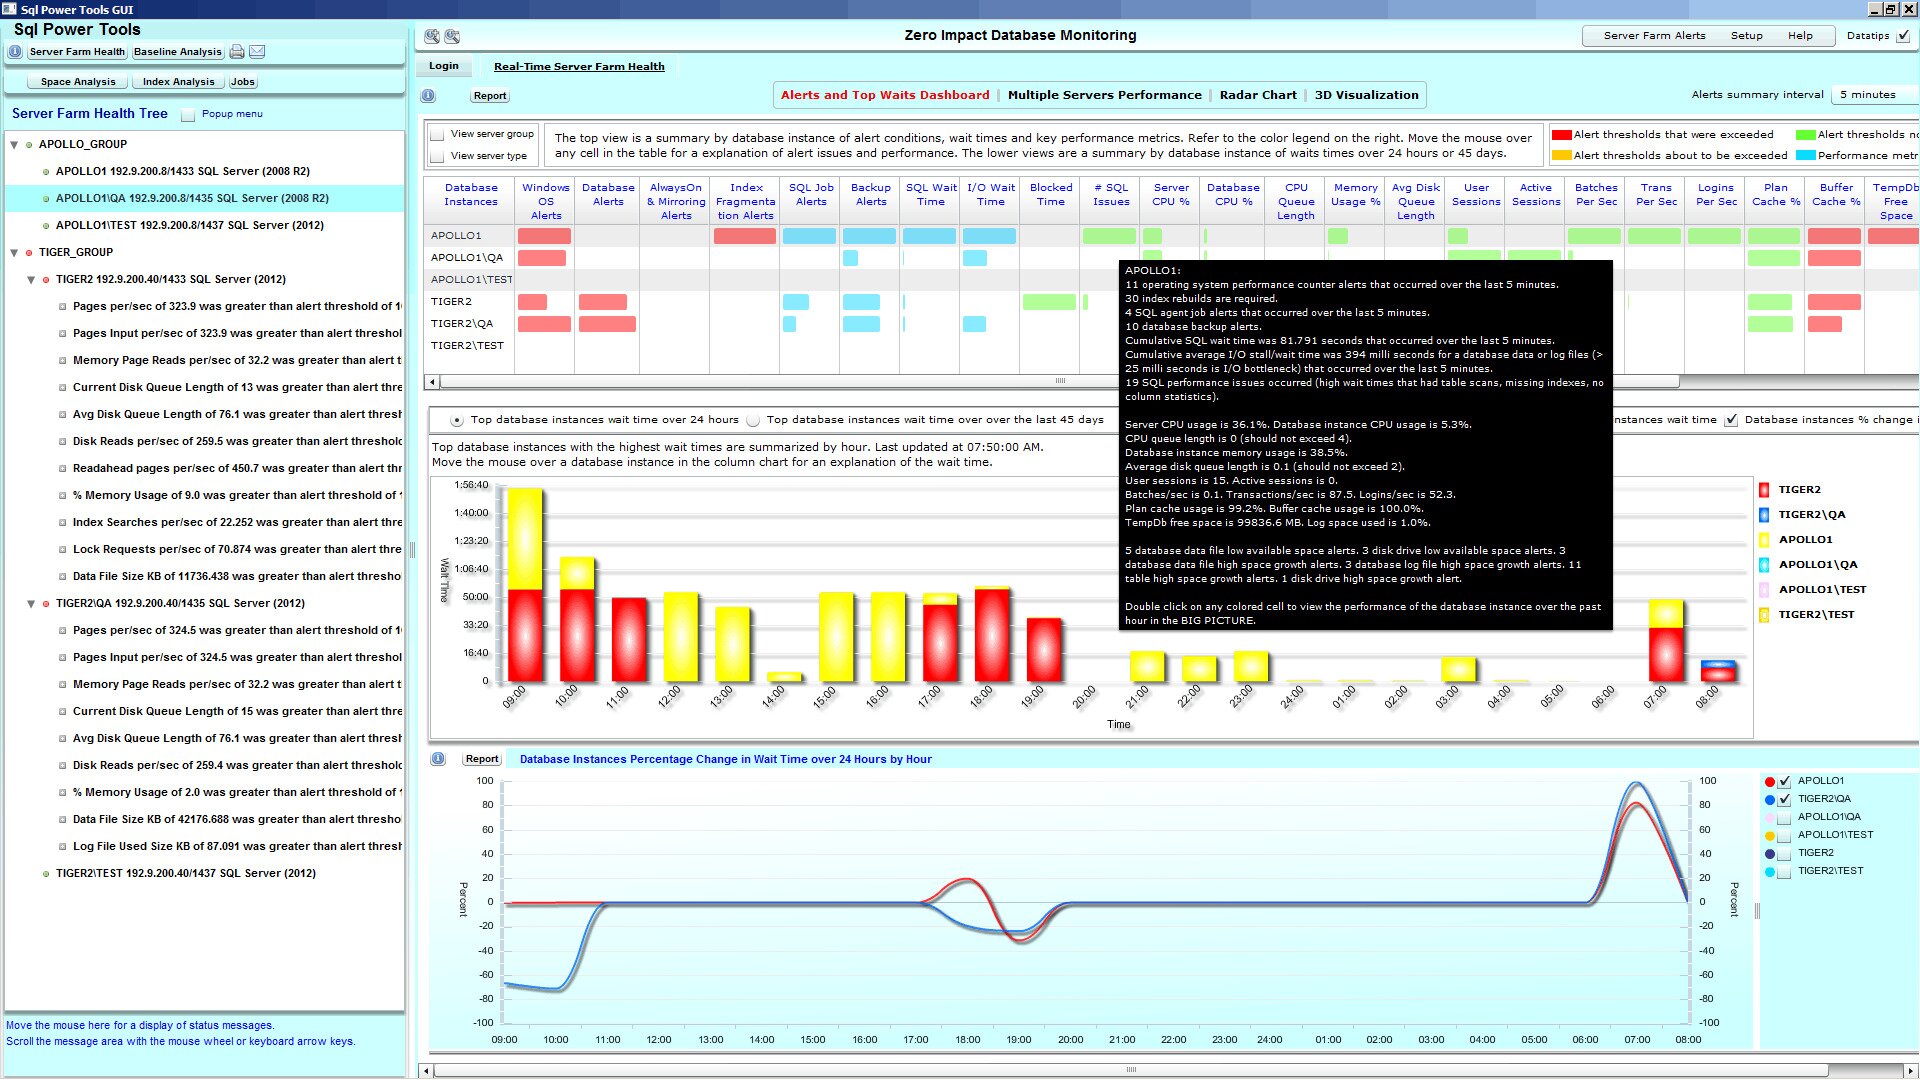
This SQL server monitoring software is packed with features. It has both dashboard and heat map views of your server farm performance, which can be viewed from a browser or a mobile device. The platform computes a daily baseline analysis of SQL wait times, performance counters, and job run times. It can also perform an instant comparison of SQL and I/O wait times, performance counters, and job run times between servers and time periods. The tool allows you to drill down into the SQL wait times of poorly performing queries, helping you pinpoint resource contention, which can be causing them not to be completed on a timely basis.
The price of SQL Power Tools varies between $2,000 and $750 per database instance, depending on how many you purchase simultaneously. If you prefer to try the product, a 3-week evaluation version can be obtained by contacting SQL Power.
5. SQL Monitor (Red Gate)
SQL Monitor from Red Gate Software can be used to monitor, manage, change, manipulate, and optimize SQL databases, making it a solid SQL server monitoring software. It will help find issues before they become problems. Feature-wise, a lot can be said about the product. First, it provides administrators with an overview of their SQL server farm. The tool also features powerful alerting capabilities, letting you know about issues before they have a chance to have any noticeable impact. Reporting is another place where SQL Monitor shines. It will generate tailored reports about your servers’ health. Furthermore, the tool’s performance analysis capabilities allow you to quickly see what has the biggest impact on your system. As a diagnostic tool, this feature can help you uncover obstacles and find root causes.
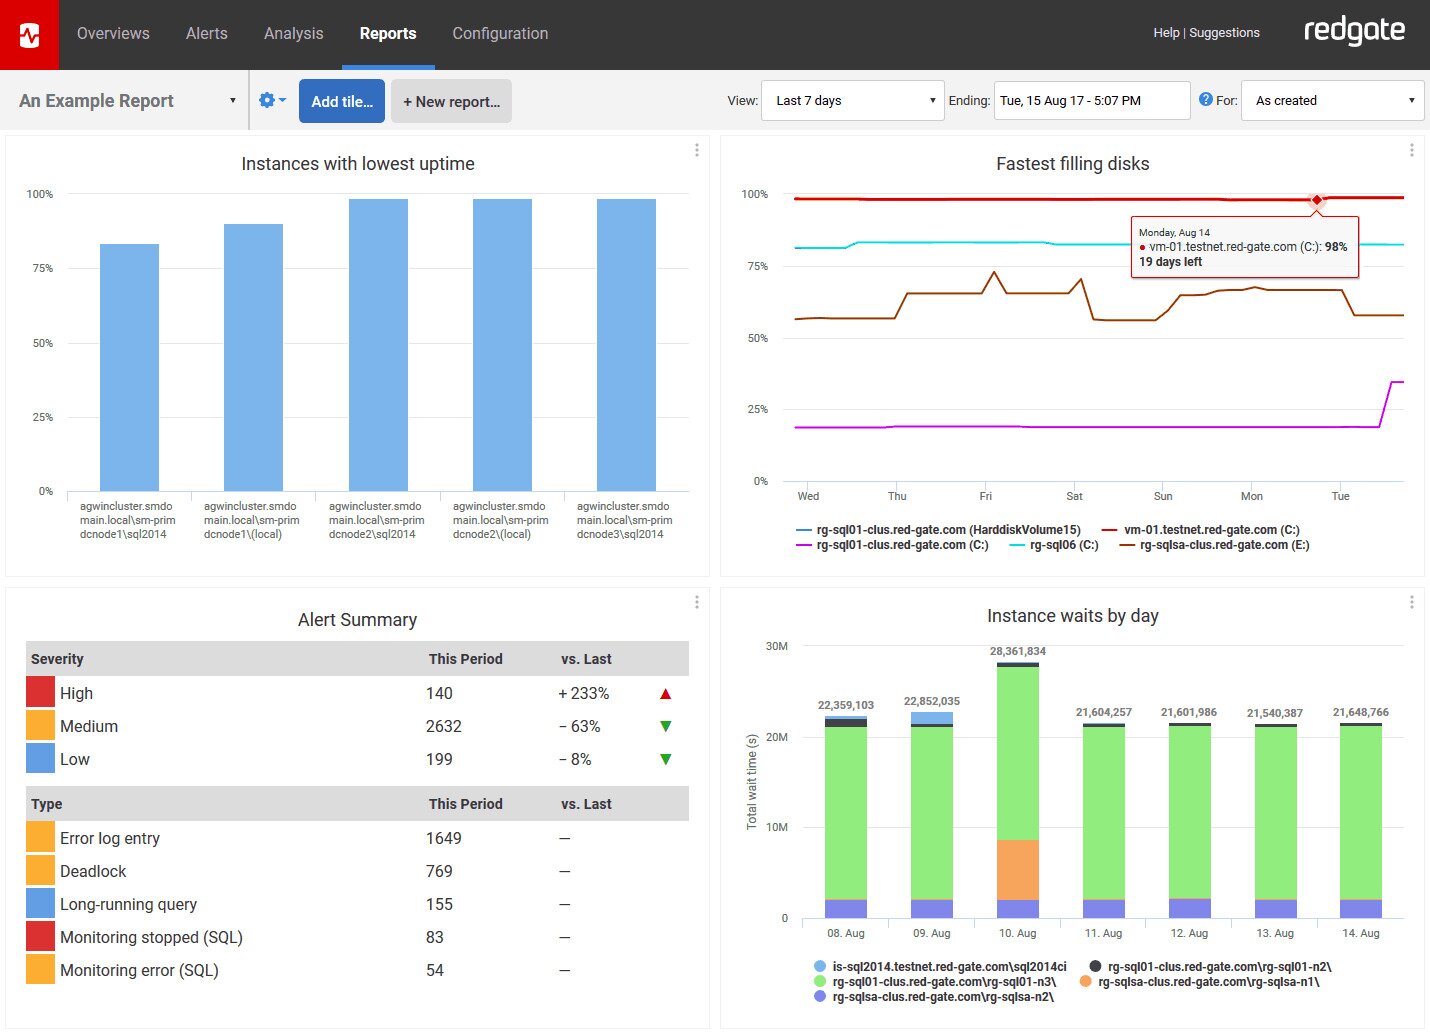
SQL Monitor features an easy-to-use dashboard that lets you view all your database instances in one convenient place. The tool also lets you directly access them within seconds without having to remotely connect to them using a VPN or another method. There’s a dashboard with drill-down functionality that allows you to display detailed statistics about your databases, such as wait times, CPU usage, and disk I/O, in just a couple of clicks.
The base price for the SQL Monitor SQL server monitoring tools is $1,495 per database instance. You are eligible for a 15% discount when you purchase between five and nine licenses simultaneously and a 20% discount when you purchase ten or more. All prices include one year of support from Red Gate. A 14-day trial is available if you want to give the tool a test run, and so is an online demo.
6. SQL Sentry
Our last entry is called SQL Sentry from SentryOne. This is a rather popular solution for database performance monitoring. The SQL server monitoring tools collect and present actionable performance metrics and alerts and display essential events on a calendar-style display, which allow for easy cross-referencing. In addition, the tool can be used to quickly resolve issues by running detailed analysis right from its dashboard. The tool’s performance dashboard—which features an exclusive, patented view of storage performance—can display the results of the detailed analysis of high-impact queries.
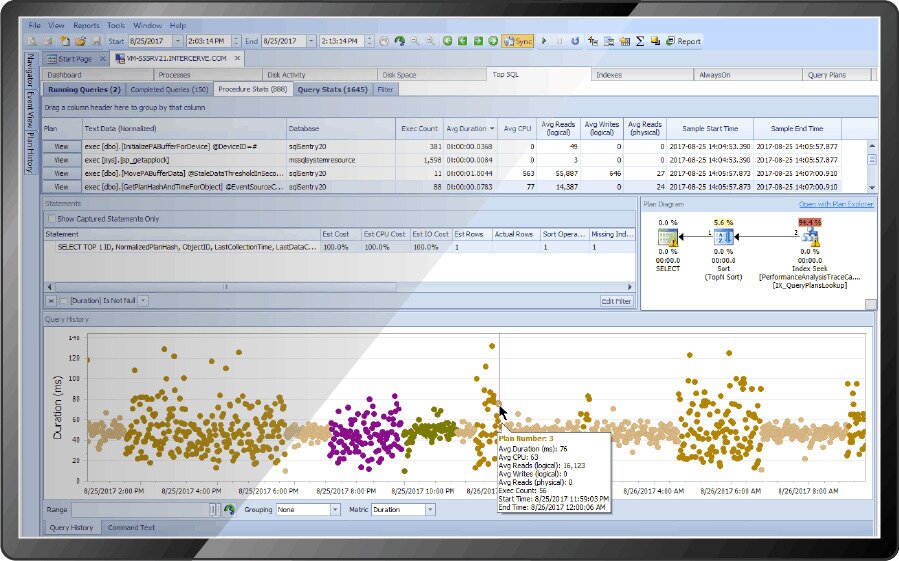
SQL Sentry is certainly not the most modern-looking tool, and its dashboard has been criticized for its antiquated look. However, it will show you all the critical SQL components and services in a neat layout, and it will help you manage your SQL database instances and ensure their availability. You also have the option of viewing the server’s historical data and comparing it to current real-time data. You could use this feature for generating a baseline and then measuring the results of your database optimization efforts.
The price for SQL Sentry is $2,495 per instance, plus an annual maintenance fee of $499. The product is also available as a subscription-based service at a substantially lower cost of $125/month. You can also take the product for a test run, thanks to the available free 15-day trial.
While all the mentioned SQL server monitoring tools offer valuable features, the SolarWinds Database Performance Analyzer (DPA) is the best choice. It provides a comprehensive solution for monitoring and optimizing databases, supporting various database types, scalability, and in-depth analysis. DPA’s graphical trend dashboard offers a visually appealing representation of query performance and provides tuning advice. Additionally, it has a native polling engine, reducing the risk of impacting database performance. SolarWinds DPA offers excellent value and functionality for database administrators with a starting price of $1,275 and a 14-day free trial.