How To Make Sense Of Data Exported From The iOS Health App
The Health app in iOS collects different types of data, either directly or through third-party apps. If you have an Apple Watch, the Health app data is likely richer. The Health app’s data can be transferred between iOS devices and you can export it. When you export data from the Health app, it is exported in two XML files. The app zips them and lets you choose how you want to save it. It’s all very easy up until this point. When you extract the zip file, however, it’s hard to make sense of the XML files inside. Often, you might not know which app can read the XML file and how to make sense of the data inside it. We’re going to break it all down for you.
Export Health App Data
Open the Health app and tap your profile badge on the top right. On your profile screen, scroll down and tap the ‘Export Health Data’ button. The app will create a zipped file and ask you how you want to save it. You can email it to yourself or save it to a cloud drive.
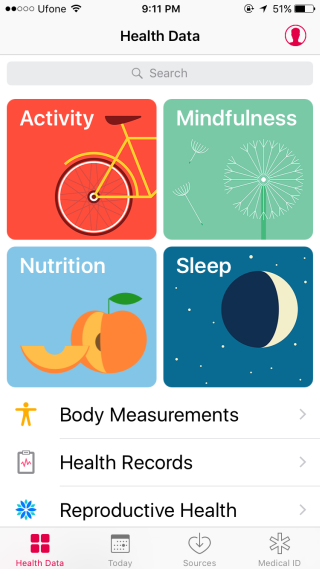
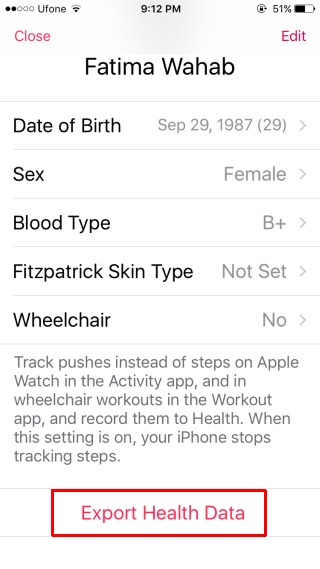
Reading Health App Data
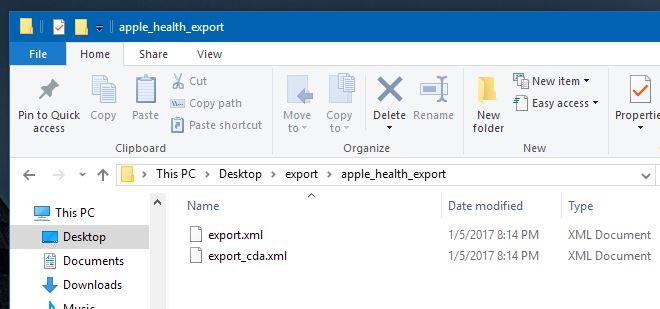
Assuming you have the zipped file on your desktop, go ahead and extract it. The extracted folder will have two files inside it; export.xml and export_cda.xml.
Your data is inside the export.xml file. In order to open it you need an app that can read the XML format and display it properly. I recommend MS Excel. It’s what I’m going to use to show you how to make sense of the data.
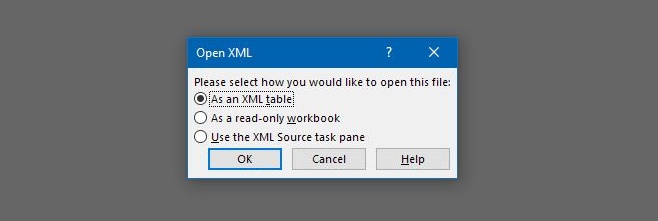
Open Excel and open this file via the ‘Open’ command. When Excel opens this file, it will give you three options to choose how to open it, select ‘As a read-only workbook’.
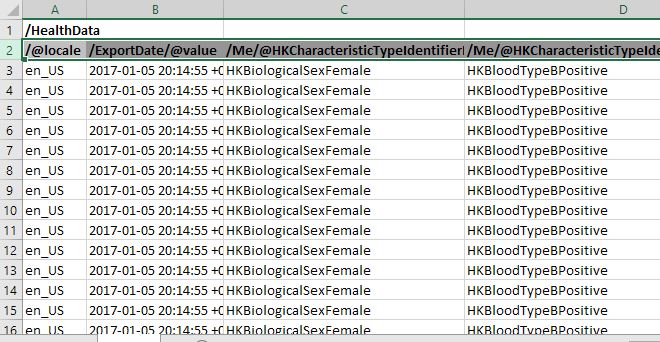
Once the file is open, and you want to edit it without any restrictions simply copy and paste it all to a new file. This is what the data looks like when Excel opens it.
Making Sense Of Health App Data
You will notice that lots of cells in the XML file repeat the same value over and over. This will hold true for the first few columns that you see. As you scroll right and continue reading down the columns, and then the rows, the data will start to vary. Here’s a breakdown of what each cell is showing you;
/@locale: This shows you where, as detected from the App Store country, your data was saved in. It’s value will never change and it will repeat for every single row.
/ExportDate/@value: This shows the date and time when the data was exported. Again, it’s value will never change and will repeat for each row.
/Me/@HKCharacteristicTypeIdentifierBiologicalSex: This is your biological sex, as entered by you in the Health app. It will remain the same for all entries.
/Me/@HKCharacteristicTypeIdentifierBloodType: This is your blood group and again, this column will repeat the same value. To read it, look at the bit that comes after ‘HKBloodType’ and that will tell you what your saved blood group is, e.g., HKBloodTypeBPositive
/Me/@HKCharacteristicTypeIdentifierDateOfBirth: This is your date of birth.
/Me/@HKCharacteristicTypeIdentifierFitzpatrickSkinType: This is your Fitzpatric Skin Type. It measures your skin’s sensitivity to the sun and is entered manually by you in the Health app. The same value will repeat in this column. If you never selected a skin type, the cells in the column will all have the ‘HKFitzpatrickSkinTypeNotSet’ value.
/Record/#id: This is the serial number of the data point. It will start at 1 and then continue on to count every single row of filled data.
/Record/@creationDate: The date on which the record, i.e., data point was recorded. When you later try to look at how many steps you took in, for example, October 2016, you will use this column to narrow the date down.
/Record/@device: This identifies your device and isn’t really that relevant unless you want to separate data collected by the iPhone and data collected by your Apple Watch. The data in this column tells you which device saved the data and what iOS version it was running. Note that the iPhone model reading is inaccurate. A sample of the values under this column is as below. This data came from an iPhone 6/
name:iPhone, manufacturer:Apple, model:iPhone, hardware:iPhone7,2, software:9.3
/Record/@endDate: The end date when the data point was recorded. This will include both date and time.
/Record/@sourceName: This shows the source of the collected data. The first two cells will have the value ‘Health’. This indicates data that a user manually added to the Health app. The column will feature ‘[Your Name] iPhone’ for data that your iPhone collected directly, it will display the name of an app if the data was added via an app, and ‘Clock’ for data related to your sleeping habits collected via the Clock app.
/Record/@sourceVersion: This column will show what iOS version your device was running when a particular data point was recorded.
/Record/@startDate: The date and time an activity started. This is different from the creation date as you might not have added certain activities to your Health app, or you may not have saved data to an activity.
/Record/@type: This is the big, the important, column. It segregates the types of activities it has recorded. You will see a few blank cells at the top for manually added data points but shortly after, you will see activities such as;
HKQuantityTypeIdentifierStepCount – No. of steps you’ve walked
HKQuantityTypeIdentifierDistanceWalkingRunning – How far you have walked or run
/Record/@unit: The units that the data is recorded in are shown here. Blank cells indicate data such as gender and blood type, that have no units. You will see ‘count’ for steps walked, and km for distance walked. You will see a lot of values repeat in this column.
/Record/@value: This is the pot of gold at the end of the rainbow; this has the individual values for the data collected. For example, if you want to know how many steps you took in October 2016, this is the column you will total the steps from. We’ll show you how to do it easily.
/Record/MetadataEntry/@key: This represents data that is manually added to the Health app or added via other native iOS apps. This is data entered under ‘Reproductive health’, ‘Blood Pressure’ or the collected via the ‘Clock’ app.
/Record/MetadataEntry/@value: The value of the data you entered manually in the Health app.
Sorting The Data
Now that you know what data each column has, it’s time to sort and make sense of it. In Excel, select the row with the column titles. Go to Data>Filter from the ribbon.

Each column will have a filter added to it.

Now, for the sake of this example, I’m going to sort the number of steps I took in October 2016. The columns I need to filter the data from are; /Record/@type, /Record/@value, and /Record/@startDate.
Click the filter drop-down arrow on the /Record/@type column and look at the different types of activity that the data contains. Since I want to find out how many steps I took, I will deselect all types and select only ‘HKQuantityTypeIdentifierStepCount’. I won’t need to do anything to the /Record/@value column because narrowing the Type in the /Record/@type column will filter out irrelevant data points from the /Record/@value column as well.

All that needs to be done now, is to sort the data by date. Go to the /Record/@startDate column and narrow the date down. Click the filter drop-down arrow and use the search bar to specify the dates you want to include. For example, for October 2016, I typed 2016-10 and it automatically found all the dates for that month and selected them. Don’t click the ‘Add current selection to filter’ option. Click Ok and the data will be filtered.
Making Graphs
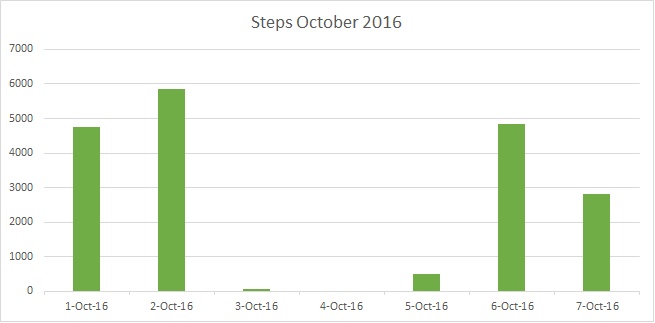
What you see now in the Excel workbook is steps data for October 2016. Go ahead and make a graph. You will definitely want to refine the data a bit before your create a graph out of it. For example, you might want to sum all data values for a single day into one value. If you’re looking to make a graph of the steps you took in October 2016, you will want to total all steps you took on Oct 1, Oct 2, etc so that you have only 30 data values to plot in the end. It takes a little time but here’s my data for the first seven days of October 2016. Use the ‘Sum’ formula to count the steps and then select a graph to plot them to.

This is insane; why does Apple make this so hard. I can export my fitbit data in a second, copy into Numbers and be done with it. I don’t have two hours to dink around with data that should be more easily obtained!