How To Save An MS Excel 2016 Graph To A PDF File
PDF is the format to use when you want to publish documents online. PDF is easily one of the most common file types found online and it’s used to publish not just documents but also presentations, reports, and catalogs. The thing with a PDF file is that while the format is exceptionally popular the app that lets you create or edit it, Adobe Acrobat, is rarely used. For the most part, others apps like Photoshop are used to compose a PDF file and export to the format. Owing to the format’s popularity a lot of apps support exporting to PDF and MS Office is no different. You can easily create a document in MS Word and export it as a PDF file. Likewise you can export an Excel sheet to PDF. If you’re looking to export just a single graph or chart and not an entire worksheet to PDF here’s how to do just that.
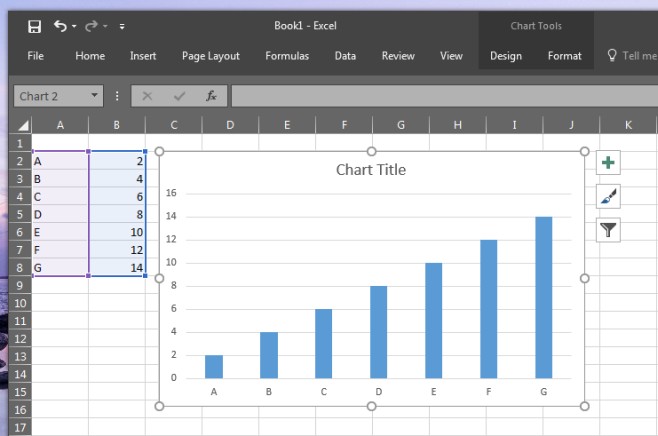
Open the MS Excel file you want to export a graph from or open a new file and create your graph. Select the graph you want to export. You don’t need to select the data columns the graph is generated from but if they auto-select, you need not be worried.

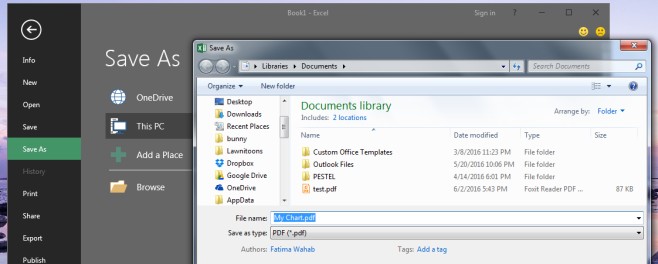
With just the chart selected, go to File>Save As and select ‘PDF’ from the ‘Save as type’ dropdown. Name the file and click Save.

The chart will be exported to a PDF file. You can export multiple charts from Excel to a single PDF file but you must take care to arrange them in the correct order in Excel first. The charts should not overlap each other nor should they be misaligned or they will export in much the same layout.

Thank you for your help with copying an excel sheet to a PDF sheet.
I’m a student (old one at that) and it saved me a lot of stress.
Many thanks.
Alison Caddy