

Ping Monitor: The 7 Best Free and Open-Source Monitoring Tools
Ping monitor is not only the simplest form of monitoring, but it’s also possibly the oldest as well. And to this day, it is still in widespread use. For those in need of answers read on as we’ve found some of the best free and open-source ping monitoring tools and are about to review them.

A typical network has so many components that it is of the utmost importance to always keep an eye on everything. But with today’s distributed and/or cloud-based data centers, monitoring is more complex than ever. This is why there is a seemingly infinite number of monitoring systems available, all geared at helping administrators stay on top of everything. Various types of monitoring exist from the simplest to the most elaborate. Today, we’re having a look at ping monitoring, one of the most elementary forms of monitoring. It consists simply of using ping to make sure that each monitored component is up and running and responding within an acceptable time frame.
Before we begin, we’ll spend some time discussing ping, what it is and how it works. Ping is an old utility that is deceptively simple and powerful. But it is so reliable that it has not been superseded by anything yet, despite the fact that it’s bee around for ages. We’ll then have a look at ping as the basis for a monitoring tool and discuss the various common features of such systems. We’ve kept the best for last so we’ll finally review some of the best free and open-source ping monitoring tools we could find.
About Ping
Back in 1983, a developer who was seeing an abnormal network behaviour couldn’t find the right debugging tool so he decided to program one. He called his tool ping which, by the way, comes from the sound of sonar echoes as heard from inside a submarine. Today, ping is available on virtually every operating system with IP networking and although individual implementations vary slightly in their available options, they all serve the same basic purpose. The differences between implementations are mostly related to the available command-line options which can include specifying the size of each request’s payload, the total test count, the network hop limit of the delay between requests. Some modern operating systems include a ping command which serves the same purpose but uses IP V6 addresses instead of IP V4.
$ ping -c 5 www.example.com

PING www.example.com (93.184.216.34): 56 data bytes

64 bytes from 93.184.216.34: icmp_seq=0 ttl=56 time=11.632 ms

64 bytes from 93.184.216.34: icmp_seq=1 ttl=56 time=11.726 ms

64 bytes from 93.184.216.34: icmp_seq=2 ttl=56 time=10.683 ms

64 bytes from 93.184.216.34: icmp_seq=3 ttl=56 time=9.674 ms

64 bytes from 93.184.216.34: icmp_seq=4 ttl=56 time=11.127 ms

--- www.example.com ping statistics ---

5 packets transmitted, 5 packets received, 0.0% packet loss

round-trip min/avg/max/stddev = 9.674/10.968/11.726/0.748 ms
How Ping Works
Ping is both clever and simple. The utility simply sends an ICMP echo request packet to the specified target and waits for it to send back an ICMP echo reply packet. This process is repeated a certain number of times (by default, 5 times under windows and until it is stopped under most Unix/Linux implementations.), allowing it to compile statistics. Ping measures the time between the request and the reply and displays it in its results. On Unix variants, it will also display the value of the reply’s TTL field, indicating the number of hops between the source and the destination. In fact, what is displayed in the command response if another place where various implementations differ.
Pings works under the assumption that the pinged host follows RFC 1122 which prescribes that any host must process ICMP echo requests and issue echo replies in return. Most hosts do but some disable that functionality for security reasons. Some firewalls will also block ICMP traffic altogether, preventing ping from doing its job. Pinging a host which does not respond to ICMP echo requests provides no feedback, exactly like pinging a non-existent IP address.
About Ping Monitoring
Given the limited information that can be gathered using ping, monitoring tools making use if it don’t always offer much information other than the up or down status. These tools are primarily used simple to ensure that each host is up and running and that its network connection is operating normally. Some tools do interpret the average response time returned by ping as a measure of how quickly the host is responding or how congestion the network is. While a sudden jump in average ping response time is possibly an indication that something is wrong, it would be a mistake to foolishly jump into conclusions. At best, an abnormally high ping response time should be an indication that further analysis is required.
Some Free And Open-Source Ping Monitoring Tools
There are many free and open-source ping monitoring tools available. What we have for you today are some of the best tools we could find. While they are not all open-source, they are all available for free although some of them in a limited version. Some tools on our list are more than just ping monitoring tools. Some are even full-fledged tools that will not only monitor the status of devices but also the bandwidth utilization of your network as well as critical performance metrics such as CPU or Memory loads.
1. SolarWinds Engineer’s Toolset (Free Trial)
SolarWinds is probably one of the best-known names in the field of network and system administration tools. It’s been around for some twenty years or so and has brought us some of the best tools on the market. Its flagship product, the SolarWinds Network Performance Monitor has received rave reviews as one of the best network bandwidth monitoring tool. The company is also famous for its free tools, smaller utilities which address a specific need of network administrators. The Network Device Monitor and Traceroute NG are two great examples of those free tools.
We felt that the SolarWinds Engineer’s Toolset deserved a special mention for several reasons. First and foremost, it includes a very good Ping Monitor module. But as its name implies, this is a set of tools. Oven sixty of them, to be precise. You can use the Engineer’s Toolset to continuously monitor servers, routers, workstations, or other devices to show response time in real-time and display response rates in graphical charts. The toolset also includes a “Simple Ping” tool which is an alternative to the ping that comes with your operating system and can be used to measure a host’s response time and packet loss.

There’s also an Enhanced Ping tool, which provides several graphing options which can help you visualize and more easily identify response-time problems. Together, these ping software tool solutions help ensure you gain the visibility you need to monitor and troubleshoot network connection issues.
Other tools included in the Engineer’s Toolset
Among the 60+ tools that you’ll find in the Engineer’s Toolset, a few are free tools that are also available individually but most are exclusive tools which can’t be obtained any other way. A centralized dashboard lets you easily access any of the included tools. Among the different tools you’ll find, some can be used to perform network diagnostics and help resolve complex network issues quickly. Security-conscious network administrators will appreciate a few tools that can be used to simulate attacks on your network and help identify vulnerabilities.

The SolarWinds Engineer’s Toolset also includes a few more monitoring and alerting tools such as one which will monitor your devices and raise alerts when it detects availability or health issues. This will often give you enough time to react before users even notice the problem. To complete an already feature-rich suite of tools, configuration management and log consolidation tools are also included.
While this is not the place to go in details on each included tool, here’s a list of some of the best tools you’ll find in the SolarWinds Engineer’s Toolset besides its ping monitoring tools.
- Port Scanner
- Switch Port Mapper
- SNMP sweep
- IP Network Browser
- MAC Address Discovery
- Ping Sweep
- Response Time Monitor
- CPU Monitor
- Interface Monitor
- TraceRoute
- Router Password Decryption
- SNMP Brute Force Attack
- SNMP Dictionary Attack
- Config Compare, Downloader, Uploader, and Editor
- SNMP trap editor and SNMP trap receiver
- Subnet Calculator
- DHCP Scope Monitor
- IP Address Management
- WAN Killer
The SolarWinds Engineer’s Toolset—including the ping tools sells for $1495 per administrator seat. If you consider that it includes over 60 different tools, this is a very reasonable price. If you want to see for yourself what this toolset can do for you and your organization, a free 14-day trial available from SolarWinds.
2. Zabbix
Zabbix is one of those tools that will do much more than just ping monitoring. It claims to be the ultimate enterprise-class monitoring platform. And it possibly is, especially when compared to other free and open-source tools. At any price, it would be an excellent tool and the fact that it is free and open-source make it an even more interesting proposition. The tool makes use of SNMP to monitor network devices but also local or cloud-based servers. It will let you monitor multiple metrics such as bandwidth, CPU and memory utilization, device health in general as well as configuration changes, a rather unique feature.
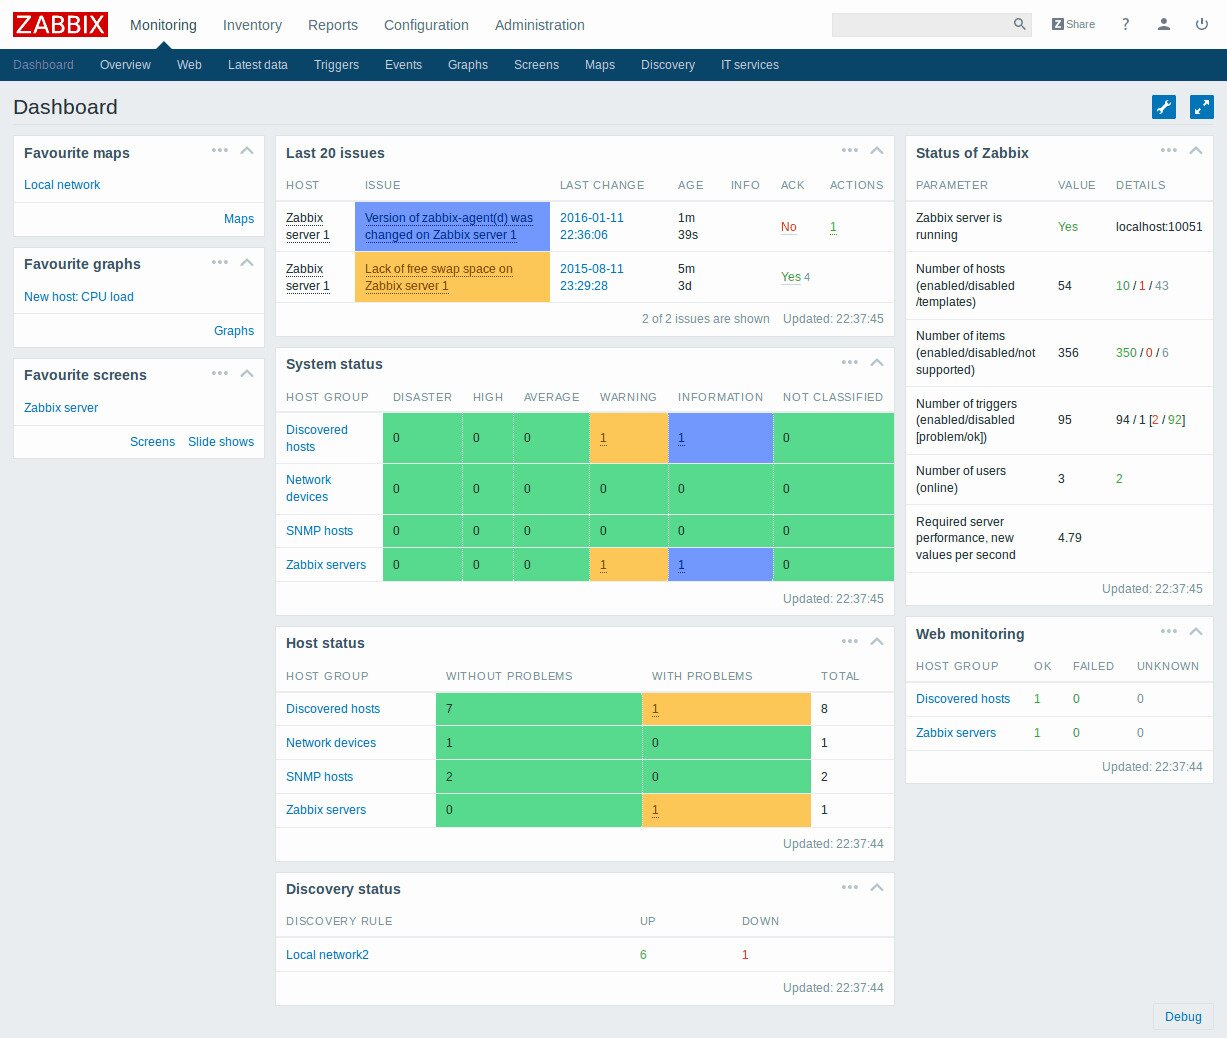
Zabbix boasts an easy to comprehend and use web-based interface and an impressive feature set. It compares very well to commercial products costing thousands of dollars. Its alerting system is possibly among the best in its class with the ability to run local scripts in response to alerts triggered by monitoring events.
While Zabbix itself is free, several services can be purchased from the publisher. These include technical support which is available in five levels and a complete training and certification program with classes throughout the world. This is excellent as the lack of available support is the most common drawback of open-source software. But you don’t have to purchase support services as community support is also available for free.
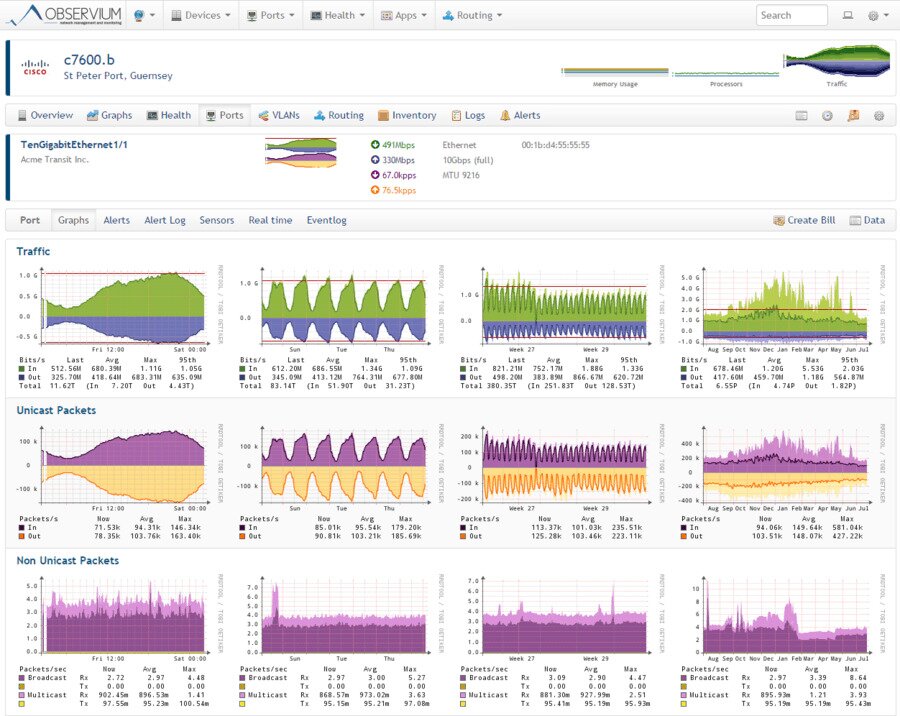
3. Observium
Observium is another feature-rich monitoring platform. It features low-maintenance and auto-discovery and supports a wide range of device types, platforms and operating systems including, among others, Cisco, Windows, Linux, HP, Juniper, Dell, FreeBSD, Brocade, Netscaler, NetApp. The tool’s primary objective is offering a beautiful, intuitive, and simple yet powerful user interface depicting the health and status of the network.
The product is available in two versions. There’s the Observium Community is which available to everyone for free. This free version receives updates and new features twice a year. There’s also Observium Professional which has an expanded feature set and benefits from daily updates. Both editions only run on Linux platforms.
Observium offers way more than just ping monitoring. It will, for instance, monitor bandwidth utilization and there’s even an accounting system that will measure total monthly bandwidth usage in the 95th percentile or in total transferred bytes. It also has an alerting function with user-defined thresholds. Furthermore, it integrates with other systems and can pull their information and display it within its interface.
Observium is to set up and it almost configures itself. While there isn’t a download section on Observium’s website, there are detailed installation instructions for several Linux distributions that do include the links to get the package.
4. Nagios Core
Nagios Core is an open-source monitoring system that runs on Linux. it is a completely modular system where Nagios Core is actually only the main monitoring engine. It is complemented by some 50 plugins that can be downloaded to add various functionality to the system. Keeping with the modular approach, there are also different community-developed front ends also available for download. Together, they make for a quite complete albeit somewhat “Frankesteinesque” monitoring system. The main drawback of such an approach is that setting up Nagios Core can be a daunting task.
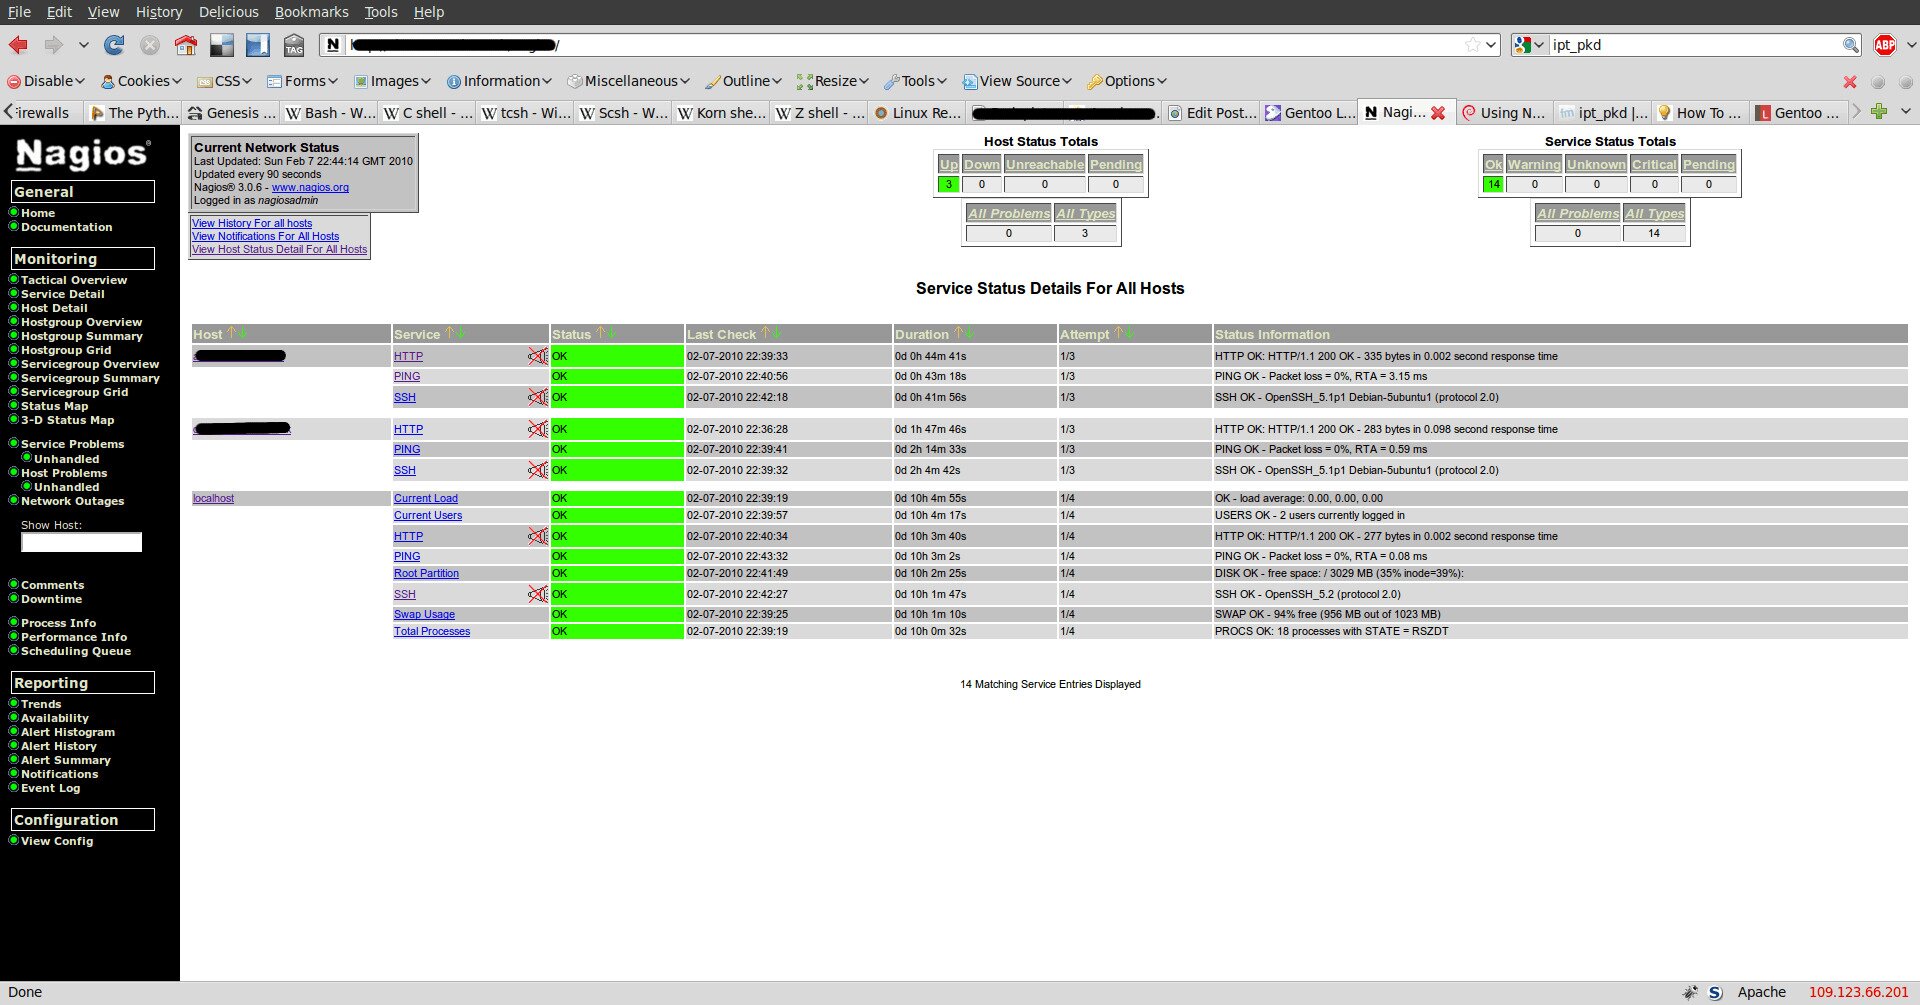
In addition to this free and open-source version that can be downloaded and used by anyone, there’s also a commercial product called Nagios XI. It has more features. It is also a self-contained tool which makes it much easier to set up. You don’t have to assemble and install multiple separate components.
One of the best features of Nagios Core—the open-source version—is its community. Several community-developed plugins, front ends, and add-ons are available directly from the Nagios website. If you want more built-in functionality, you’ll have to go for Nagios XI which has bandwidth usage monitoring and many more useful features. A free trial of Nagios XI is available should you want to give it a test run and see what it can do for you.
5. LibreNMS
At its core, LibreNMS is a port of Observium. It is another all-inclusive network monitoring system that provides a wide array of features and device support. Among the tool’s best features is its auto-discovery engine which doesn’t only rely on SNMP to discover devices. It can automatically discover your entire network using CDP, FDP, LLDP, OSPF, BGP, SNMP and ARP. The product also features automatic updates, ensuring that it will always stay current.
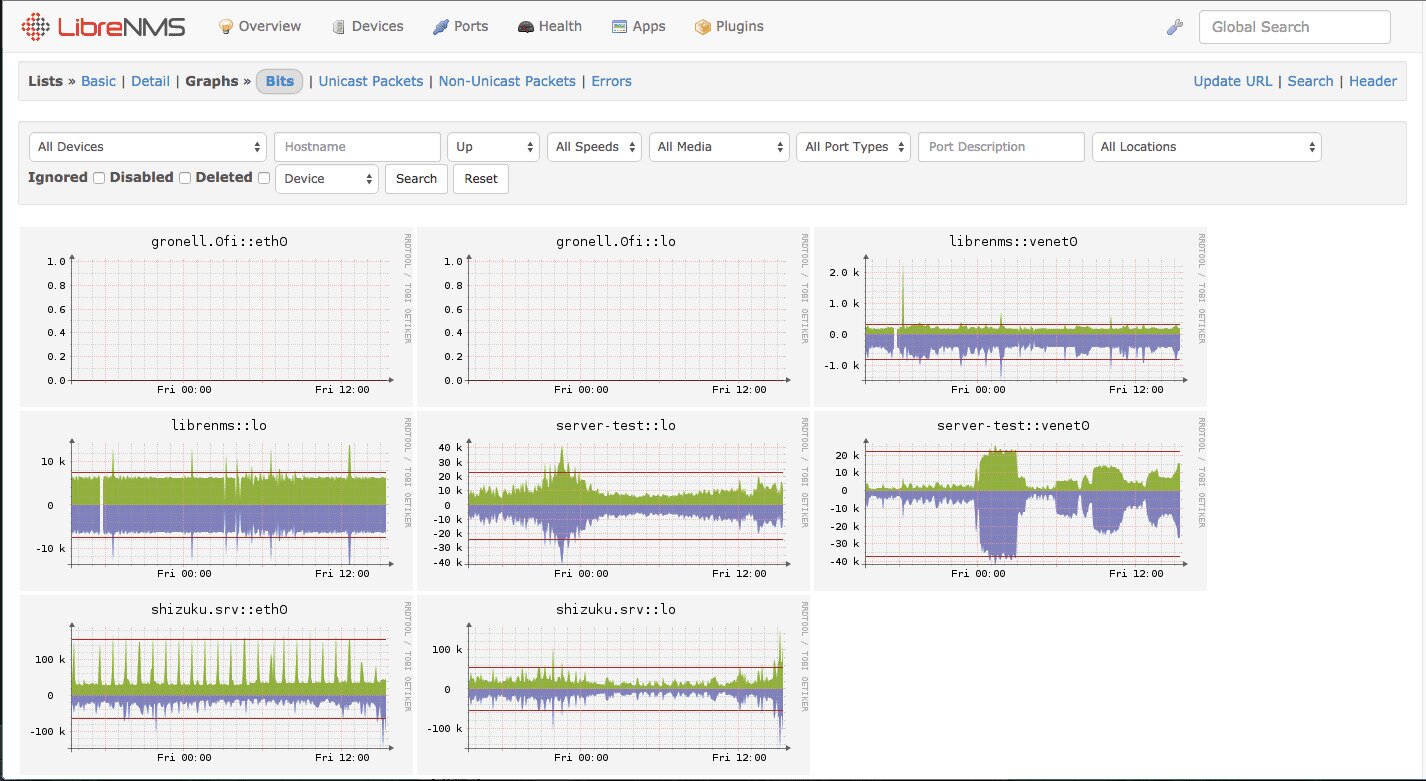
Another important feature of the LibreNMS is its highly customizable alerting module. It is very flexible and it can send alert notifications using multiple methods such as email—like most of its competitors—but also IRC, slack, and more. If you’re a service provider or your organization bills back each department for their use of the network, you’ll probably like the tool’s billing feature. It can generate bandwidth bills for segments of a network based on either usage or transfer.
For larger networks and for distributed organizations, LibreNMS has distributed polling features allowing for horizontal scaling to grow along with your network. A full API is also included, allowing one to manage, graph, and retrieve data from their installation. Finally, mobile apps for iPhone and Android are available, a somewhat rare feature with open-source tools.
6. Icinga
Icinga is an open source monitoring platform with a feature set that matches most of the best commercial products and a simple and clean user interface. One feature that sets Icinga apart from the rest of the crowd is its extensive use of plugins. And when we say extensive, we mean extensive. There are literally thousands of them available to perform various monitoring tasks and extend the product’s functionality. And if you have a special need for which there’s no plugin, you can always write one yourself.
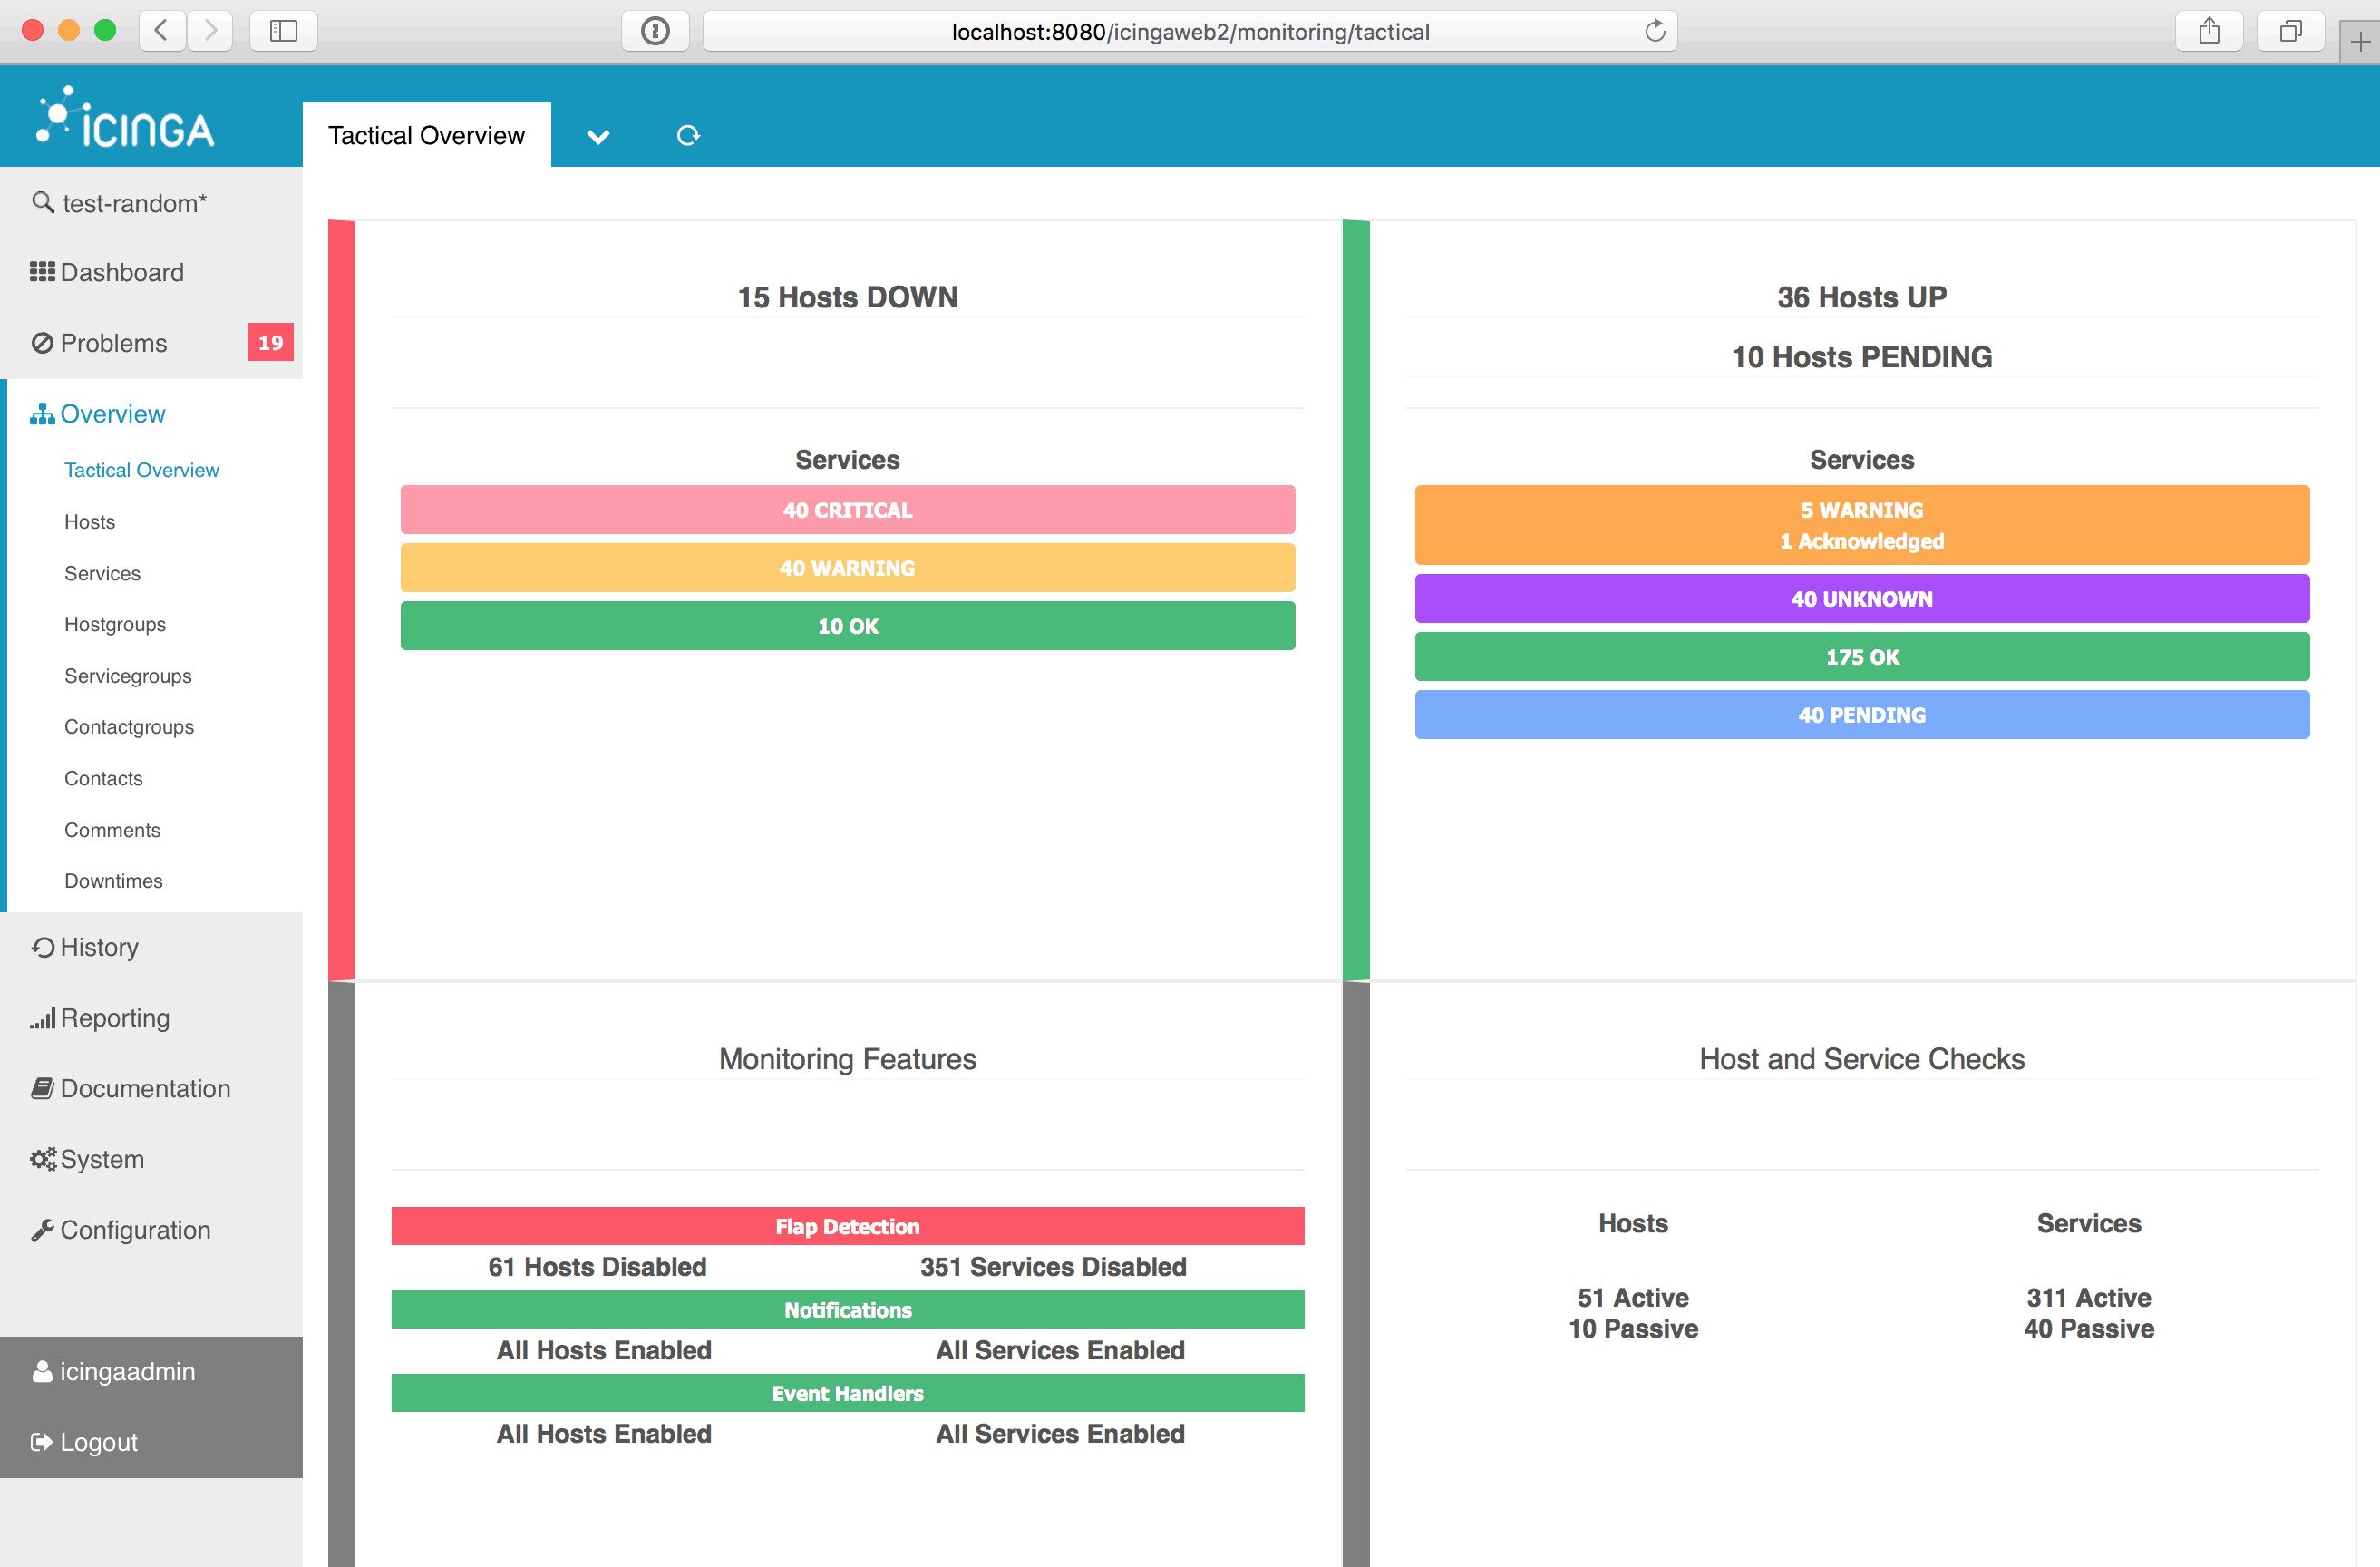
Another excellent feature of Icinga is the alerting and notification module. You can customize alerts to be triggered by any condition you can think of. And it’s just as flexible on how alerts are transmitted. The product has segmented alerting that allow it to send some alerts to some recipients and other alerts to different ones for the best flexibility. This is a great feature when you have different systems managed by different groups.
7. Emco Ping Monitor
The EMCO Ping Monitor, while not an open-source product, is still an interesting ping monitoring tool. Right from its Host Status Overview you can view your devices status, ping response times, and outage information. Each host is monitored in real-time and the tool boasts colour-coded graphs to help you see how connections change over time. The tool also lets you look at historic host data for any time span you select. And this historical data can be used to build reports in both PDF and HTML formats.
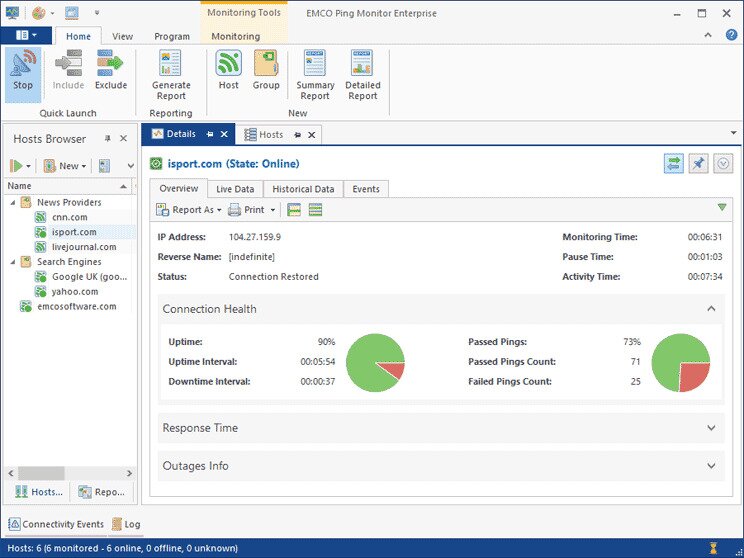
One particularly interesting feature of the EMCO Ping Monitor is its scripting capabilities. You can set up scripts to run once a networking event happens. The scripts can fire some remediation process. Alerting is also available and email notifications can be sent when something changes.
The EMCO Ping Monitor is available as a freeware version limited to five hosts. There are also a Professional Edition and an Enterprise Edition. The former can monitor up to 250 hosts for $99 per instance or $245 for unlimited instances. The Enterprise Edition offers hosts-unlimited monitoring at a cost of $199 for a single instance and $445 for unlimited instances. A free 30-day trial version is also available.