

IBM WebSphere Application Server: Best Monitoring Tools in 2026
Data is at the core of most organizations nowadays. This means that they need to be able to pull data from every available source and extract useful information from it. But this data can be from various sources and its format is not necessarily uniform. This is where you need a system such as the WebSphere Application Server from IBM.

This platform will coordinate all the data accesses and provide users with whatever application they need to process the raw data into meaningful information. Today, we’re having a look at this powerful product from IBM and we’ll review some tools you can use to monitor and manage the product.
As we often do, we’ll first have a high-altitude look at the WebSphere Application Server. Our goal is to give you enough background information to better understand what the product is and how it can provide value to your business. This will lead us to our next topic, the typical uses for the product. Next, we’ll discuss the advantages of using a web application server in general before we review the pros and cons if the WebSphere Application Server. And last but not least, we’ll review five of the best tools you can use to manage and monitor your WebSphere installation.
The WebSphere Application Server In A Nutshell
The Application Server from IBM is both complex and simple. At its base—and you’ll probably have guessed that from the name—it is an application server. As such, its primary purpose is to serve applications. No real surprise here. The server sits between data sources and the users, allowing for easy and controlled access to corporate data.
That’s the simple way to put it. To be more precise, the WebSphere Application Server is a runtime environment whose primary purpose is to run and deploy Java EE (Enterprise Edition) applications. But even that description is somewhat minimalist as the server is more than that. Although it can act as a conduit between back end services such as databases and front end systems such as user applications, making it a typical middleware component, it also runs a Java Virtual Machine (JVM) as well as containers for Java-based web applications.
The consequence of the platform’s close ties to the Java ecosystem is that any application running on the platform or served by it needs to be Java-based. Some will see that as a major constraint but Java advocates will love it. And in fact, it really is not that much of a constraint anyways. The WebSphere Application Server can integrate applications with almost any other system or endpoint, not only those from IBM, making it a versatile product.
RELATED READING: Best Server Monitoring Software (Review)
Typical Uses For The WebSphere Application Server
While there are many reasons for using the WebSphere Application Server, some are more obvious than others. For instance, the platform would likely be an ideal choice for organizations with a number of Java-based applications that need to be able to interact with other apps running on otherwise incompatible platforms. The presence of the server’s Java Virtual Machine sitting in the middle and running Java-based applications could greatly facilitate the communication between systems as any data coming in and going out would be transformed on the fly into whatever format is required before being passed on.
You can install the WebSphere Application Server on several operating systems. Coming from IBM, you can expect it to run on Linux and IBM’s own i/OS and z/OS but it will also run on Solaris and Windows, making it a very versatile option.
Users of this powerful middleware system can use it to have their inputs processed and moved on to storage devices that are also connected to it. They can also extract data from the back end servers and applications lying beyond the WebSphere Application Server, import it to the middleware, have it processed, and then allow end-users to use it from their browsers. And though the process can seem to be a relatively complex, multi-stage end to end operation, the whole purpose of the server is to make it appear seamless to the end-user, providing an experience that is similar to what they’d get by directly accessing the back end. After all, the whole idea of middleware is to provide a transparent interface between the front and back ends.
RELATED READING: Best Windows Server Monitoring Tools (Review)
Why Use A Web Application Server?
A web application server, being from IBM or any other vendor, can provide several advantages to an organization. Here’s an overview of what you can expect.
- The platform typically provides a seamless user experience that facilitates access to data regardless of its format.
- It also allows for the integration of data from multiple, otherwise incompatible data sources and platforms.
- It can also help compile information from various sources and then use the results to draw accurate conclusions on the current status of an organization’s affairs.
- A web application server offers the ability to collaborate with external business partners without having to worry about the compatibility of their data formats. The middleware will provide the required format conversions as needed.
RELATED READING: Best Web Application Firewalls (WAF Vendors) Reviewed
Pros And Cons
In a perfect world, everything would be perfect. But we’re not in a perfect world and the WebSphere Application Server, just like any other platform, comes with its share of good and bad sides. Here’s an overview of the main pros and cons of the system.
Pros
- First and foremost, the WebSphere Application Server is easy to use. Even some of its most complex configurations are relatively easy to accomplish, thanks in part to the product’s powerful administrative console.
- The platform is also compatible with several versions of Java. This means that you won’t be forced to choose one over the others or that you won’t have to worry that the middleware might fail with some of your applications.
- The platform allows for the easy addition and removal of resources. Even better, most of the actual work is done during the initial setup phase. Once installed and configured, the discovery of new nodes, servers, and applications requires little or even no effort at all.
- Some of the platform’s features—actually, most of them—let an administrator become proactive in keeping applications and their servers running smoothly. Furthermore, plans and configuration let administrators forecast growth in hardware resources needs and software requirements by collecting and correlating trends over time.
- Using a product such as the WebSphere Application Server means the end of fighting fires. It makes system administrators more proactive in keeping the servers they manage in their optimal state.
Cons
- As much as we don’t like to evaluate products solely on price, we have to admit that like most offerings from IBM, the WebSphere Application Server is on the pricey side. In fact, it is so expensive that it could turn out to be a hard expense to justify, especially when trying to demonstrate the potential return on investment, no matter how good it is. Add to that the fact that IBM—being its usual self—doesn’t even offer a free trial version.
- The financial costs are not the only costs associated with this product. It also comes with a significant overhead when compared with competing solutions. This takes the form of considerable requirements in CPU as well as memory usage. You will typically need a beefier machine to run the WebSphere Application Server.
- Configuration is another area of the platform that leaves somewhat to be desired. Although the installation is relatively straightforward, most of the configuration is done through the command line or by editing arcane XML files. The consequence is that you’ll almost always need to have an expert on hand for the initial configuration.
- Again, compared to other products in this category, we observed that the level of community support or even the online footprint of the product is rather low. It gives the impression that it is a relatively unknown product outside the big business world. Given its price, this is understandable yet IBM might be better off pushing its product to the “regular” users.
Best Monitoring Tools For WebSphere Applications Server
Now that we’ve covered a lot of what you need to know about the WebSphere Application Server and how it can help you and your organization, let’s have a look at what third party products are available to help in monitoring and managing the platform. While there are no products solely dedicated to that specific purpose, there are a great many tools that can help. We’ve scoured the market and came up with this list of the very best tools.
1. SolarWinds Server & Application Monitor (FREE TRIAL)
First on our list is a great tool from SolarWinds. The twenty-something old company is famous for making some of the very best network and system administration tools. For instance, its flagship product, the SolarWinds Network Performance Monitor, is considered by many to be the best network monitoring tool available. And to top it off, the company also makes a bunch of free tools, each addressing a specific need of network administrators. The Advanced Subnet Calculator and the Kiwi Free Syslog Server and two great examples of these free tools.
When it comes to monitoring the WebSphere Application Server, SolarWinds proposes its Server & Application Monitor. The tool is designed to help administrators monitor servers, their operational parameters, their processes, and the applications which are running on them. Any application, not just the WebSphere Application Server. It can easily scale from very small networks to large ones with hundreds of servers—both physical and virtual—spread over multiple sites. The tool can also monitor cloud-hosted services like those from Amazon Web Services and Microsoft Azure.

The SolarWinds Server & Application Monitor is very easy to set up and its initial configuration is just as easily done, thanks to its auto-discovery process which is a two-pass process. The first pass will discover servers, and the second one will find the applications running on them. While this can take time, it can be sped up by supplying the tool with a list of specific applications to look for. Once the tool is up and running, the user-friendly GUI makes using it a breeze. You can choose to display information in either a table or a graphic format.
The SolarWinds Server & Application Monitor provides out-of-the-box templates for WebSphere performance monitoring to track the key performance metrics of your application server. Using the JMX protocol, the tool will let you monitor JVM statistics such as classes loaded count/total loaded count/unloaded count, letting you track the health and availability of the application server. It will also monitor memory statistics such as memory heap used or garbage collections count to detect memory leaks and exceptions, as well as thread pool statistics such as total started count to prevent thread deadlocks and pool exhaustion.
Read our in-depth review of the SolarWinds Server and Application Monitor.
In summary, the SolarWinds Server & Application Monitor will provide a definite added value when dealing with a WebSphere installation of any complexity including:
- Identifying and troubleshooting issues related to memory leaks and memory exceptions in your WebSphere servers.
- Monitoring the overall health and performance of WebSphere servers and supporting hardware in a single console.
- Receiving alerts about slow server response times and increases in database connection pools for faster troubleshooting.
The SolarWinds Server & Application Monitor is available in six capacity tiers of increasing cost. Functionality-wise, all tiers offer the exact same features. The main accounting unit of the tool is the “monitor”. A monitor can be one of several things.
First, there are Component Monitors. Any monitored server parameter counts as one monitor. For instance, a performance counter, a process, a URL, a service, or a script are all monitors. Next are nodes which are any device connected to the network. Nodes can include such things as a server, a power supply, a virtual machine, an ESX host, or a printer. The last type of monitor is the volume. This one corresponds to a logical disk on a monitored server.
The six available pricing tiers are suitable for 150, 300, 700, 1 100, 1 500, and unlimited monitors. Their prices, including the first year of support and maintenance, vary from $2 955 to $38 620. Should you want to try the product, a free 30-day trial is also available.
2. AppDynamics APM
AppDynamics, which is now a part of Cisco, has a great Application Performance Management tool available which is simply called AppDynamics APM. This excellent tool will automatically discover, map, and allow you to visualize your critical customer journeys through each application service and infrastructure component, including the WebSphere Application Server. It provides management teams with a single source of information to focus on end-to-end performance in the context of the customer experience, instead of monitoring individual services.
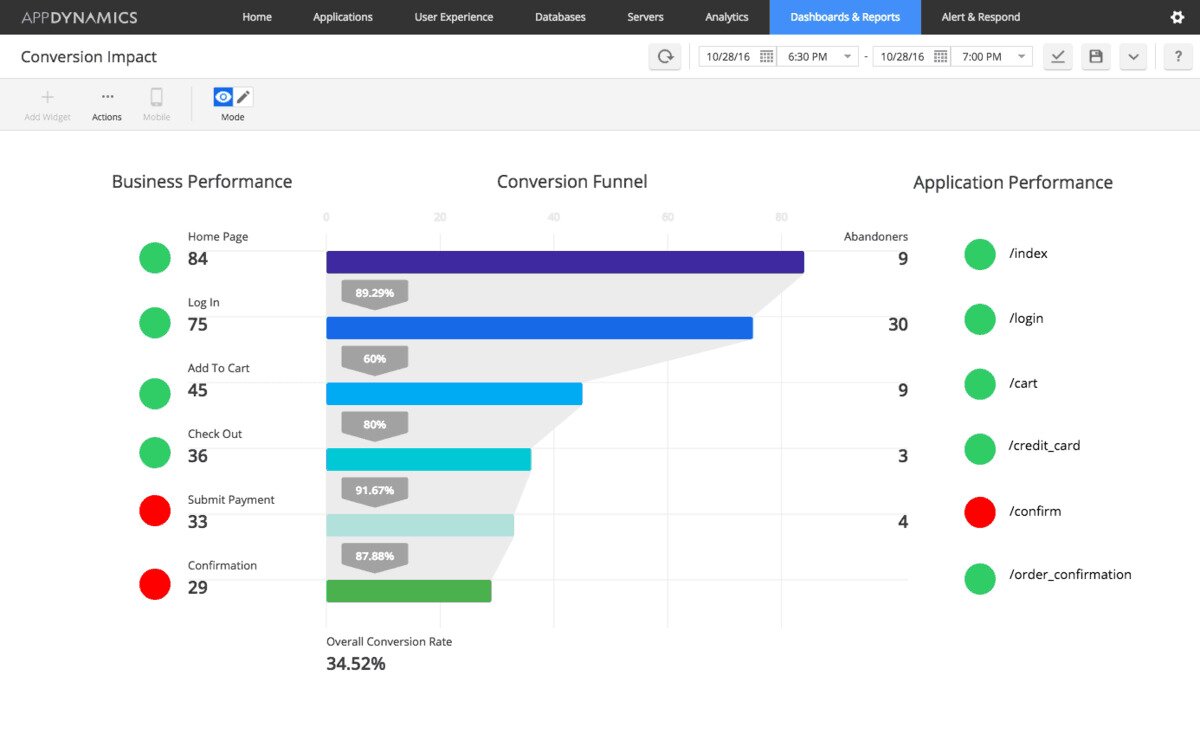
This tool uses machine learning to learn what normal performance is, automatically building its own baseline of application performance. It allows the tool to alert you whenever performance is not normal. There is direct integration with ServiceNow, PagerDuty, and Jira so that you can be immediately alerted and fix problems before users notice them. Another great feature is the tool’s immediate, automated, code-level diagnostics. Its deep diagnostic capabilities enable you to identify root-cause down to the individual line of code. Your team won’t have to go sifting through log files, saving valuable developer time.
When dealing with the WebSphere Application server, AppDynamics APM can be used to map your applications to key performance indicators and use the data to tweak your software and hardware in order to vastly improve their overall performance. Here’s an overview of the key WebSphere server metrics that the tool will monitor:
- JVM Memory and Heap Usage
- Average Response Time
- EJB (Enterprise Java Bean)Pool Statistics
- Disk I/O
- Servlet Session Counts
- Java Database Connectivity (JDBC) Connection Pool Statistics
- Thread Pools
- CPU Utilization
- Session Statistics
- Custom MBeans attributes via JMX
Another advantage of this powerful tool is how it can significantly reduce the time you’ll spend troubleshooting, isolating, and resolving issues in your WebShepere-based applications. This is, in part, due to its map feature that shows all the resources where you’ll quickly be able to pinpoint the location of an issue and perhaps even identify its probable cause. But that’s not all, the tool also has automatic remedial actions that you can use—such as stopping and starting servers—to resolve many of the most common issues with no human intervention.
If you ever get to a point where you realize that the time has come—for whatever reason—to move your WebSphere environment to the cloud, AppDynamics APM can help you make that a smooth process. It can be used to identify the apps that are ready to be moved to the cloud and those that do need a few optimization tweaks before they are ready to be moved. And once the applications have been moved, the tool will still be there to monitor your environment. In fact, it will even track applications that are located in multiple, separate clouds. This tool allows an organization to take complete control of all its WebSphere applications, and use them to potentially improve its overall competitiveness.
AppDynamics APM is available in several versions. The most basic is called APM Pro. APM Advanced adds server visibility and network visibility features. The top-level is called APM Peak and it includes all the features from APM Advanced plus business performance monitoring, transaction analytics, and business journeys. Pricing can be obtained by contacting AppDynamics and a 30-day trial version is available.
3. ManageEngine Applications Manager
ManageEngine is another name that enjoys an excellent reputation among network administrators. The company makes a handful of high-quality network and system administration tools such as the ManageEngine Application Manager. But don’t let the product’s name mislead you as it is as much a monitoring platform as it is a management tool.
This tool offers integrated application performance monitoring for all your server and application monitoring needs. It can also do that for the underlying infrastructure components such as application servers, databases, middleware and messaging components, web servers, web services, ERP packages, virtual systems and cloud resources. In a few words, this is an all-encompassing platform.
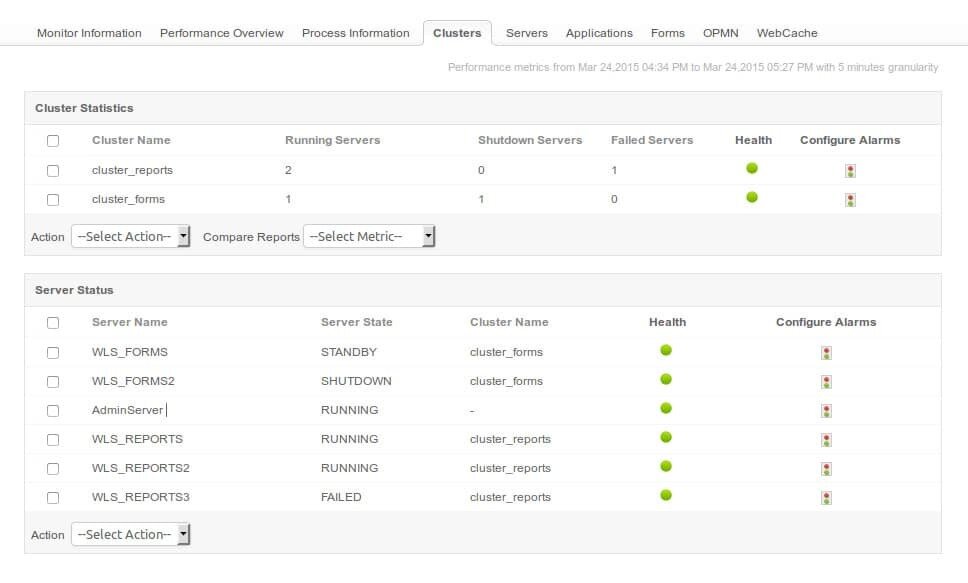
The ManageEngine Application Manager will give you in-depth visibility into the performance of your WebSphere Application Server as well as the applications deployed on it. It will detect performance issues quickly and reduce the time taken to troubleshoot problems. The tool monitors the overall availability, health and performance of the WebSphere Application Server. It ensures optimal resource allocation by measuring CPU/memory usage, JVM usage and response time. And it tracks the performance of applications using critical metrics such as Live Sessions, Enterprise Java Beans (EJBs), JDBC connection pools, JMS queues.
The platform will allow you to proactively detect WebSphere issues as they arise. It will also take action before the end-users are affected. Furthermore, it can automate corrective actions—such as increasing database connection pool size or restarting the WebSphere server when the memory usage increases—with the help of custom scripts.
There’s a lot more that can be done with this tool. For instance, you can track application response times with code-level information about your application performance monitoring environment. Its transaction tracing feature will let you detect slow transactions. It will monitor database query executions and track background transactions.
The ManageEngine Application Manager is available in several editions. There’s a feature-limited Free edition as well as a Professional and an Enterprise paid versions. Pricing starts at $945 and details can be obtained by contacting ManageEngine. A free 30-day trial version is also available.
4. Dynatrace
Dynatrace is a cloud-based Software as a Service (SaaS) that can detect, solve and optimize applications automatically. Discovering and mapping a complex application ecosystem is simply a matter of installing the Dynatrace OneAgent on the target servers. The tool can give you a high-fidelity view of your entire application stack, from the performance of applications, cloud infrastructure, and user experience. It will help you effortlessly detect problems along with their business impacts and root cause.
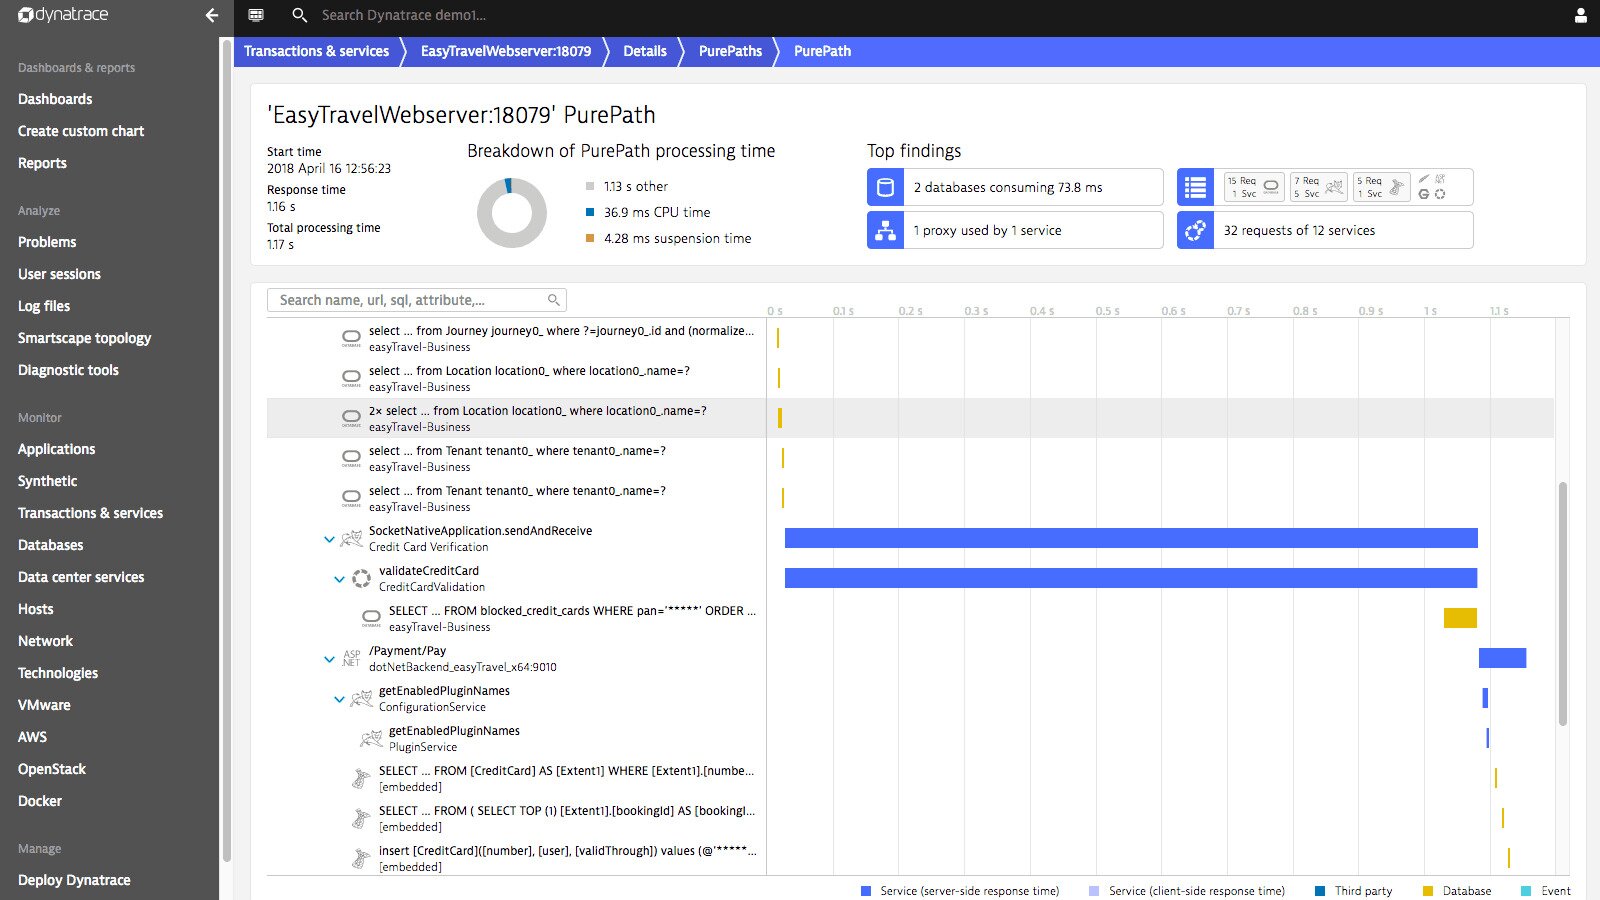
Dynatrace claims to have the broadest coverage of any monitoring solution in terms of languages supported, application architectures, cloud, on-premise or hybrid, enterprise apps, SaaS monitoring, and more. The tool automatically discovers and monitors dynamic microservices running inside containers. It shows you how they’re performing, how they communicate with each other and it helps you quickly detect poorly performing microservices.
When it comes to monitoring your WebSphere infrastructure, Dynatrace monitors and analyzes the database activities of your Java applications running on WebSphere and provides you with visibility all the way down to individual SQL and NoSQL statements. Here are just a few of the performance metrics you will see on your Dynatrace dashboard when monitoring WebSphere:
- JVM metrics
- Custom JMX metrics
- Garbage collection metrics
- All database statements
- All requests
- Suspension rate
- All dependencies
Like it is often the case with products of this type, pricing for Dynatrace is not readily available and can only be obtained by first signing up for the free 15-day trial. Then, its only a matter of installing the agent on your servers and you could be monitoring within 5 minutes.
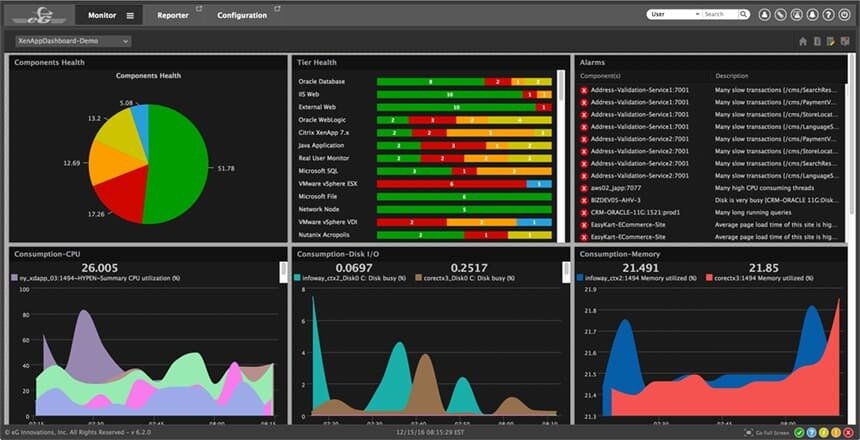
5. eG Enterprise
eG Innovations, the maker of EG Enterprise might not be the best-known company but the product still offers network administrators a complete monitoring solution. This is a full-stack application performance monitoring (APM) solution that provides in-depth performance visibility into the WebSphere Application Server as well as the Java applications running on it. It will provide WebSphere performance monitoring from a single pane of glass, and let you be the first to know when there are slow application transactions, high web service response time, problems in EJB invocation, hung threads, faults in JCA Connection Pools, JVM memory leaks, and more.
eG Enterprise can help administrators monitor WebSphere performance and understand and provide insights to troubleshoot problems before application users are affected. Developers can also benefit from the tool as they can get immediate access to problematic Java code or SQL queries that impact application performance.
The eG Enterprise WebSphere monitoring tool will automatically correlate WebSphere performance with server-side issues, resource deficiency (CPU, memory, disk, etc.), hardware faults, network latency, etc. It can trace business transactions across distributed application architecture and multi-tiered JVMs. It will also identify which component of the server-side infrastructure is taking more processing time and slowing down transactions. Furthermore, it will track down the exact line of Java code or SQL query that is causing a performance problem and isolate high-CPU threads, waiting threads and root blocker threads in the JVM for code optimization.
eG Innovations offers both a free trial and a live demo of its eG Enterprise tool. There is, however, no pricing information on the company’s website so you’ll have to contact them to get a customized quote.
In Conclusion
The main question many people will be asking themselves after reading this post is “Should I get a WebSphere Application Server?”
Let’s try to answer this burning question. If your organization is one of those with numerous, independent Java-based applications and they need to talk to other external systems then the answer is a resounding yes.
Even more so if this is critical to your business process. That is, of course, if you can afford it. As we mentioned, these systems don’t come cheap.
And once you take the plunge, any of the tools we’ve just reviewed will provide much-appreciated assistance in ensuring that this complex environment is always kept in its utmost order and that all is running smoothly at all times.