

Best J-Flow Monitoring Tools for Network Professionals
Properly managing a network requires that one use the right equipment and software to get the necessary visibility to ensure everything is running smoothly. Unlike road traffic where slowdowns and obstructions can easily seen—and therefore pinpointed, network traffic is not something that’s easy to see. This is why technologies such as J-Flow analysis can come to be helpful. Today, we’re reviewing the best J-Flow monitoring tools

We’ll begin our journey by discussing the different methods network administrators can use to monitor their network. This will allow us to better understand where technologies such as J-Flow fit within the network administrators tool arsenal. We’ll do our best to explain what J-Flow is, how it works and how it differs from other flow analysis technologies. We will then dive into the core of the matter and introduce the top J-Flow monitoring system available. We have a combination of free and paid software.
About Network Monitoring
One of the responsibilities of any network administrator is to make sure the network is running smoothly, that there are no slowdowns and that all network traffic gets to its destination within an acceptable time. Unfortunately, what happens on a network happens within cables, routers, switches and other equipment where it is typically very hard to see what’s going on. This is where the concept of network monitoring comes from. Network monitoring tools let administrators can gain some visibility on what’s going on inside the network.
A Variety Of Tools
There are several tools that administrators can use to monitor their network. The most basic are command-line diagnostic tools. You probably know them and are using them constantly. Ping, for instance, allows you to validate that a given IP address can be reached and provide some statistics on round-trip delays and packet loss. Tracert–or traceroute, depending on your operating system–will trace the complete network path between two devices. Nmap will list all the devices that are present on a specific subnet.
SNMP Monitoring tools are also commonly used by administrators. Using the Simple Network Management Protocol, these tools let administrators see how much traffic is going by at specific points on their networks. As good as they are, SNMP monitoring systems have on big shortcoming. Although they’ll tell you how much traffic is going by, they won’t tell you what that traffic is. TO get this level of detail, you need to up your monitoring to the next level, flow analysis.
Flow Analysis Systems
Flow analysis relies on the networking devices themselves to send detailed traffic information to collectors and/or analyzers which can, in turn, interpret flow data and present it in meaningful ways. The most common flow analysis protocol is called NetFlow. It was created by Cisco Systems several years ago but it is now commonly used in one form or another on networking equipment from most major manufacturers. Some manufacturers, such as Juniper Networks, for instance, have developed their own version of NetFlow. Many third-party protocols are functionally identical to NetFlow while others are improved versions. Juniper’s J-Flow is one of these improved protocols.
J-Flow Explained
A typical Flow monitoring setup consists of three main components:
- The flow exporter aggregates packets into flows and exports flow records towards one or more flow collectors.
- The flow collector is responsible for reception, storage and pre-processing of flow data received from a flow exporter.
- Finally, the analysis application is used to analyze received flow data. Analysis can be used for traffic profiling, or for network troubleshooting.
As a direct descendant of NetFlow J-Flow relies on the networking devices themselves to collect network traffic as it enters or exits an interface. They collect details on each conversation or flow—hence the name—and then export that data in the form of a flow record to some sort of analysis tool. The collected data about each flow include such information as the input and output interfaces, the start and finish time stamps of the flow, the number of bytes and packets it contains, the layer 3 headers, the source and destination IP address and port number, the IP protocol, and the TOS value. Flow records don’t contain the actual data that made up the flow. The only contain information about the flow. This is important from a security standpoint.
Except in huge multi-site environment, the flow collectors where the records are sent are often also the flow analyzers. They use the information contained within flow records to present data about network traffic in a way that is useful to network administrators. Different tools will have different ways of presenting data.
The Best J-Flow Monitoring Tools
We’ve searched the market for the best J-Flow monitoring tools. With J-Flow being such a close descendant of NetFlow, our top products are actually NetFlow collector and analyzers but they will work fine with J-Flow as well. Our top five tools are listed below in no specific order. We’ve tried to highlight each tool’s best features. Choosing the best tool for your specific situation largely depends on your specific needs but also on personal preferences.
1. SolarWinds NetFlow Traffic Analyzer (30-day free trial)
SolarWinds if often a familiar name with network administrators. The company makes some of the best software for network and system administration. Its flagship product, the SolarWinds Network Performance Monitor is one of the best SNMP network monitoring system. And likewise, the SolarWinds NetFlow Traffic Analyzer, an add-on module to the Network Performance Monitor, is one of the best flow collector and analyzer systems you can find.

Here are some of the SolarWinds NetFlow Traffic Analyzer’s best features:
- It can monitor Bandwidth use by application, protocol, and IP address group.
- It can collect and analyze flow data Juniper’s J-Flow, Cisco’s NetFlow, InMon’s sFlow, Huawei’s NetStream, and the IETF standard IPFIX and identify which applications and protocols are the top bandwidth consumers.
- It collects traffic data, correlating it into a usable format, and presenting it to the user in a web-based interface for monitoring network traffic.
- It Identifies which applications and categories consume the most bandwidth for better network traffic visibility with Cisco NBAR2 support.
It is also a great troubleshooting analysis tool and it allows you to drag and drop network performance metrics on a common timeline giving immediate visual correlation across all your network data flow analytics. The system will also measure the effectiveness of pre- and post-policy traffic levels per class map letting you determine if QoS policies are working as planned. The SolarWinds NetFlow Traffic Analyzer will help confirm that prioritized traffic passes smoothly through the network.
Reporting is another strength of this tool. You can create, schedule, and deliver in-depth network traffic analysis and bandwidth reports with just a few clicks. The software’s reports will help you review historical data and identify peak bandwidth usage, letting you adjust policies for better management.
Coupled with the SolarWinds User Device Tracker, you can identify bandwidth hogs slowing down the network. UDT can provide user contact info and switch port location. You can use that information to notify the user to reduce their bandwidth usage or to remove them from the network.
Prices for the SolarWinds NetFlow Traffic Analyzer start at $1,915 and varies according to the size of the underlying NPM license. If you don’t already own the Network Performance Monitor, you’ll need to factor in the price of that tool too. But if you want to try it before you buy it, both products can be downloaded as a fully functional 30-days evaluation version.
2. PRTG Network Monitor
Despite a somewhat misleading name, the Paessler Router Traffic Grapher, or PRTG is, at its core, an all-in-one solution whose primary purpose is monitoring bandwidth utilization using SNMP. It’s also used to monitor the availability and health of different network resources. As such, it’s another very useful tool for network administrators. PRTG can monitor multiple sites and it can monitor LAN, WAN, VPN and Cloud Services.
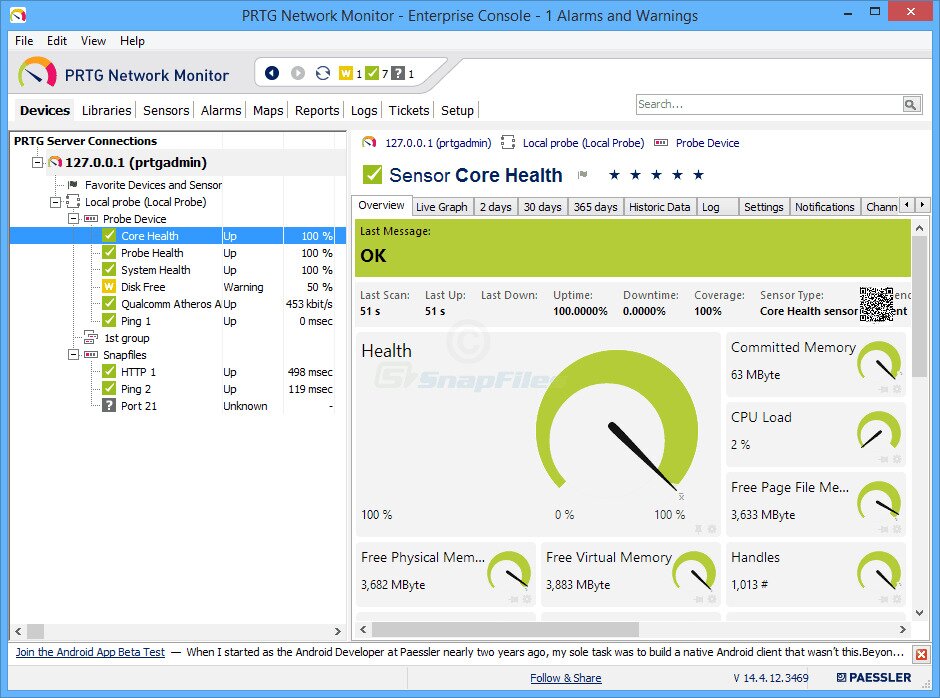
In the context of this article, though, PRTG’s primary use is as a flow collector and analyzer. This product is expandable thanks to a multitude of sensors that can be used to monitor various types of data. As such, this product is not just a flow collector and analyzer. In fact, it uses several technologies to monitor systems, devices, traffic, and applications. Here’s an overview of the available sensors
- SNMP with ready to use and custom options
- WMI and Windows Performance Counters
- SSH for Linux/Unix and MacOS systems
- Flows (like Juniper’s J-Flow, Cisco’s NetFlow or InMon’s sFlow) and Packet Sniffing
- HTTP requests
- REST APIs returning XML or JSON
- Ping, SQL and many more
Installing PRTG is easy. In fact, the vendor claims you could be up within a couple of minutes. After you’ve run the installer, the auto-discovery process will discover devices and set up sensors. You then need to add optional sensors–such as flow collectors–manually. A detailed video showing you how it’s done is available. The server runs on Windows only but the user interface is web-based and can be accessed from any browser.
PRTG is available in two versions. There’s a free version that is limited to 100 sensors. A sensor is not equal to a device. It is, instead, the most basic element that can be monitored. For example, to monitor each port of a 48-port switch, you’ll use up 48 sensors. For flow analysis, you’ll use up one sensor per flow source.
For more than 100 sensors, a license must be purchased. They are available for 500, 1000, 2500, or 5000 sensors quantity and there’s also an unlimited license. Prices vary from around $1 600 to just under $15 000. Note that the free version will allow unlimited sensors for the first 30 days so you can use it to thoroughly test-drive the product.
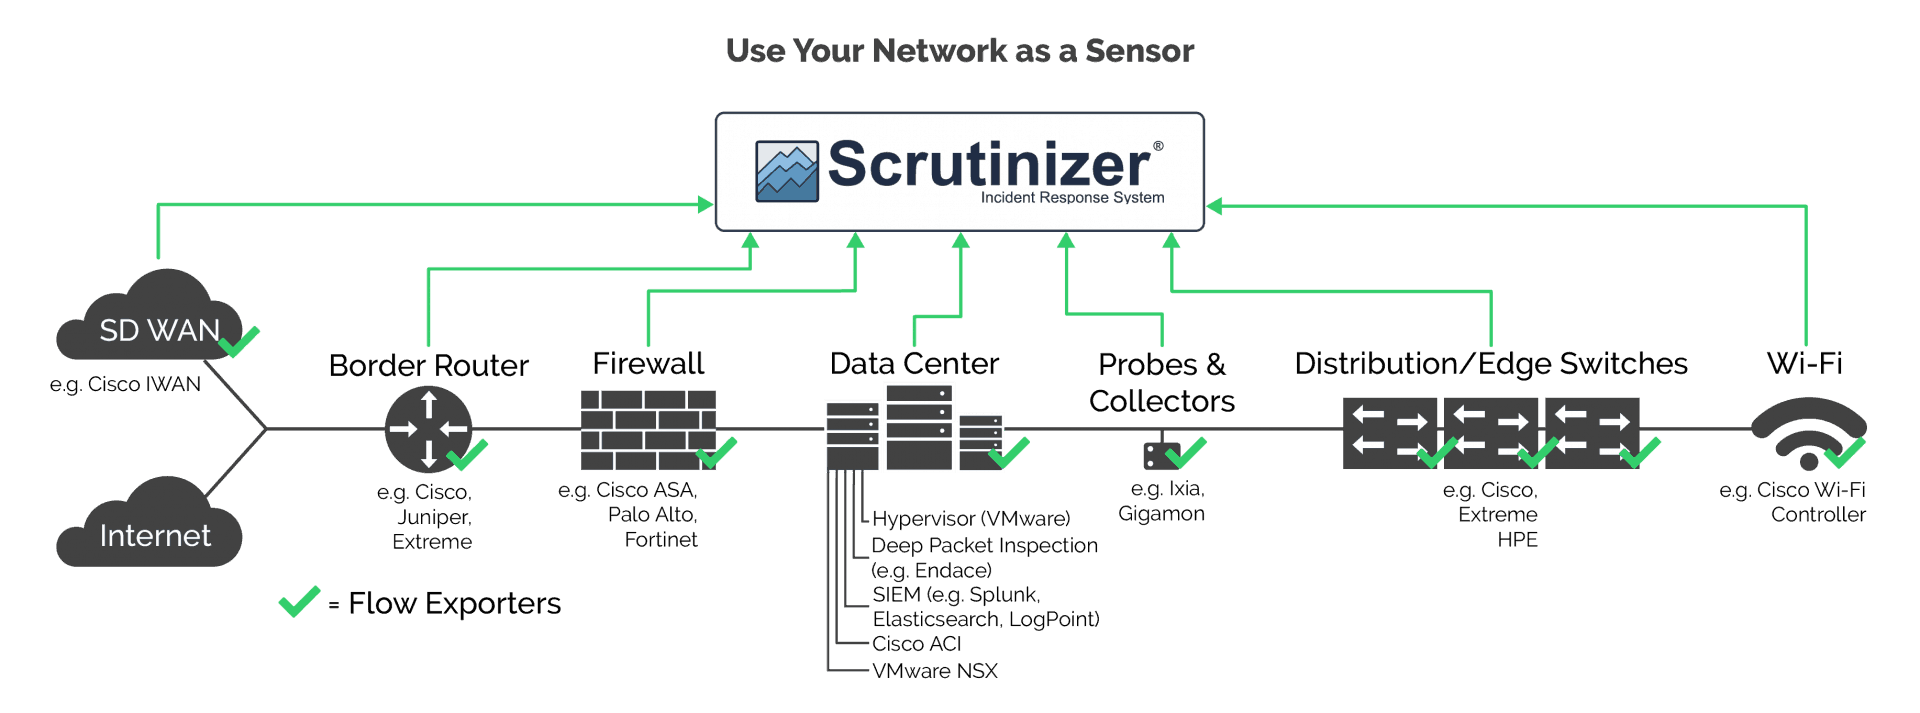
3. Scrutinizer
Scrutinizer from Plixer is another great flow analyzer system. Actually, it is so packed with features that it can even be considered as a full-fledged incident response system. With its ability to monitor different flow types such as Juniper’s J-Flow. Cisco’s NetFlow, Huawei’s NetStream, and IETF’s IPFIX, you’re not limited to monitoring only Juniper devices. Scrutinizer is built with a hierarchical design. The product offers streamlined and efficient data collection and allows you to start small and easily scale way up to millions of flows per second.
With the network often being first blamed whenever anything goes wrong, Scrutinizer will let you quickly find the actual root cause of most network issues. And to make things even better, the product works in both physical and virtual environments. Reporting is another strong point of this product and it’s advanced reporting features are impressive.
Scrutinizer is available in four license tiers. They range from the basic free version to the full-fledged SCR level which can scale up to over 10 million flows per second. The free version is limited to 10 thousand flows per second and it will only keep raw flow data for 5 hours but it should be more than enough to troubleshoot most network issues. You can also try any license tier for free for 30 days after which it will revert back to the free version.
4. ManageEngine NetFlow Analyzer
ManageEngine is yet another household name with network administrators. And the ManageEngine NetFlow Analyzer is one of the reasons. This product gives the network administrator a detailed view of network bandwidth utilization as well as traffic patterns. It effectively combines the functionality of an SNMP network monitoring tool and that of a flow collector and analyzer. It is controlled through a web-based interface and offers multiple different views of your network.
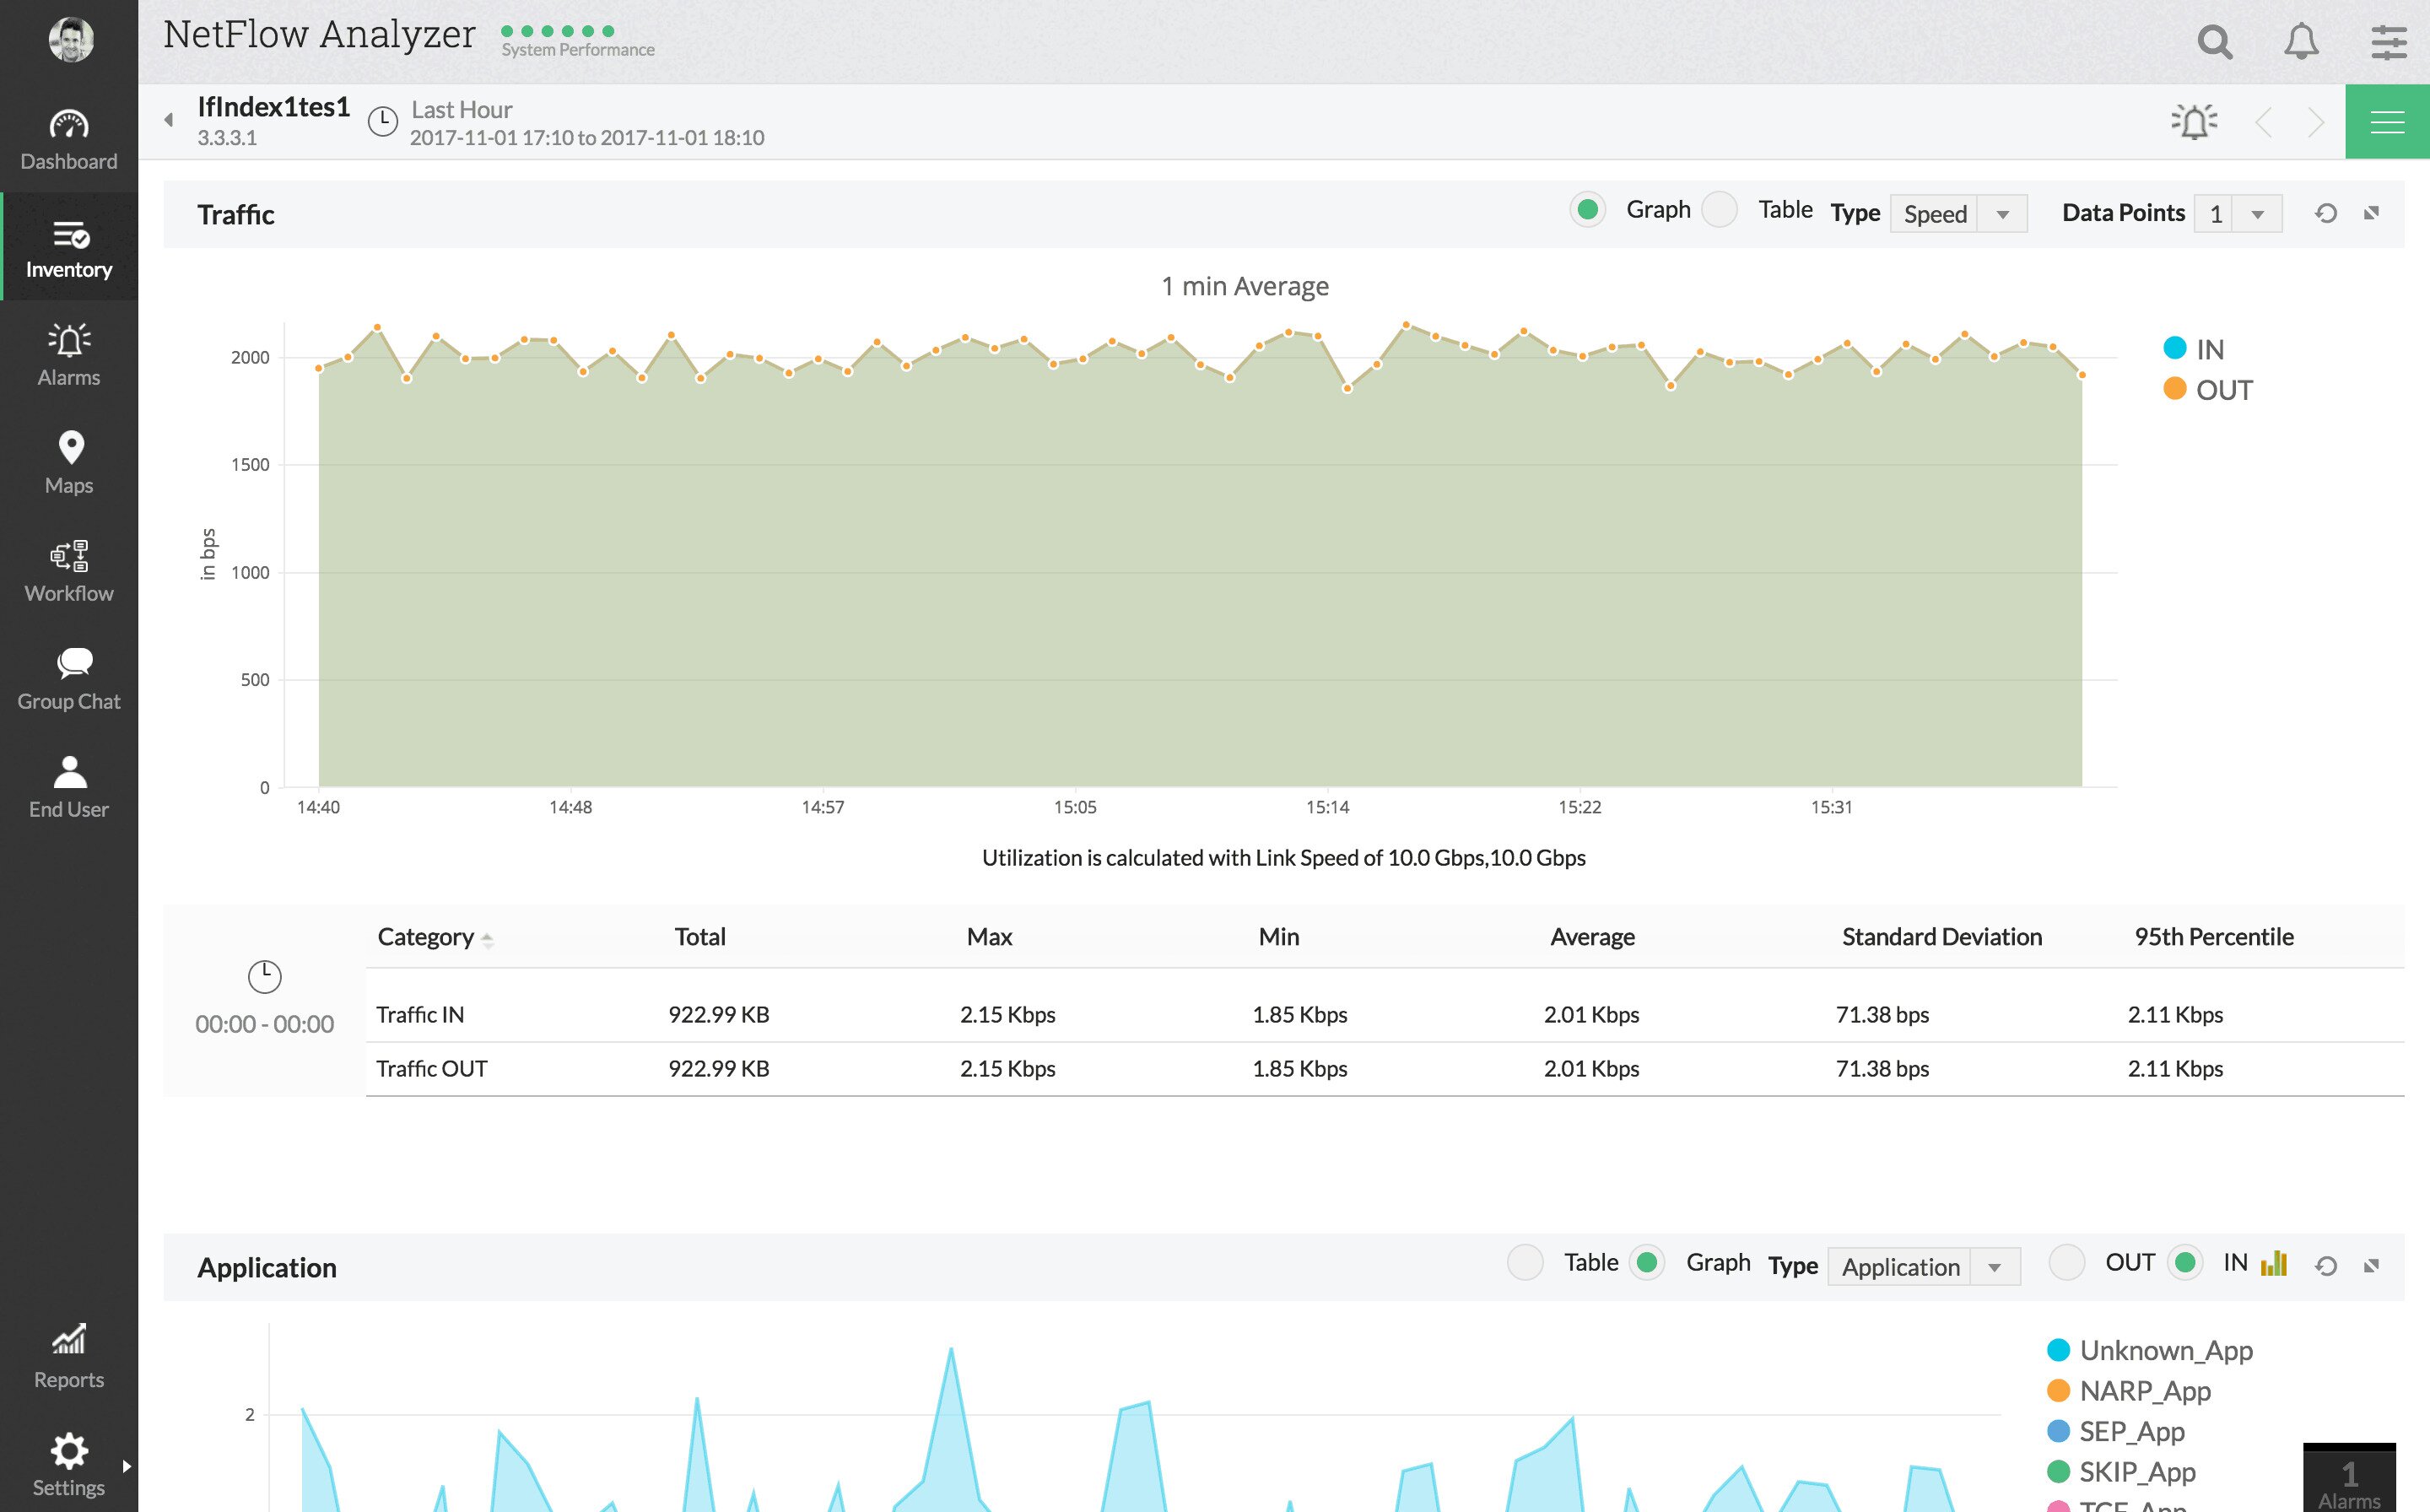
For example, you can view traffic by application, by conversation or by protocol. There are also several more viewing options. The tool also lets you set alerts to warn you of potential issues. For example, you could set a traffic threshold on a specific interface and be alerted whenever the bandwidth utilization exceeds it.
A lot of the strength of the ManageEngine NetFlow Analyzer comes from its reports and dashboard. There are several useful pre-built reports that are custom-tailored for specific purposes such as troubleshooting, capacity planning or billing. And you’re not stuck with the built-in reports. This powerful tool also allows administrators to create custom reports to their liking. As for the tool’s dashboard, it is just as impressive. It includes several pie charts with things such as top applications, top protocols or top conversations. It can also display a heat map with the status of the monitored interfaces. And as you can expect from a product of this quality, dashboards can be customized to include any information you may find useful. The dashboard is also where alerts are displayed in the form of pop-ups. And for the on-the-go network administrator, there are smartphone apps that will let you access the dashboard and reports from your favorite device.
The ManageEngine NetFlow Analyzer supports most flow technologies including Juniper’s J-Flow (of course), Cisco’s NetFlow, IETF’s IPFIX, Huawei’s NetStream, and a few others.
Like many competing products, the ManageEngine NetFlow Analyzer comes in two versions. The free version is identical to the paid one for the first 30 days but it will then revert to monitoring only two interfaces or flows. If you opt for the paid version, licenses are available in several sizes from 100 to 2500 interfaces or flows at prices varying between about $600 to over $50K plus annual maintenance fees.
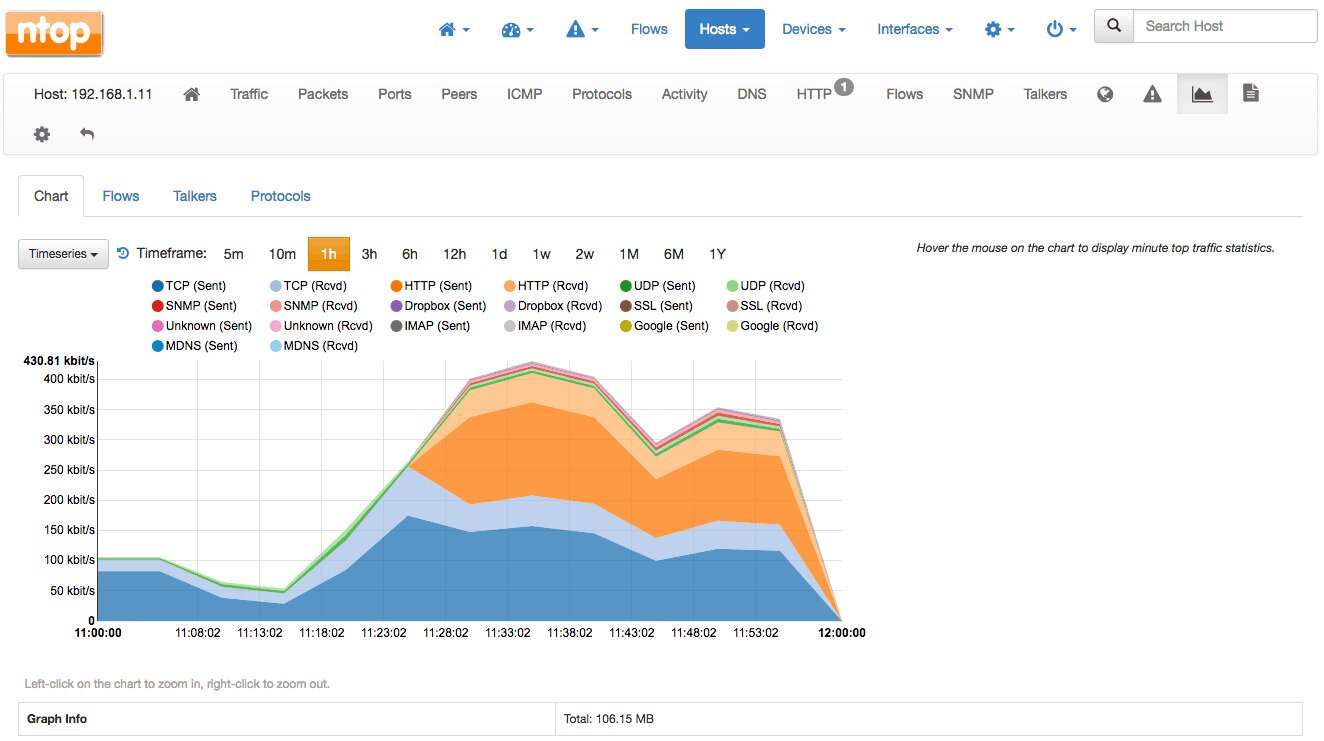
5. nProbe and ntopng
We weren’t sure if we should include nProbe and ntopng on this list. The pair constitutes a somewhat more complicated open-source tool. ntopng—a direct descendant of command-line utility ntop—is a web-based traffic analysis tool for monitoring networks based on flow data while nProbe can act as either a pure J-Flow/NetFlow/IPFIX probe which captures packets and turn them into flows. Nprobe can also act as a pure flow collector, receiving external flow data and storing it on disk or in a database. nProbe can also combine both functionalities and it can also act as a flow proxy, collecting flow data in one format and outputting it in another. Together, nProbe and ntopNG make for a very flexible analysis package.
There’s a free community version of ntopng and you can also purchase enterprise versions. They can be expensive but they are free to educational and non-profit organizations. As for nProbe, you can try it for free but it is limited to a total of 25 000 exported flows. To go beyond that, you’ll need to purchase a license.
Like most modern network analysis tools, ntopng features a web-based user interface which can present data in different ways such as top talkers, flows, hosts, devices, and interfaces. It has a mix of charts, tables, and graphs, many of which have drill-down functionality that let you explore them in greater depth. The interface is very flexible and allows for a lot of customization.
Wrapping Up
While all the products reviewed here are primarily NetFlow analyzer, Juniper’s J-Flow technology is similar enough that they will work as well with it.
And if you’re wondering what the best tool is, you can’t go wrong with the SolarWinds Netflow Traffic Analyzer. The other four products reviewed are also great options. They may not be as full-featured or they may require a bit more work to set them up but any of them will do the job well. And since they all offer some form of free trial, there’s no reason not to try them all.