

Monitoring Bandwidth On Linux: Top 5 Tools in 2026
Don’t we all wish our networks had infinite bandwidth? The reality is, however, that it is often a severely limited resource. Add to that the fact that bandwidth over-utilization can have huge impacts on network performance and we have a recipe for disaster.
The solution: set up some bandwidth monitoring system. A lot of them are available. Most of them run on Windows, though, and if your OS of choice it Linux, your options are slightly more limited. You still have plenty of options, however, and we’re about to introduce the best tools for bandwidth monitoring on Linux.
We’ll begin by introducing bandwidth monitoring and explain what it is. Next, we’ll cover the ins and outs of the Simple Network Management Protocol, or SNMP, one of the most-used monitoring technology. Our next order of business will be to have a look a Linux as an operating system but, more specifically, as a platform for monitoring tools. And finally, we’ll briefly review some of the best tools for bandwidth monitoring on Linux and describe their best features.
About Bandwidth Monitoring
Network bandwidth monitoring is a very specific type of monitoring. What it does is measure the amount of traffic traversing one or many specific locations on a network. Typically, the measuring points are router or switch interfaces but it’s not at all uncommon to monitor bandwidth utilization of a server’s LAN interface. The important thing here is to realize that all we’re measuring is the amount of traffic. Bandwidth monitoring won’t give you any information about what that traffic is, only how much of it there is.
There are several reasons for wanting to monitor network bandwidth utilization. First and foremost, it can help you pinpoint areas of contention. As a network circuit’s utilization grows, its performance starts degrading. There’s, unfortunately, nothing we can do about that. The more you approach the maximum capacity, the more impact there is on performance. By allowing you to keep an eye on network utilization, bandwidth monitoring tools give you a chance to detect high utilization—and address it—before it becomes noticeable by users.
Capacity planning is another major benefit of network monitoring tools. Network circuits—especially long-distance WAN connections—are expensive and will often only have whatever bandwidth was originally required when they were first installed. While that amount of bandwidth might have been just right back then, it will eventually need to be increased. By monitoring the evolution of your network circuits’ bandwidth utilization, you’ll be able to see which ones need to be upgraded and when.
Bandwidth monitoring tools can also be useful for troubleshooting poor application performance. When a user complains that some remote application has slowed down, looking at the network bandwidth utilization can give you a pretty good idea whether or not the problem is caused by network congestion. If you see low network utilization, you can likely concentrate your troubleshooting efforts elsewhere.
Introducing The Simple Network Management Protocol (SNMP)
Many (if not all) network bandwidth monitoring tools rely on the Simple Network Management Protocol (SNMP) to do their magic. That’s because most networking equipment has built-in SNMP capability and can be polled by monitoring tools at regular intervals. However, despite its name which could lead you to think otherwise, SNMP is actually rather complex. But don’t worry, you don’t have to be an expert and know all about it to use it. It’s just like you don’t have to be an auto mechanic to drive a car. It is, however, preferable to have at least some idea of how it works so let’s have a look at that.
At its base, SNMP is a communication protocol that specifies how an SNMP management system can read and write operational parameters in remote devices. The parameters are referred to as Object Identifiers or OIDs. Some of the interesting OIDs, from a monitoring standpoint, are those that contain major device metrics such as CPU and memory load or disk usage, for example. But when monitoring networking bandwidth utilization, two OIDs are of particular interest. They are the bytes out and the bytes in counters associated with each interface. They are automatically incremented by the network devices as data is output or input.
Dating back to a time when IT security was not an issue, SNMP only has minimal security. An SNMP manager connecting to an SNMP-enabled device will transmit a “community string” with its request. If the string matches that configured in the equipment, the request will be carried out. Devices typically have two community strings configured, one for read-only OIDs and one for modifiable ones. The communication is not encrypted and anyone intercepting it would see the community strings in clear text. This is why SNMP is only used on private, secure networks.
How It Works In Real-Life
Here’s how most monitoring systems use SNMP to monitor bandwidth utilization. They periodically read the bytes in and out counters of a networking device’s interfaces at know intervals. Five minutes is a typical interval value but shorter times can be used for finer resolution. They then store the polled values in some sort of database or file.
The rest of the process is just mathematical calculations. The monitoring system subtracts the previous counter value from the current one to get the number of bytes transmitted or received during the polling interval. It can then multiply that number by eight to get the number of bits and divide it by the number of seconds in the interval to get the number of bits per second. This information is typically plotted on a graph showing its evolution in time and stored in a database.
It is important to note that what you get is a calculation of the average utilization over the polling interval, not the real bandwidth utilization. Let’s, for example, pretend that a circuit is used at maximum capacity during half of the polling interval and carries no traffic at all during the other half. It would show up as being used at 50% of its capacity despite being maxed out for an extended period. Shorter polling intervals will reduce this distortion but it is important to keep in mind that these systems only give you average values.
Using Linux As A Monitoring Platform
As an operating system, Linux is not, functionally speaking, any different from any others such as Windows or Mac OS. The main difference between Linux and other popular operating systems is the fact the Linux is an open-source endeavour and most distributions are available for free. Many people tend to confuse open-source and free. It is true that open source software is often free but it is not necessarily the case. For instance, the Red Hat Enterprise Linux operating system is not free. To add to the confusion, actors of the open-source movement often refer to open-source software as free software with free implying freedom rather than the absence of cost.
Over the years, Linux, which was once a marginal operating system installed by nerds and computer science students—I recall spending weeks downloading SLS Linux one diskette image at a time over a 1200 baud dialup connection; I most definitely was one of those nerds—has grown to be a popular option as a server operating system. Some recent distributions are also making much progress as a viable alternative to Windows as a personal computer operating system although this is a totally different debate.
While Linux is a popular operating system for servers of all kind, it is even more so when it comes to running specific tools. There are several free and open-source network bandwidth monitoring tool that will only run on Linux. And if your tool of choice can run on either Windows or Linux, wouldn’t it make more economic sense to run in on a free operating system rather than waste some money on a costly one?
While some people still don’t trust free and open-source operating systems and software for mission-critical applications and wouldn’t, for instance, put their precious corporate data on a MySQL server running on Linux, many of them don’t usually have as many objections to using the platform for running network administration tools. One major advantage of using Linux as the underlying platform for network monitoring tools is that it is easy to set up a Linux server with only the required packages. While this can be done with Windows, it is considerably more complicated.
The Top Tools For Monitoring Bandwidth On Linux
We’ve searched the web for some of the best bandwidth monitoring tools that can run on Linux. What we came up with are some commercial products and some free and open-source ones. Some products on our list can be installed on either Linux or Windows while some are Linux-only. They all offer SNMP bandwidth monitoring and they all have a centralized console where you can configure the tool and see the monitoring results. While there are a few command-line only tools, we’ve excluded them from our list.
1. ManageEngine OpManager
The ManageEngine OpManager is a powerful all-in-one network monitoring tool that offers comprehensive network monitoring capabilities. It can help you keep an eye on network bandwidth utilization, detect network faults in real-time, troubleshoot errors, and prevent downtime. The tool supports various environments from multiple vendors and can scale to fit your network, regardless of its size. It can run on either Linux or Windows and will let you monitor your devices and network and give you visibility over your entire network infrastructure. Installation and setup of this product are both quick and easy. You can get it running in under two minutes. It requires no complex installation procedures and comes bundled with built-in databases and web servers.
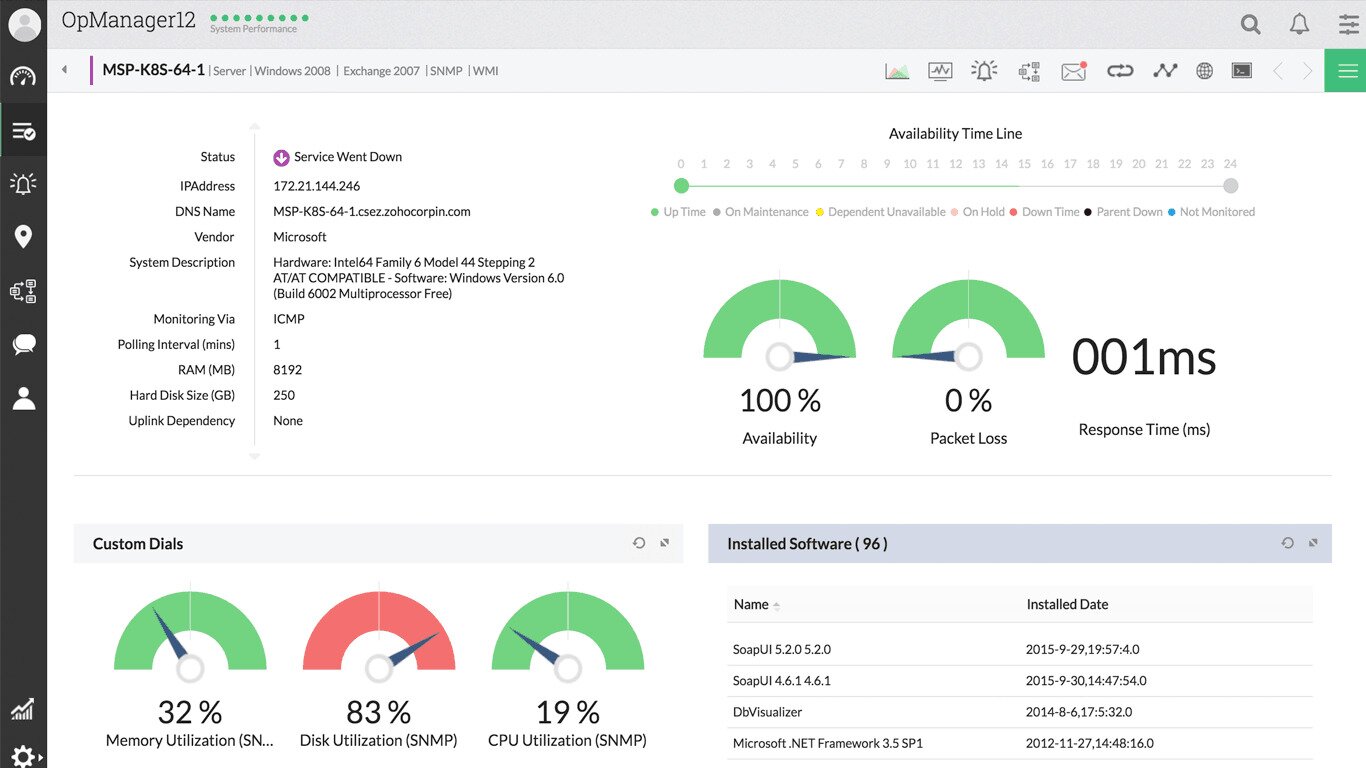
The ManageEngine OpManager constantly monitors network devices’ performance in real-time and displays it on its live dashboards and graphs. In addition to bandwidth, it examines several critical operational metrics such as packet loss, errors and discards, etc.
The tool can help you detect, identify, and troubleshoot network issues with its threshold-based alerts. You can easily set multiple thresholds for every performance metric and get notifications when they are exceeded. Reporting is another area where this tool shines. Intelligent reports will let you get detailed insights on network performance. There are more than 100 built-in reports and you can customize, schedule and export these out-of-the-box reports as needed.
2. Nagios
There are two versions of Nagios available. There’s the free and open-source Nagios Core and there’s the paid Nagios XI. Both share the same underlying core engine but the similarity stops there. Nagios Core is an open-source monitoring system that runs on Linux. The system is completely modular with the actual monitoring engine at its core, hence the name. The engine is complemented by dozens of available plugins which can be downloaded to add functionality to the system. Each plugin adds one or several features to the core.

Preserving the modular approach, the tool’s front-ends is also modular and several different community-developed options are also available for download. The Nagios Core, the plugins and the front end combine and make for a rather complete monitoring system. There is a drawback to this modularity, though, as setting up the product can turn out to be a challenging task.
Nagios XI is a commercial product based on the Nagios Core engine but it is a complete self-contained monitoring solution. The product targets a wide audience from small businesses to large corporations. It is much easier to install and configure than Nagios Core, thanks to its configuration wizard and auto-discovery engine. Of course, this ease of setup and configuration comes at a price. You can expect to pay around $2 000 for a 100-node license and about ten times as much for an unlimited one.
3. Zenoss Core
Although Zenoss Core may not be the most popular of all the monitoring tools on this list, it truly deserves to be here mainly because of its impressive feature set and very professional look. The tool can monitor many things such as bandwidth utilization and traffic flows or services like HTTP and FTP. It has a clean and simple user interface and its alerting system is excellent. One thing worth mentioning is its rather unique multiple alerting system. It allows a second person to be alerted if the first one does not respond within a predefined delay. This feature is common in standalone alerting tools but rather rare in monitoring platforms.
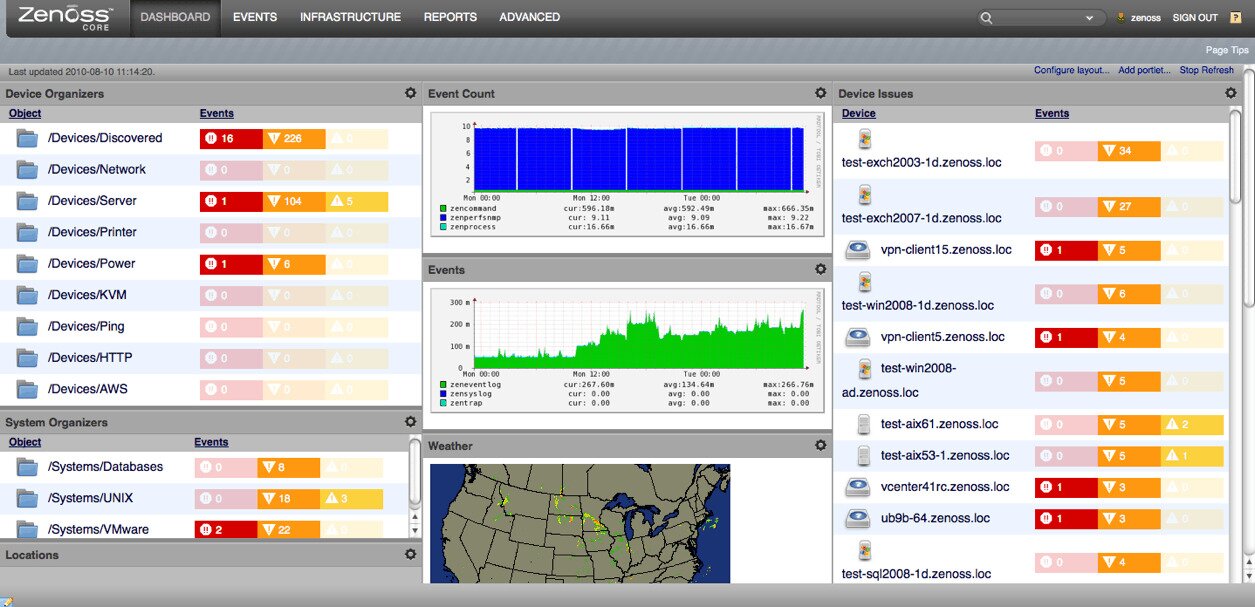
On the downside, Zenoss Core is one of the most complicated monitoring systems to install and set up. Installation is entirely a command-line driven process. Considering that today’s network administrators are used to GUI installers, configuration wizards and auto-discovery engines, this could make the product’s installation seem a bit archaic. Then again, this is in line with the Linux philosophy. On the other hand, there is ample installation and configuration documentation available and the end result makes it worth your efforts.
4. Zabbix
Zabbix is another free and open-source product which can be used to monitor almost anything. The tools can run on several Linux distributions—even including Rapsbian, a Raspberry Pi specific Linux distribution—and it will monitor network bandwidth utilization, servers, applications and services, as well as cloud-based environments. It boasts a very professional look and feel. This product also has a broad feature set, unlimited scalability, distributed monitoring, strong security, and high availability. Despite being free this is a true enterprise-grade product.
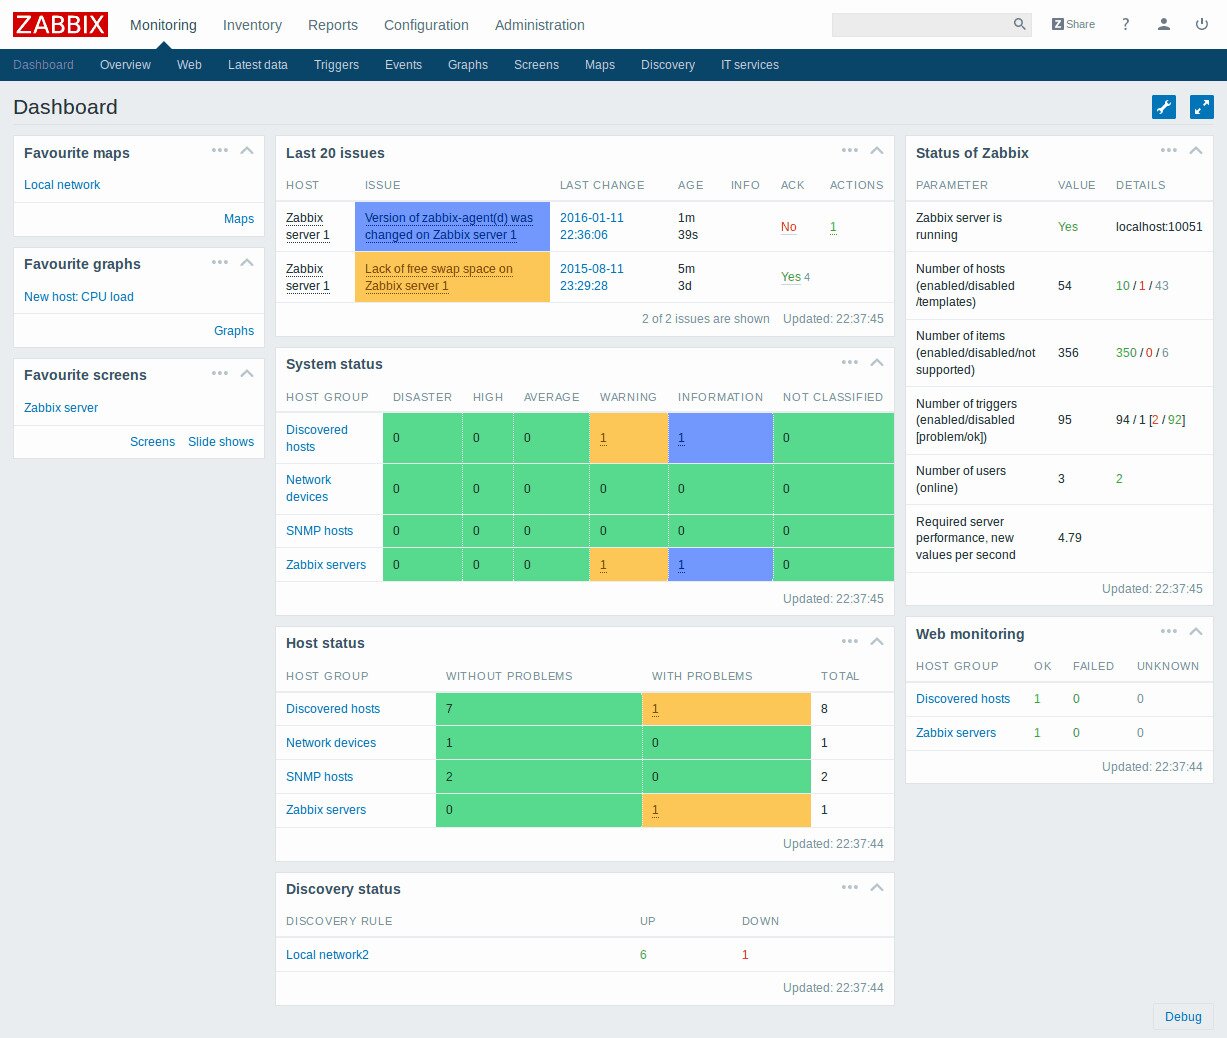
Zabbix uses a combination of monitoring technologies. It supports SNMP monitoring as well as the Intelligent Platform Monitoring Interface (IMPI). It can also do agent-based monitoring with agents available for most platforms. For easy setup, there’s auto-discovery as well as out-of-the-box templates for many devices. The tool’s web-based user interface has several advanced features such as widget-based dashboards, graphs, network maps, slideshows, and drill-down reports. Zabbix also features a highly customizable alerting system which will not only send out detailed notification messages but that can also be customized based on the recipient’s role. It can also escalate problems according to flexible user-defined service levels.
5. Cacti
We had to include Cacti on this list. After all, at almost 18 years of age, it is one of the oldest free and open-source monitoring platform. Furthermore, it is still quite popular to this day it is still actively developed with the latest version just released last June. Cacti might not be as feature-rich as some other products, yet it is still a very good tool. Its web-based user interface has somewhat of a retro feel but it is well laid out and easy to understand and use. Cacti consists of a fast poller, a set of advanced graphing templates, and multiple acquisition methods. Although the tool mainly uses SNMP for polling devices, custom scripts can be devised to fetch data from virtually any source.
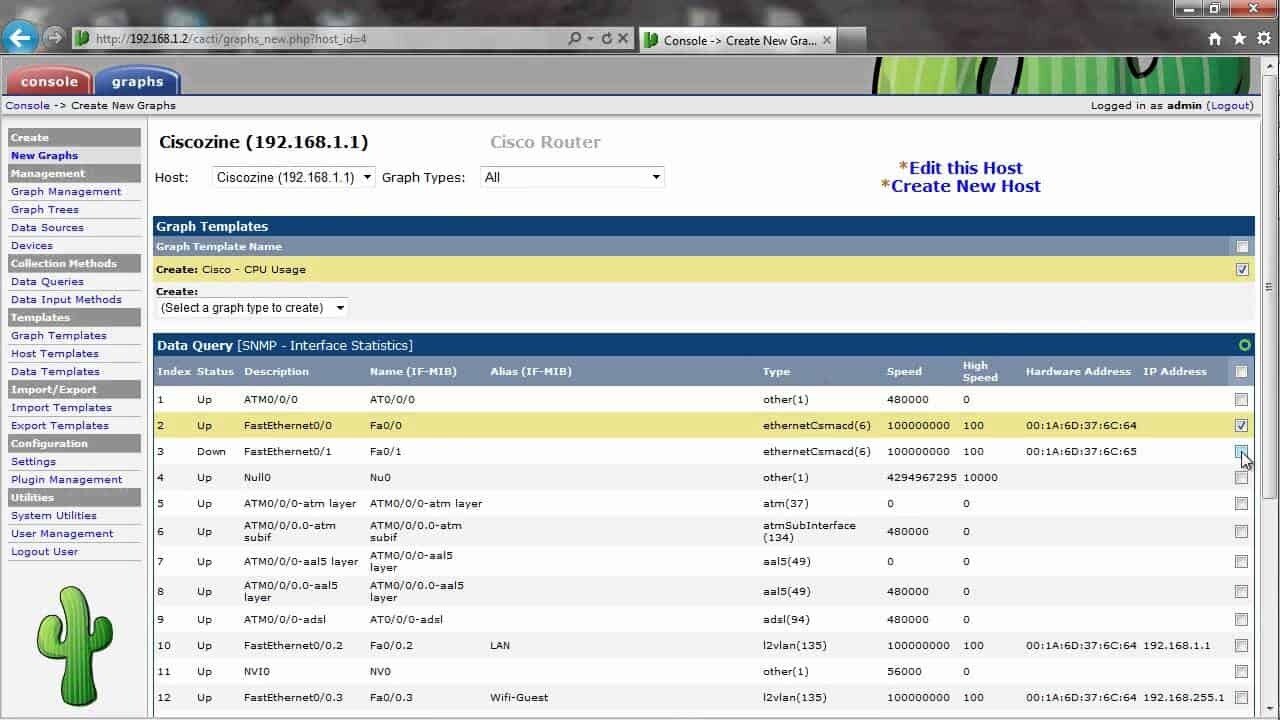
This tool’s main strength is in polling devices to fetch their metrics—such as bandwidth utilization—and graphing the collected data on web pages. It does an excellent job of that but that’s pretty much all it will do. If you don’t need alerting, fancy reports or other extras, the product’s simplicity might be just what you need. And if you need more functionality, Cacti’s source code is available and it is entirely written in PHP, making it highly customizable and allowing anyone to add any missing features they need.
Cacti makes extensive use of templates which account for an easier configuration. There are device templates for many common types of devices as well as graph templates. There’s also a huge online community of users who write custom templates of all kinds and make them available to the community and many equipment manufacturers also offer downloadable Cacti templates.
Wrapping Up
Even if Linux is your platform of choice, we’ve seen how you still have plenty of choices when it comes to bandwidth monitoring tools. And given the Linux philosophy, many of them are free and open-source. In fact, using Linux could let you built a complete and very potent monitoring system with no other investment than the time you’ll spend setting it up.