

7 Best SNMP Monitoring Tools For Linux
SNMP monitoring is by far the most common type of network monitoring technology. It allows administrators of networks of any size to be kept informed of the status of the networks they manage as well as their utilization. Likewise, Linus is also a very common platform that many network administrators have turned to. Although it is not yet as common in the desktop world as the commercial offerings from some mega-vendors, it is very common in the server world. Even IBM has made it its OS of choice on many of its higher-range systems.
Considering all this, it is no surprise that Linux can also be the platform of choice for network monitoring tools. Today, we’re having a look at some of the very best SNMP monitoring tools for Linux.

We’ll start off our discussion by having a look at network monitoring in general and then at the specific case of using SNMP to monitor networks. Without going overly technical, we’ll do our best to explain how SNMP works, especially in the context of monitoring networks. Then, we’ll hit the core of the subject and give you a brief review of some of the very best SNMP monitoring tools for Linux.
Just so that everything is clear, we’re talking here about SNMP monitoring tools that run on the Linux operating system and not SNMP tool used to monitor Linux systems. On the other hand, nothing stops you from using a Linux-based monitoring tool to monitor your Linux machines.
About Monitoring Networks
For a network administrator, congestion is the number one enemy. If you compare a network to a highway where traffic is the network’s data, network congestion is similar to traffic jams. But unlike automobile traffic—where congestion can easily be spotted by simply looking at the road—network traffic happens within cables, switches, and routers where it’s invisible. Furthermore, it all happens at blazing speeds. Even if it was visible, it would happen too fast for us to see it. This is why network monitoring tools are so important. They provide network administrators with the visibility they need to ensure things are running smoothly. They can identify congestion or other issues, allowing administrators to take the necessary measures to address the situation.
Another important benefit of network bandwidth monitoring tools is with capacity planning. There is no way around the fact that network usage always grows over time. Just like disk space, the more you have, the more you need. While the current bandwidth of your network might be sufficient now, it will eventually need to be increased. By monitoring bandwidth usage, you’ll be able to plan the bandwidth upgrade before over-utilization becomes a problem.
SNMP To The Rescue
The Simple Network Management Protocol (SNMP) is a complex—despite a somewhat misleading name—technology that can be used to remotely monitor, configure and control many different types of networking equipment. Fortunately, you don’t have to know everything about SNMP to use it to monitor a network’s bandwidth utilization. For now, let’s just state that SNMP is used by monitoring tools to read networking devices’ interface counters and use that data to compute the bandwidth usage and graph its evolution over time. In the next section, we’ll go into more details the inner workings of the Simple Network Management Protocol, ensuring you have enough information to configure and use any SNMP network monitoring tool.
SNMP Explained
Many SNMP tutorials tend to be rather technical and tell you all about MIBs and OIDs. We don’t feel, however, that you have to know everything about SNMP to use it. It’s somewhat like a car. You don’t have to know all about how the engine works to drive one. So, our goal today is to give you just enough information so that you can understand, use, and configure SNMP network monitoring tools, not to make you an SNMP expert, which is something that will come with experience.
First things first, how does one connect and authenticate to an SNMP-enabled device? It is very simple albeit not very secure. On each SNMP device, parameters called community strings are set. You can think of community strings as SNMP passwords. There are typically two community strings configured on each device. One of them is used for read-only access while the other will let one modify some parameters. They can have any value you want and their respective defaults are often set to “public” and “private”. While this is a simple and efficient authentication scheme, it is not secure at all as the community strings are transmitted in clear text over the network and could be intercepted and compromised. This is one reason why many administrators don’t configure read/write community strings on the devices they manage.
ALSO READ: SNMP Traps Explained – Best Tools to Receive and Handle Traps
So, let’s say that an SNMP network monitoring system connects to a network device using the read-only community string. There are many different operational parameters that can be remotely read. Of particular interest when it comes to bandwidth monitoring are a few metrics called interface byte counters. There’s a pair of them—one for input and one for output—for each network interface. They are simply incremented by the device as bits are received and transmitted on an interface. By reading these values periodically at know intervals—every five minutes is typical, the monitoring tool can compute the number of bits per unit of time–usually per second–which is exactly how bandwidth is expressed.
Concretely, here’s how it’s done: The monitoring tool will poll a device and read its counters. Then, five minutes later, it will read the same counters again. By subtracting the previous value of the counters from the current one, the total number of bytes transferred in and out over the past five minutes is obtained. It is then a simple matter to multiply these numbers by 8–the number of bits in a byte–then divide the results by 300–the number of seconds in five minutes–to get the bits per second bandwidth utilization figures. Those figures are typically stored in some sort of database and used to plot graphs of utilization over time.
A few other SNMP values can be of interest in network monitoring. For example, there are interface input and output error counters. Similar to what’s being done with bytes in and out, these values can be used to compute the number of errors per second, a figure that tells you a lot about the general health of a network link. Other interesting metrics include CPU and memory utilization gauges.
The Top SNMP Monitoring Tools For Linux
1. ManageEngine OpManager
The ManageEngine OpManager is a powerful all-in-one network monitoring tool which offers comprehensive network monitoring capabilities that help you keep an eye on network performance, detect network faults in real-time, troubleshoot errors, and prevent downtime. The tool supports various environments from multiple vendors and can scale to fit your network, regardless of its size. It will let you monitor your devices and network and gain complete visibility and control over your entire network infrastructure. Installation and setup of this product are both quick and easy. You can get it running in under two minutes. It requires no complex installation procedures and comes bundled with databases and web servers.
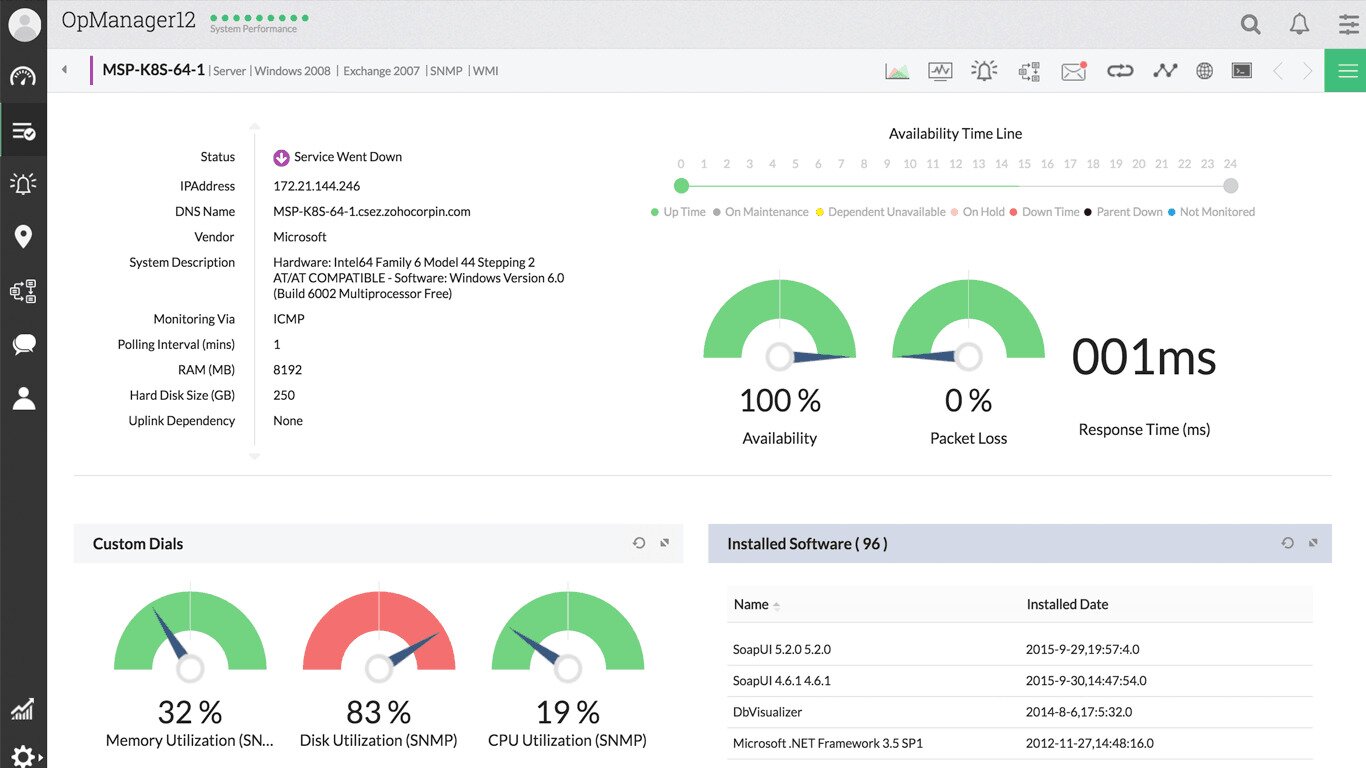
The ManageEngine OpManager constantly monitors network devices’ performance in real-time via live dashboards and graphs. It examines several critical operational metrics such as packet loss, errors and discards, etc. It will also monitor performance metrics like availability, CPU, disk space, and memory utilization across both physical and virtual servers.
The tool can help you detect, identify, and troubleshoot network issues with threshold-based alerts. You can easily set multiple thresholds for every performance metric and get notifications. While alerting is important, reporting is just as much and it is another area where this tool shines. Intelligent reports will let you get detailed insights on network performance. There are more than 100 built-in reports. You can customize, schedule and export these out-of-the-box reports as needed.
ManageEngine claims its OpManager can be installed in less than two minutes. Once installed, the tool will discover your devices and start monitoring them without requiring any complex configuration steps. The system boasts a very intuitive graphical user interface where you’ll easily find the information you need. Reports-wise, this tool has a full complement of excellent pre-built ones and you can also create custom reports to better suit your needs. Alerting in this product is excellent and at par with what you’ll find in competing products.
The ManageEngine OpManager is available in the Essential edition which is better sized for small and medium businesses with up to a thousand devices at prices starting just over $700 for 25 devices. For larger organizations, there’s an Enterprise edition which can scale up to ten thousand devices. Its price starts at under $20k for 500 devices. Prices for either edition vary according to the number of monitored devices and a free 30-day trial is available.
2. Observium
Observium is another excellent monitoring platform with auto-discovery. It supports a broad range of device types, platforms and operating systems including, products from vendors such as Cisco, Windows, Linux, HP, Juniper, Dell, FreeBSD, Brocade, Netscaler, NetApp. You probably can’t find a network device that’s not supported. The product’s main goal is to provide a beautiful, intuitive, and simple yet powerful user interface showing the health and status of your network.
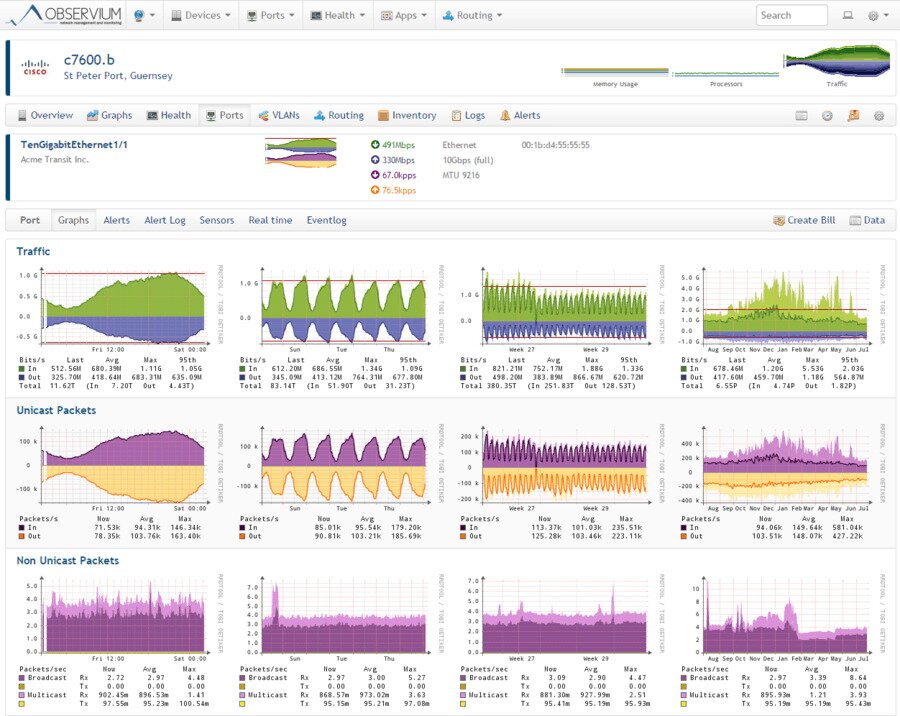
Observium offers far more than just bandwidth monitoring. There is, for instance, an accounting system that will measure total monthly bandwidth usage in the 95th percentile or in total transferred bytes. It also has an alerting function with user-defined thresholds. Furthermore, Observium integrates with other systems and can pull their information and display it within its interface.
A great characteristic of Observium is how easy it is to set up and how it almost configures itself. Although there doesn’t appear to be a download section on the website, there are detailed installation instructions for several Linux distributions that do include the links to get the right package for each distribution. The instructions are very detailed and installing the software should be easy.
The product is available in two versions. There’s the Observium Community is which available for free to everyone. This version receives updates and new features twice a year. There’s also the Observium Professional which has additional features and comes with daily updates. Both versions only run on Linux.
3. LibreNMS
LibreNMS is an open-source port of Observium and as such, it is a very interesting network monitoring platform. It is a fully-featured network monitoring system that provides a wealth of features and device support. Among its best features is its auto-discovery engine. It doesn’t only rely on SNMP to discover devices. It can automatically discover your entire network using CDP, FDP, LLDP, OSPF, BGP, SNMP and ARP. Talking about the tool’s automation features, it also has automatic updates so it will always stay current.
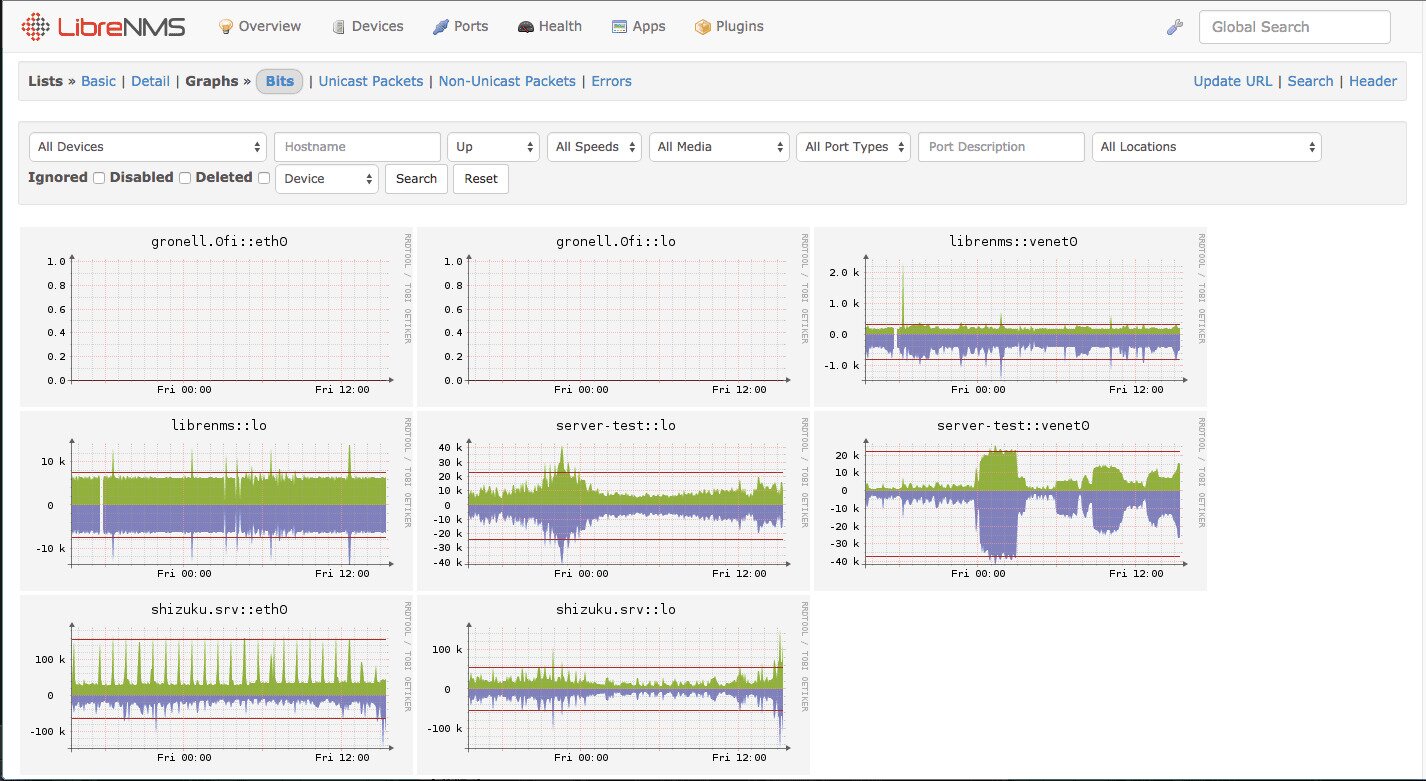
Another major feature of the product is its highly customizable alerting module. It is very flexible and it can sed alert notifications using multiple technologies such as email, like most of its competitors but also IRC, slack, and more. If you’re a service provider or your organization bills back each department for their use of the network, you’ll appreciate the tool’s billing feature. It can generate bandwidth bills for segments of a network based on usage or transfer.
For larger networks and for distributed organizations, the distributed polling features of LibreNMS allow for horizontal scaling to grow with your network. A full API is also included, allowing one to manage, graph, and retrieve data from their installation. Finally, mobile apps for iPhone and Android are available, a rather unique feature with open-source tools.
4. Zenoss Core
Zenoss Core may not be as popular as some of the other monitoring tools on this list but it truly deserves to be here because of its feature set and professional look. The tool can monitor many things such as bandwidth utilization, traffic flows, or services like HTTP and FTP. It has a clean and simple user interface and its alerting system is excellent. One thing worth mentioning is its rather unique multiple alerting system. It allows a second person to be alerted if the first one does not respond within a predefined delay.
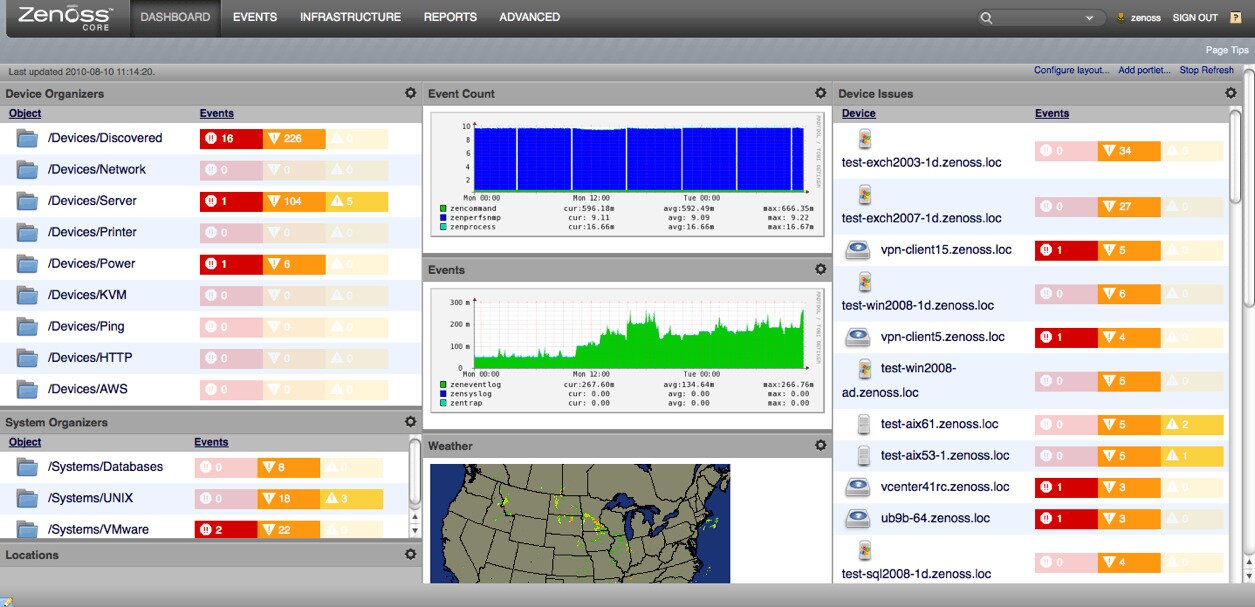
Nothing is perfect, though Zenoss Core is one of the most complicated monitoring systems to install and set up. Installation is an entirely command-line driven process. Today’s network administrators are used to GUI installers, configuration wizards and auto-discovery engines. This could make the product’s installation seem a bit archaic. Then again, this is in line with the Linux world. There is ample installation and configuration documentation available and the end result makes it worth the efforts.
5. Icinga
Icinga is yet another open-source monitoring platform. It has a simple and clean user interface and, more importantly, a feature set that rivals some commercial products. Like most bandwidth monitoring systems, this one uses SNMP to gather bandwidth utilization data from network devices. But one of the areas where Icinga particularly stands out is its use of plugins. There are thousands of community-developed plugins that can perform various monitoring tasks, thereby extending the product’s functionality. And in the unlikely event that you couldn’t find the right plugin for your needs, you can write one yourself and contribute it to the community.
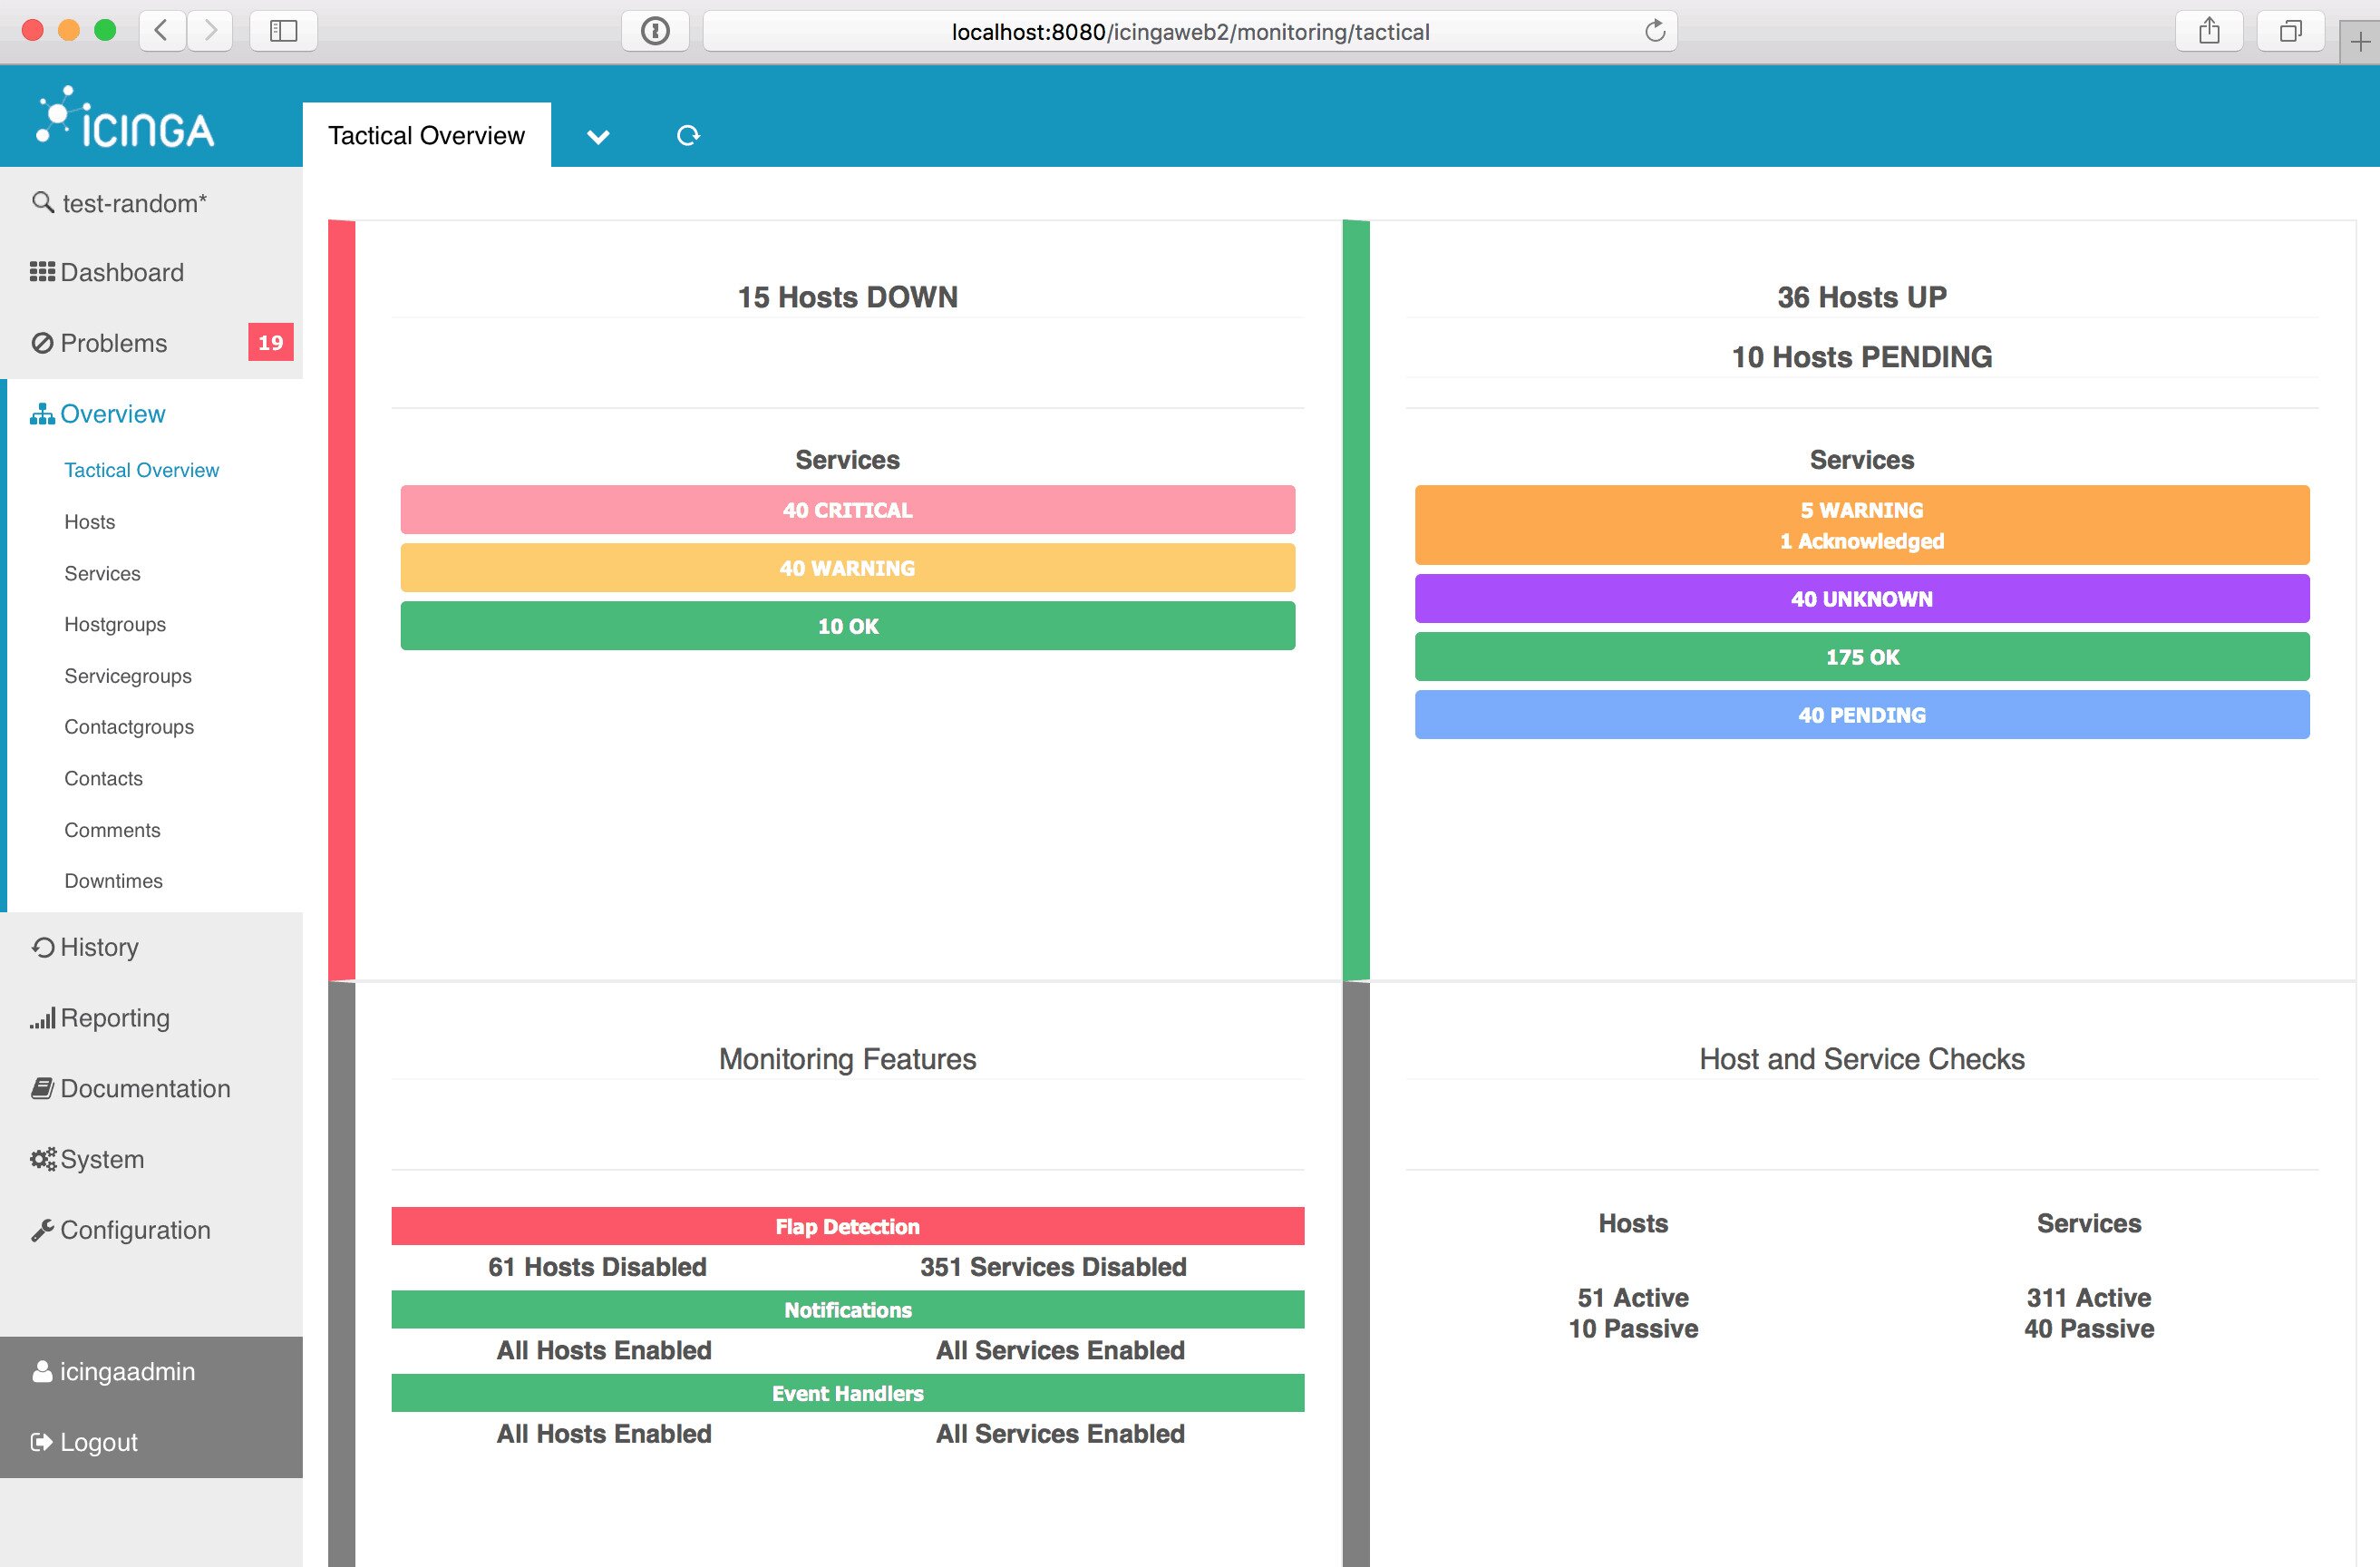
Alerting and notification also among Icinga’s great features. Alerts are fully configurable in terms of what triggers them and how they are transmitted. The tool also features what is referred to as segmented alerting. This feature will let one send some alerts to one group of users and other alerts to different people. This is nice to have when you monitor different systems managed by different teams. It can ensure that alerts are transmitted only to the proper group to address them
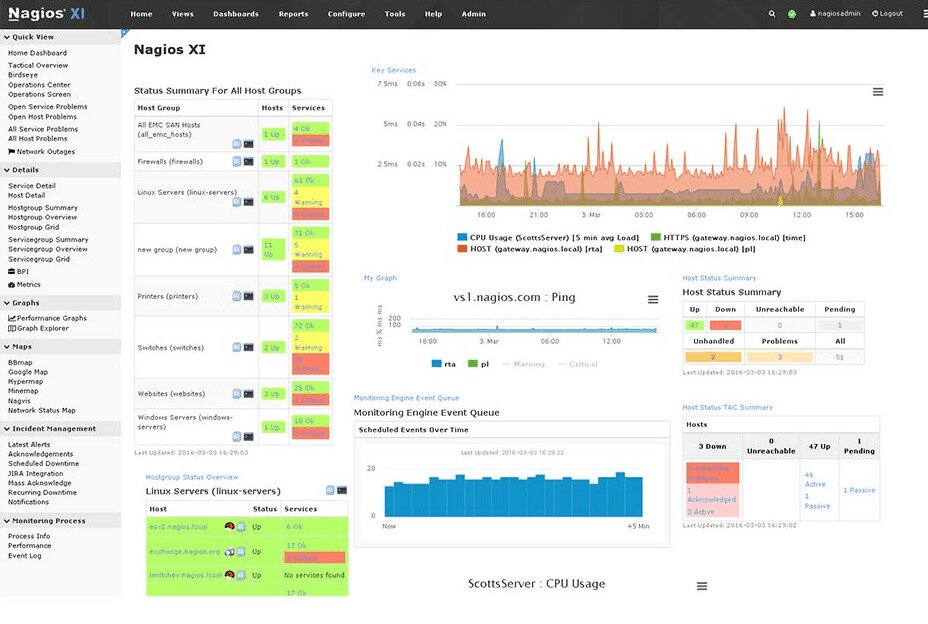
6. Nagios
There are two versions of Nagios available. There’s the free and open-source Nagios Core and there’s the paid Nagios XI. Both share the same underlying engine but and both run under Linux the similarity stops there. Nagios Core is an open-source monitoring system that runs on Linux. The system is completely modular with the actual monitoring engine at its core. The engine is complemented by dozens of available plugins which can be downloaded to add functionality to the system. Each plugin adds some features to the core.
Preserving the modular approach, the tool’s front-ends is also modular and several different community-developed options are also available for download. The Nagios Core, the plugins and the front end combine and make for a rather complete monitoring system. There is a drawback to this modularity, though: Setting up the product can turn out to be quite a challenging task.
Nagios XI, on the other hand, is a commercial product based on the same Nagios Core engine but it is a complete self-contained monitoring solution. The product targets a wide audience from small businesses to large corporations. It is much easier to install and configure than its open-source counterpart, thanks to its configuration wizard and auto-discovery engine. Of course, this ease of setup and configuration comes at a price; literally. You can expect to pay around $2 000 for a 100-node license and about ten times as much for an unlimited one.
7. Zabbix
Zabbix is another free and open-source product but it has has a highly professional look and feel, much like you’d expect from a commercial product. But the good looks of its user interface are not its only assets. The product also has an impressive feature set. It will monitor most network-attached devices in addition to networking equipment. It would be an excellent choice for anyone in need of monitoring servers in addition to network bandwidth utilization.
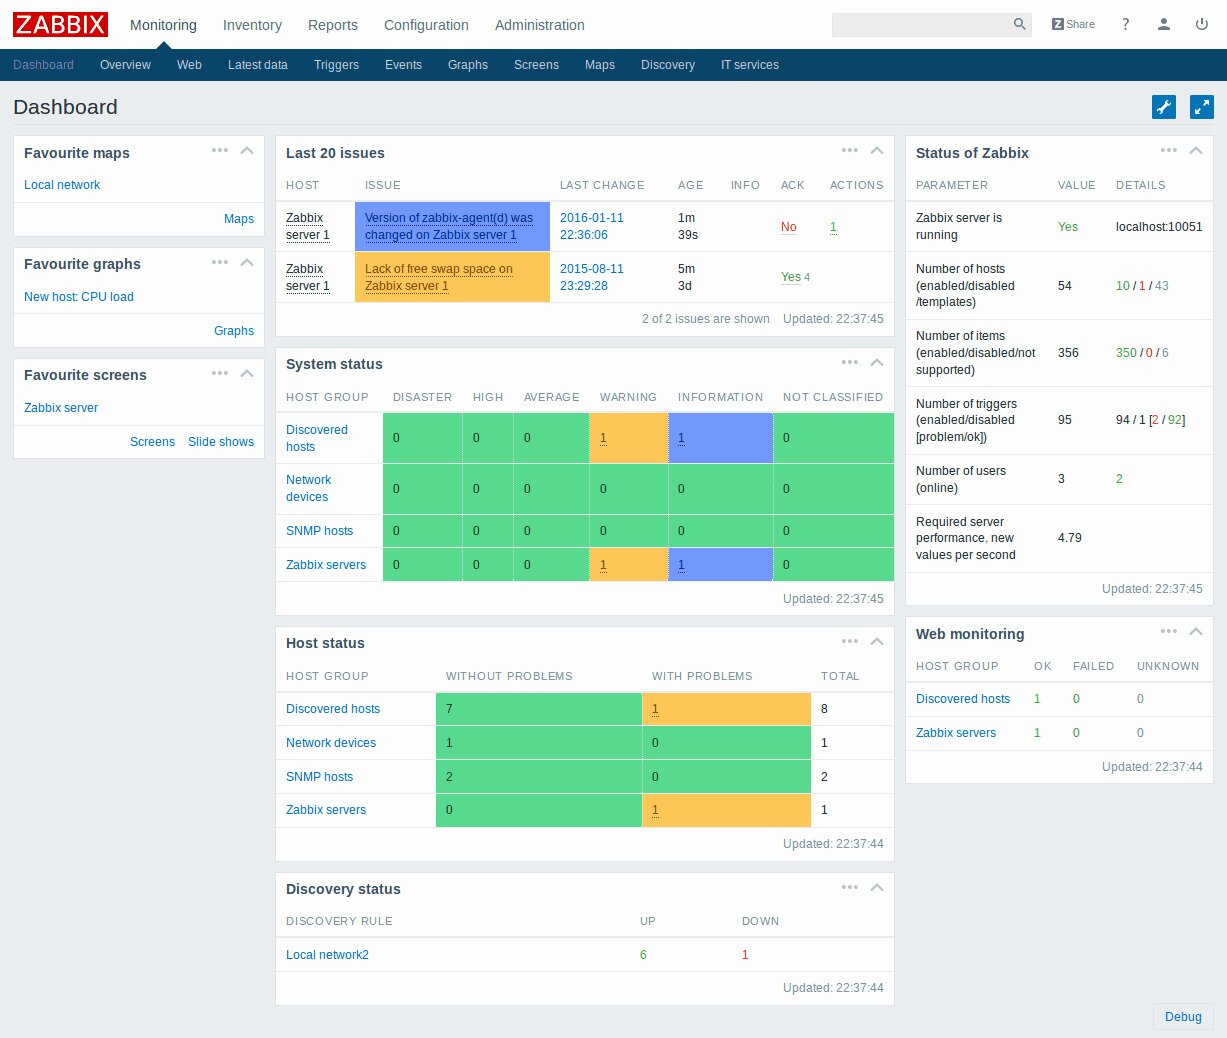
Zabbix uses SNMP as well as the Intelligent Platform Monitoring Interface (IMPI) for monitoring devices. You can use the software to monitor bandwidth, device CPU and memory utilization, general device health and performance as well as configuration changes, a rather unique feature within this list. This tool does way more than simple network bandwidth utilization monitoring. It also features an impressive and completely customizable alerting system which will not only send email or SMS alerts but also run local scripts which could be used to fix some issues automatically.