

16 Best Network Monitoring Software Tools and Solutions Put to Test
Network administrators, akin to mechanics or carpenters, require specific tools to perform their duties effectively. This necessity is amplified as networks continue to expand and corporations increasingly depend on them for daily operations. In today’s digital age, not only network outages but even slowdowns can have significant impacts on corporate operations. Therefore, network administrators must employ the right tools, such as SolarWinds Network Performance Monitor, SolarWinds Real-Time Bandwidth Monitor and ManageEngine SNMP Bandwidth Monitoring Software, to monitor networks and troubleshoot any issues that arise.
Other tools like the Multi Router Traffic Grapher (MRTG) and Cacti are also essential for network administrators. The Paessler Router Traffic Grapher (PRTG) and SolarWinds NetFlow Traffic Analyzer are also invaluable tools for monitoring network traffic and identifying potential issues. Wireshark is another tool that network administrators can use for network troubleshooting and analysis.
Fortunately, there is an abundance of these tools available, perhaps even an overwhelming amount. Hence, we are about to introduce you to our top 15 network monitoring tools and software, which include the aforementioned ones, to help you navigate this vast landscape.

We’ll start our discussion by talking about the need for network monitoring solutions and the different types of tools that are available. We’ll see how bandwidth utilization monitors, network analysis systems, and packet sniffers work and how they can be used to our benefit. Next, we’ll reveal our top 5 tools in each of the three categories. Some are free and/or open-source tools, others are commercial packages.
The Need For Network Monitoring Software Tools and Solutions
Network traffic is very similar to road traffic. Just like network circuits can be thought of as highways, data transported on networks are like vehicles traveling on that highway. But as opposed to vehicular traffic where you just have to look to see if and what is wrong, seeing what’s going on on a network can be tricky. For starters, everything is happening very fast and data transported on a network is invisible to the naked eye.
Network monitoring tools let you “see” exactly what is going on on your network. With them, you’ll be able to measure each circuit’s utilization, analyze who and what is consuming bandwidth, and drill down deep into network “conversations” to verify that everything is operating normally.
Different Types Of Monitoring Tools
There are basically three major types of network monitoring tools and software. Each one goes a little deeper than the previous and provides more details about the traffic. First, there are bandwidth utilization monitors. These tools will tell you how much data is transported on your network but that’s about it.
For more information, you need another type of tool, network analyzers. Those are tools that can give you some information on what exactly is going on. They won’t just tell you how much traffic is passing by. They can also tell you what type of traffic and between what hosts it is moving.
And for the most detail, you have packet sniffers. They do an in-depth analysis by capturing and decoding traffic. The information they provide will let you see exactly what’s going on and pinpoint issues with the greatest accuracy.
Bandwidth Utilization Monitors
Most bandwidth utilization monitors rely on the Simple Network Management Protocol or SNMP to poll devices and get the amount of traffic on all–or some–of their interface. Using that data, they will often build graphs that depict the bandwidth utilization over time. Typically, they’ll allow one to zoom into a narrower period where graph resolution is high and shows, for instance, 1-minute average traffic or zoom out to a longer time — often up to a month or even a year–where it shows daily or weekly averages.
SNMP in a Nutshell
The Simple Network Management Protocol–or SNMP–can be used to remotely monitor and configure networking equipment. Despite its name, it’s not exactly simple, though, and implementing it can prove to be a daunting task. SNMP-enabled devices make a certain number of parameters–called OIDs–available. Some are modifiable configuration parameters, allowing one to change them while others are read-only counters.
When it comes to bandwidth monitoring, we’re specifically interested in two OIDs. They are called bytes in and bytes out. By reading these values at precisely timed intervals, The number of bytes per unit of time–which is exactly what bandwidth is–can be computed. Most networking devices, like switches and routers, have one such set of OIDs for each of their interfaces.
Typically, a network bandwidth utilization monitoring system will poll each device at 5 minutes intervals. It will then subtract the previous value of the counter from the current one to get the number of bytes transferred in five minutes. It will multiply that number by 8 to get the number of bits. And finally, it will divide it by 300 to get the bandwidth in bits per second.
In addition to the bits in and bits out counters, some bandwidth monitoring system will allow one to monitor other parameters. For instance, there are interface input errors and interface output errors OIDs that can be polled to compute the error rate.
Network Analysis Systems
If you need to know more than the amount of traffic passing by, you need a more advanced monitoring system. What you need is what we refer to as a network analysis system. These systems rely on software that’s built into networking equipment to send them detailed usage data. These systems can typically display top talkers and listeners, usage by source or destination address, usage by protocol or by application and several other useful information about what is going on.
While some systems use software agents that you must install on target systems, most of them rely instead on standard protocols such as NetFlow, IPFIX, or sFlow. These are usually built into equipment and ready to use as soon as they are configured.
Flow Analysis 101
Originally created as a way of simplifying the creation of access control lists, NetFlow was developed by Cisco Systems. Engineers quickly realized that the collected data could be put to a different use by exporting it to a device that can analyze that information.
NetFlow uses a three-component architecture. The exporter which runs on the monitored device aggregates packets into flows and exports flow records to a flow collector. The flow collector handles the reception, storage and pre-processing of the flow data. Finally, the flow analyzer is used to analyze received flow data. Many systems combine the collector and analyzer in one device.
Once exclusive to Cisco devices NetFlow is now commonly found on equipment from other manufacturers. It can go by other names such as Jflow on Juniper equipment. The latest version was even made as an IETF standard called IPFIX. There is also a competing system called sFlow from inMon which is also present on several brands of networking equipment. And although NetFlow and sFlow are considerably different in the way they operate, many monitoring systems can handle both protocols.
How About Packet Sniffers?
If you need even more information about the traffic on your network, packet sniffers offer as much detail as can possibly be gathered. They work by capturing each and every packet and decoding it. They’ll allow you to see every detail of a specific conversation. They can be very helpful to pinpoint the exact source of a network issue.
For example, let’s say that users have been complaining that this application is much slower than usual. Since networks are often plagued with congestion, the user’s first reflex will be to blame the network. You use bandwidth monitors or network analyzers and find no trace of congestion anywhere. That’s when you get your packet sniffer and by examining traffic, you see that for each request the client sends to the server, the response only comes back 10 seconds later. Now, to rule out any networking issue, you repeat the test by capturing traffic at the server’s network interface and see the same behavior. This confirms that it is the server that is slow to respond and that there is nothing wrong with the network.
Our Top 5 Bandwidth Monitoring Tools
Because they are the most basic network monitoring tools and software and they should be the first one you deploy, let’s start with a quick review of our top five bandwidth monitoring tools. Some are free and/or open-source while others are paid software. They all use SNMP to periodically poll your network devices–and more, as you’ll see–and create bandwidth utilization graphs, giving you some visibility on your network’s usage.
-
SolarWinds Network Performance Monitor (FREE TRIAL)
SolarWinds Network Performance Monitor, often referred to as NPM, stands as SolarWinds’ flagship offering in the realm of SNMP bandwidth monitoring tools. The richness of features packed within this tool is nothing short of impressive, and deserving of an in-depth review. One of the standout attributes of NPM is its remarkable simplicity, which we emphasize not as a lack of capabilities, but rather as user-friendliness. With customizable dashboards, views, and charts, this tool can be tailored to your exact needs. Setting it up is a breeze, and you can commence monitoring within a matter of minutes. What’s more, NPM scales effortlessly to accommodate networks of almost any size.
SolarWinds Network Performance Monitor operates by periodically polling your network equipment to retrieve interface counters. It then calculates bandwidth utilization and presents this data through informative graphs that track its evolution over time. Configuring the tool is a straightforward process, requiring you to specify the device’s IP address and select the parameter you wish to monitor. Beyond its basic functionalities, NPM boasts advanced features such as the ability to construct network maps and reveal the critical path between two devices—an invaluable asset for diagnosing slowdowns.
In terms of pricing, the Network Performance Monitor is not only powerful but also cost-effective, with starting prices around $1,785. For those who prefer a test run before making a commitment, a 30-day trial is readily available, allowing you to experience the product’s capabilities firsthand.
2. SolarWinds Real-Time Bandwidth Monitor — (FREE DOWNLOAD)
SolarWinds is well-known in the networking field for its tools and free utilities. One of its best free tools is the SolarWinds real-time bandwidth monitor. The software runs on Windows and uses SNMP to poll network devices and get traffic statistics from their interfaces. The results are shown visually on graphs plotting bandwidth usage against time.

This free tool is somewhat limited, though. It can only be configured to poll one device at a time and it will only keep and show data from the past 60 minutes. It’s barely enough for the smallest of troubleshooting tasks. It’s also a great introduction to SolarWinds’ other tools. The SolarWinds Network Performance Monitor which, for example, is available for purchase provides a comprehensive bandwidth monitoring solution that can scale up to networks of any size
The SolarWinds real-time bandwidth monitor is distributed as a bundle along with the SolarWinds network analyzer, another great free tool that you can use to monitor NetFlow-enabled devices. That tool will let you drill down by conversation, application, endpoints or protocol which the real-time bandwidth monitor won’t.
3. ManageEngine SNMP Bandwidth Monitoring Software
ManageEngine is also famous for its free tools. On we particularly like is the SNMP Bandwidth Monitoring Software. It is part of the ManageEngine’s free OpUtils bundle. The huge bundle also includes 15 other network management utilities. This network monitoring software can run on Windows or Linux. The free edition is somewhat limited and will let you up to 10 devices and their interfaces. If you’re managing a smaller network, it might be all you need.
The system features an automatic discovery process which will scan your network for SNMP-enabled devices to monitor. You can then view your device’s interface statuses from the inventory tab. The tool also has graphs of bandwidth usage and reports showing past day to past month usage. There’s even an alerting system to notify you of abnormal traffic patterns.
There is also a paid version with no device limitation that you may want to try. ManageEngine offers a free 30-day evaluation version of its full OpsUtil software. Actually, the free version starts as a 30-day trial of the unlimited version that reverts to limited features after the trial period ends.
4. MRTG
The Multi Router Traffic Grapher, or MRTG, is kind of the granddaddy of all network bandwidth monitoring systems. It is an open-source project that’s been around since 1995. it is still in widespread usage, despite the fact that the latest version is already some five years old. It is available for Linux and Windows. Initial setup and configuration are somewhat more complicated than what you’d experience with other monitoring systems but excellent documentation is readily available.
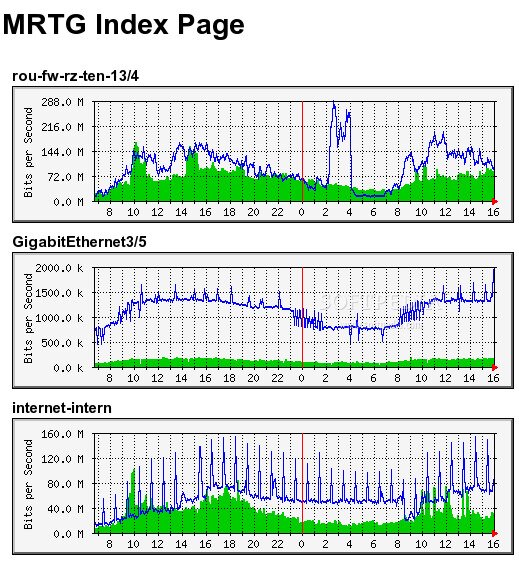
Installing MRTG is a multi-step process and you need to carefully follow the setup instructions. Once installed, you configure the software by editing its configuration file. MRTG can be downloaded directly from the developer’s website. This network monitoring tool and solution is available as a .zip file for Windows or a tarball for Linux. As of this writing, the latest stable release is 2.17.4.
What MRTG lacks in user-friendliness, it gains in flexibility. Mostly written in Perl it can easily be modified and adapted to one’s exact needs. And the fact that it’s the first monitoring system and that it is still around is a testament to its value.
5. Cacti
You may think of Cacti as MRTG on steroids. Flexible and versatile like its distant cousin, it is a more polished product and boasts a web-based user interface that makes configuring it very simple and intuitive. Cacti features a fast poller, advanced graph templates, several acquisition methods, and user management. It can scale up to networks of virtually any size, including multiple sites.
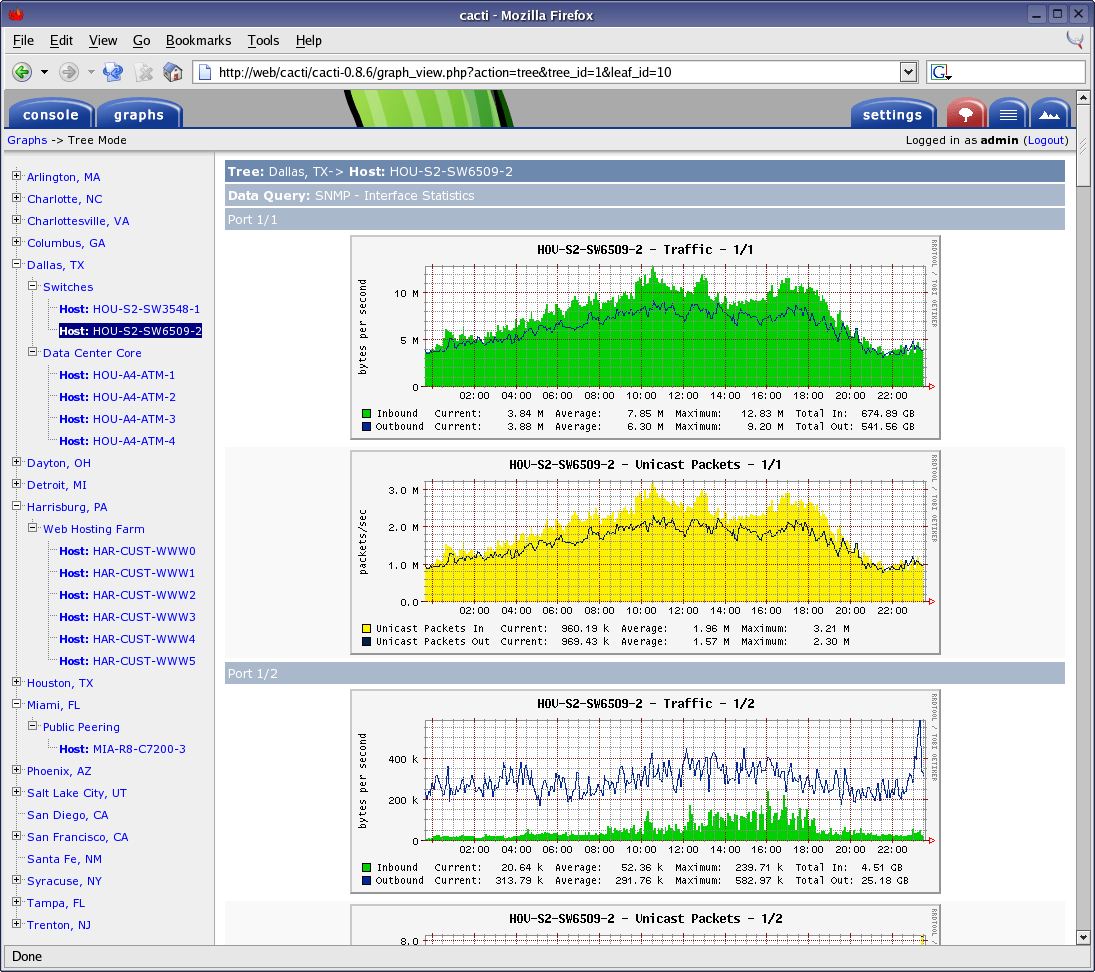
Cacti is a frontend to RRDTool, an open-source, high-performance data logging and graphing system for time series data. RRDTool is a direct descendant of MRTG. Cacti stores the data to create and populate graphs in a MySQL database and it is entirely written in PHP.
Configuring Cati is easy. For example, adding a device requires you to enter its IP address or hostname and SNMP community. Then, this network monitoring software will discover the device’s interface and let you select which one(s) you want to grate usage graphs for.
Visit the Cacti website for more information about this product or to download it. It is completely free for any usage.
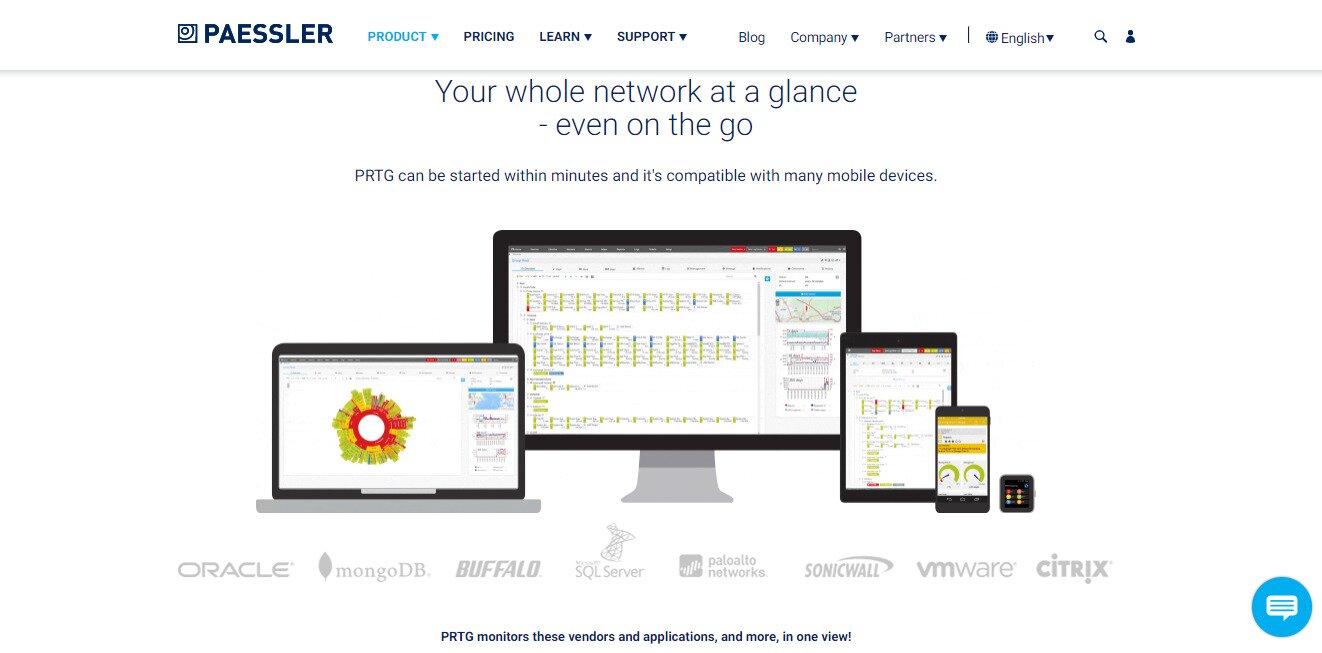
6. PRTG
The Paessler Router Traffic Grapher or PRTG is yet another great product. The monitoring solution is somewhat similar to Cacti or MRTG with a more polish and professional feel to it. According to Paessler, you can set up PRTG in a couple of minutes.
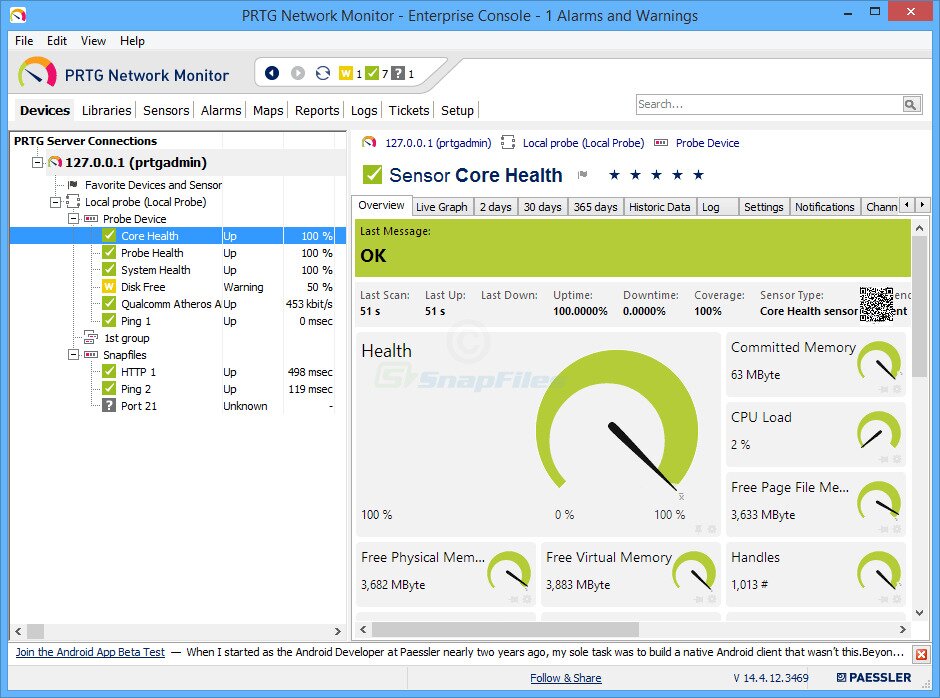
PRTG is a feature-rich product. As a user interfaces, you can choose between a native Windows enterprise console, an Ajax-based web interface as well as mobile apps for Android and iOS. PRTG allows you to print QR code labels that you can affix to your monitored devices. Scanning these codes from the mobile app will quickly take you to the device’s graphs.
PRTG can monitor devices using SNMP, WMI, NetFlow, and Sflow. It also has tons of reports that can be viewed as HTML or PDF or exported to CSV or XML to be processed externally.
You can download either the free version of the free 30-day trial version. The former will limit you to monitoring up to 100 sensors, a sensor being each parameter that you want to monitor. For example, monitoring bandwidth on each port of a 48-port switch will require 48 sensors. And if you also want to monitor the switch’s CPU and memory loads, you’ll need two more sensors.
Our Top 5 Flow Analysis Tools
While bandwidth monitoring systems will show you how much your network is used, it still leaves you in the dark as to how it is used. For that kind of visibility, you need to deploy the next level of monitoring systems, flow analysis tools. These tools use NetFlow and its variants or sFlow to gather detailed information about what traffic is being transported on your network. Just like we did with bandwidth monitoring tools, here are our top five flow analysis tools.
1- SolarWinds NetFlow Traffic Analyzer (30-day free trial)
It seems like SolarWinds has a great solution to every network administration need and flow analysis is one of them. The SolarWinds NetFlow Traffic analyzer has a free 30-day trial so you can see for yourself if this product is for you.

The SolarWinds NetFlow Traffic Analyzer can monitor network usage by application, protocol, and IP address group. It can not only monitor NetFlow devices but also J-Flow, sFlow, NetStream, and IPFIX. The tool collects flow data, arranges it into a usable and meaningful format and present it to users in a web-based interface. It can be used to identify which applications and categories consume the most bandwidth.
SolarWinds is also known for its free tools and there is a feature-limited free product called the SolarWinds Real-Time Netflow Analyzer. It only supports NetFlow and doesn’t have many of the advanced features of the full product but, if all your network devices support NetFlow, it might be enough for your needs.
2- PRTG Network Monitor
We’ve introduced PRTG in the previous section about bandwidth monitoring system but PRTG is also an excellent flow collector and analyzer. In fact, PRTG is a wide integrated solution that can monitor every aspect of your network. And if you’re only interested in flow monitoring, the free version might be all you need. The free version of PRTG lets you monitor up to 100 sensors. And each flow data source counts as one sensor. Concretely, this means that the free version can monitor flows from up to 100 devices. This is sufficient for many networks.
Installing PRTG is easy and there is an auto-discovery process that can help with the initial configuration. Sensors such as NetFlow collectors can also be added manually. There’s even a detailed video that will show you how it’s done. The server runs on Windows only but the user interface is web-based and can be accessed from any browser. There’s also a mobile app for iOS or Android that you can install on your smartphone or tablet.
3- Scrutinizer
Scrutinizer from Plixer is more than just a flow analysis system. It has the ability to monitor different flow types such as NetFlow, J-flow, NetStream, and IPFIX so you’re not limited to monitoring only Cisco devices. Scrutinizer offers efficient data collection and can easily scale up to many million flows per second. It works in both physical and virtual environments and comes with advanced reporting features.
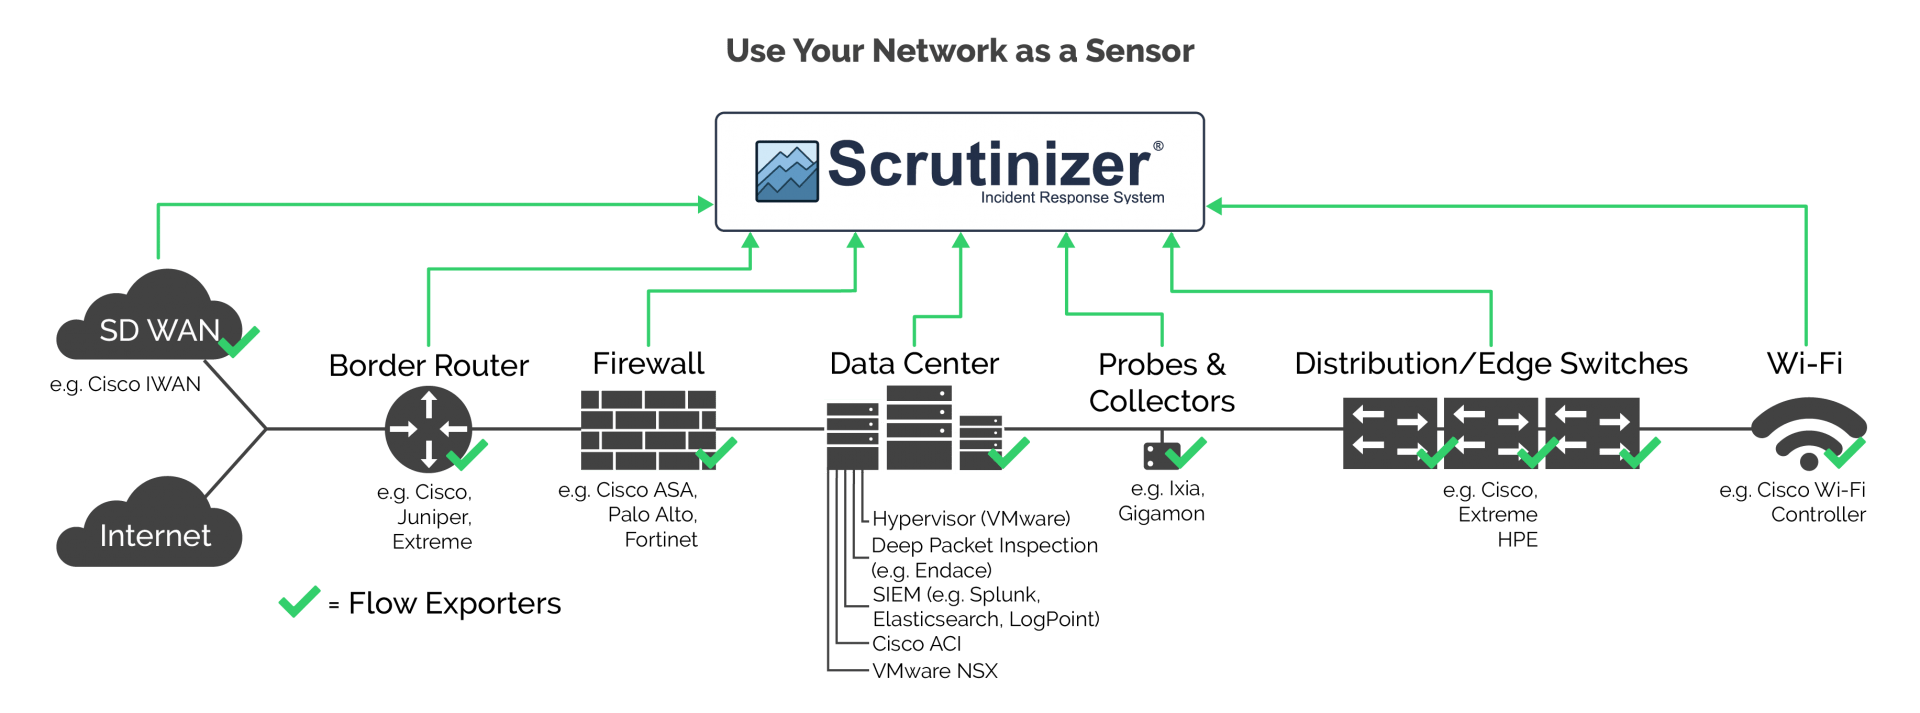
Scrutinizer is available in many versions from the basic free version to the full-fledged “SCR” level which can scale up to over 10 million flows per second. The free version is limited to 10 thousand flows per second and it will only keep raw flow data for 5 hours but it should be more than enough to troubleshoot network issues. A free 30-day trial is available for all the paid versions. And after the trial period is over, it will revert back to the free version.
4- ManageEngine NetFlow Analyzer
The ManageEngine NetFlow Analyzer has a web-based interface that offers an impressive number of different views on your network. You can view traffic by application, by conversation, by protocol, and several more options. You can also set alerts like, for example, set a traffic threshold on a specific interface and be alerted whenever traffic exceeds it.
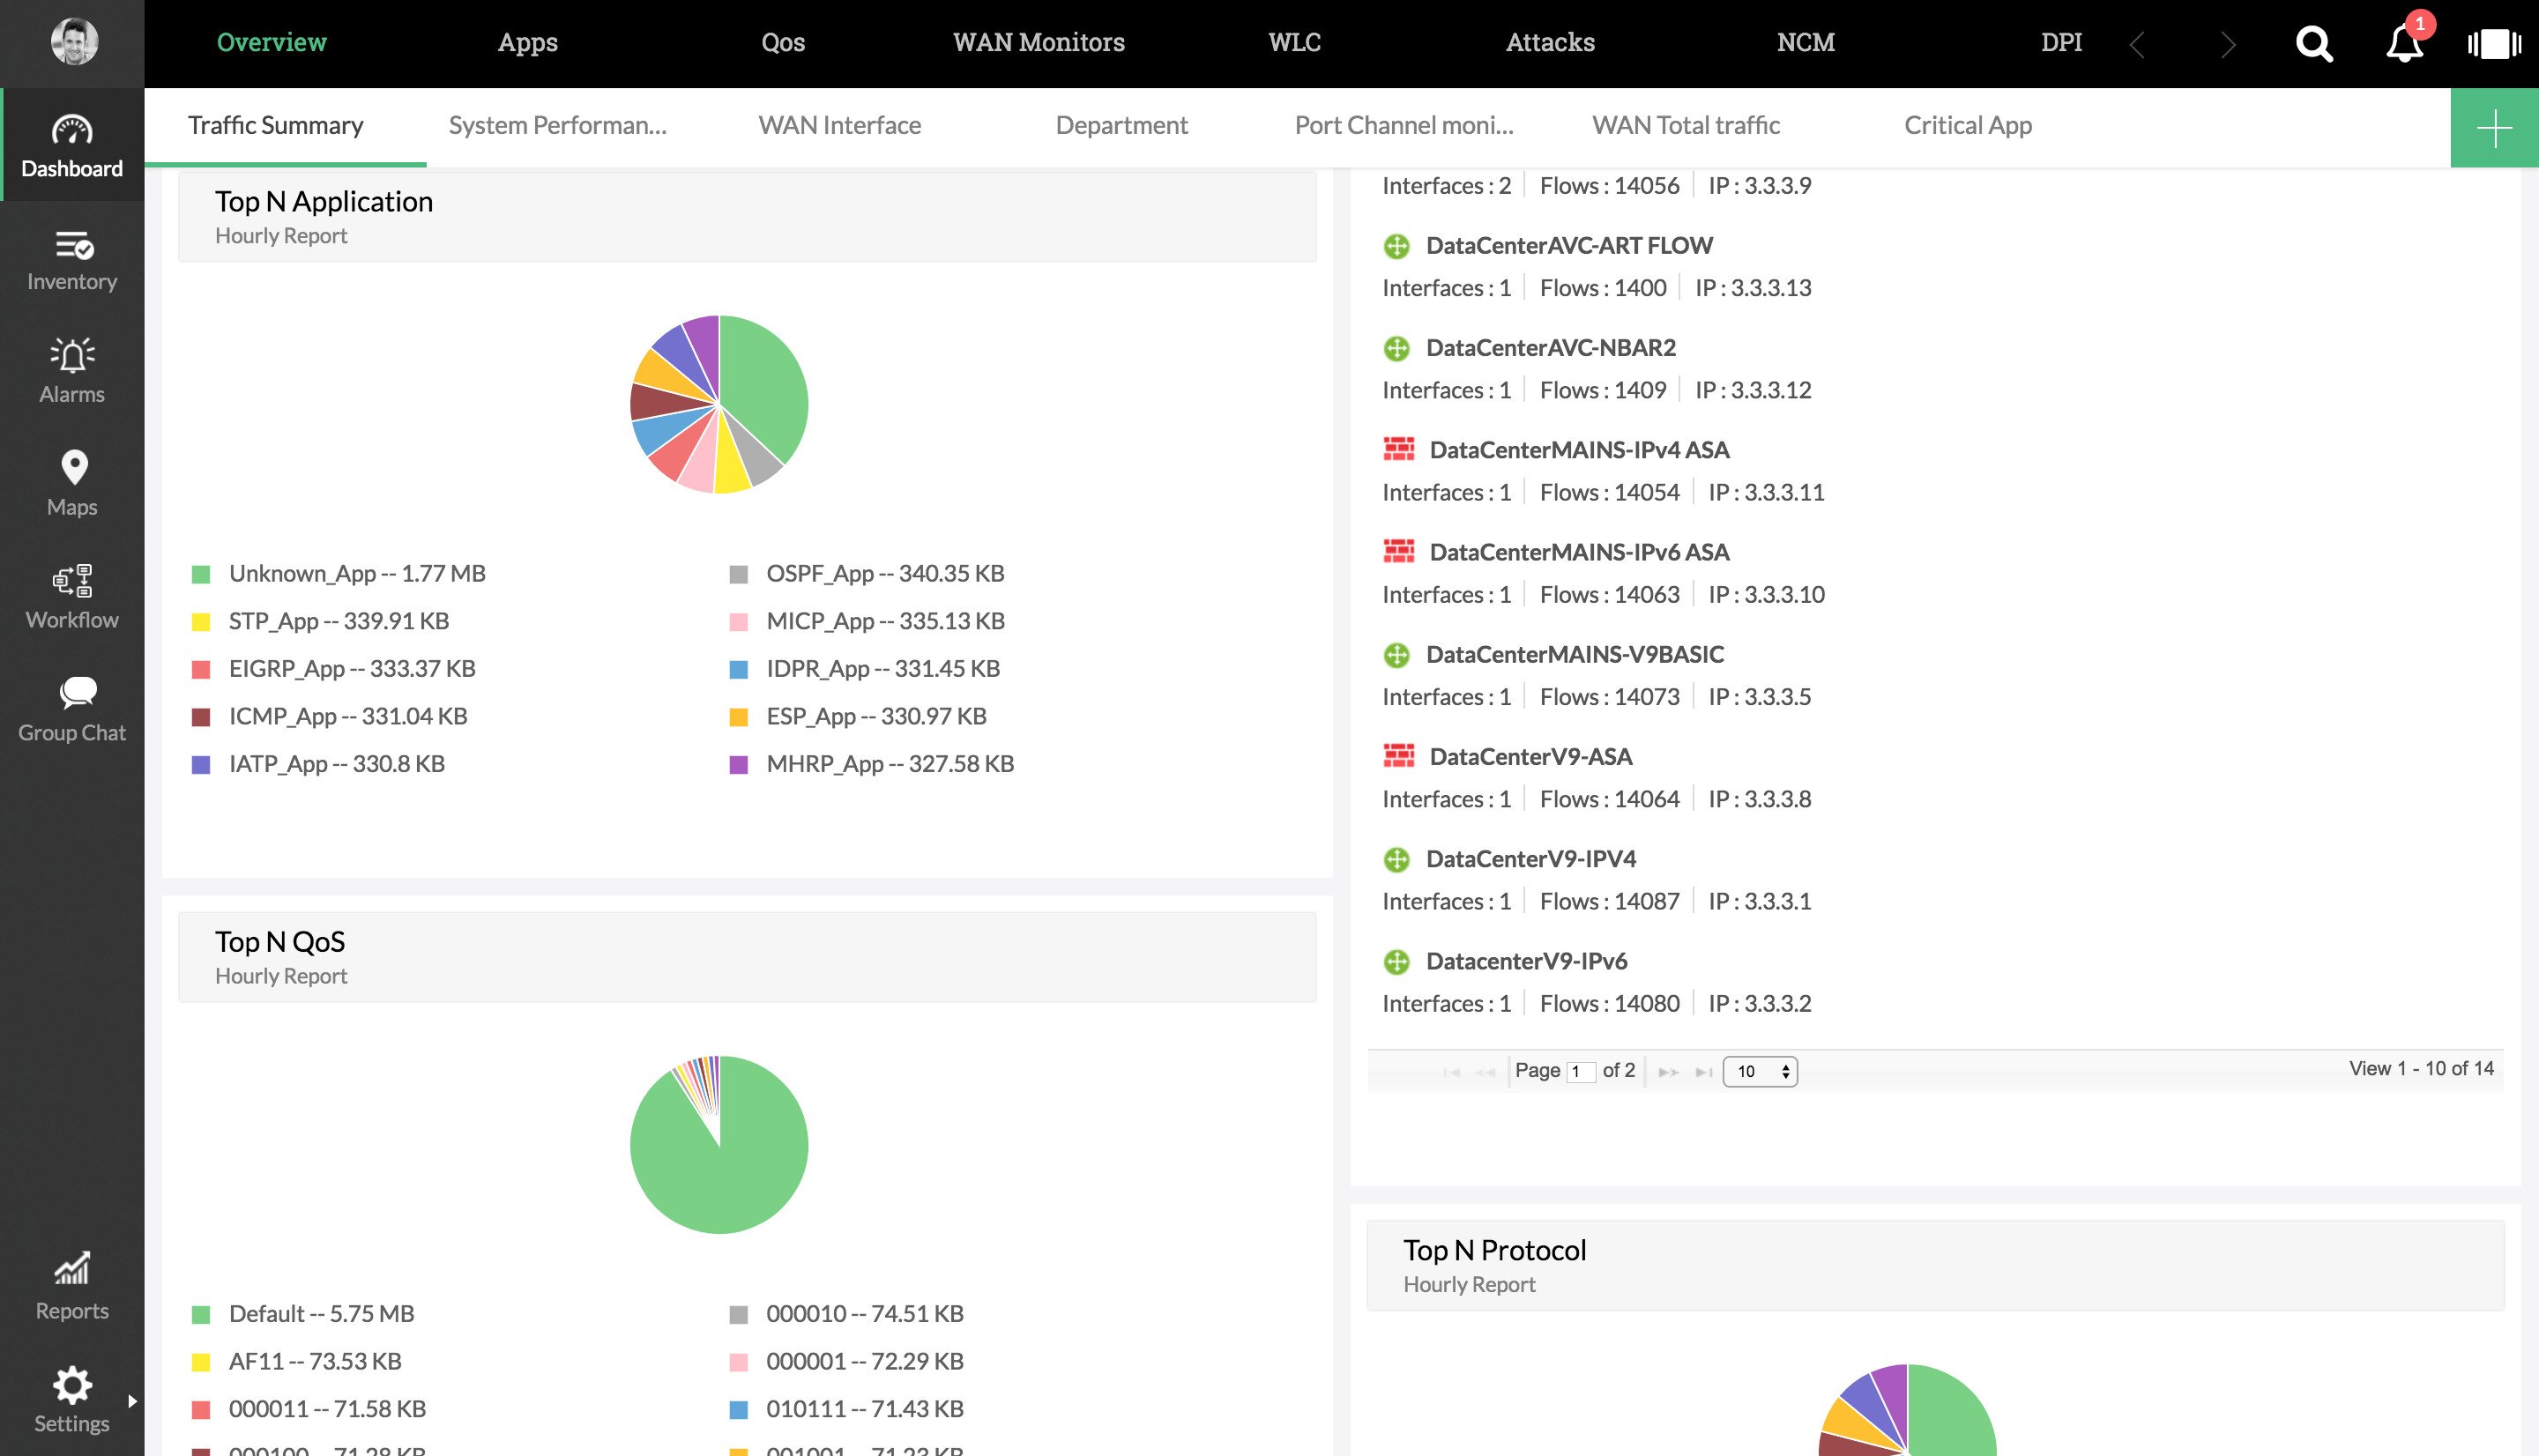
The tool’s dashboard includes several pie charts showing top applications, top protocols or top conversations. It can also display a “heat map” with the status of the monitored interfaces. Dashboards and reports can be customized to include only the information you find useful. Furthermore, the dashboard is where alerts are displayed in the form of pop-ups. There’s also a smartphone app that will let you access the dashboard and reports from anywhere.
The ManageEngine NetFlow Analyzer supports most flow technologies including NetFlow, IPFIX, J-flow, NetStream and a few others. The product is available in two versions. The free version will be identical to the paid one for the first 30 days but it will then revert to monitoring only two sources interface or flows. For the paid version, licenses are available in several sizes from 100 to 2500 interfaces or flows.
5- nProbe and ntopng
nProbe and ntopng are two open-source tools. Ntopng is a web-based traffic analysis tool for monitoring networks based on flow data while nProbe is a NetFlow and IPFIX exporter and collector. Together, they make for a very flexible analysis package. If you’re familiar with the Unix command ntop, ntopng is the next-generation GUI version of this ageless tool.
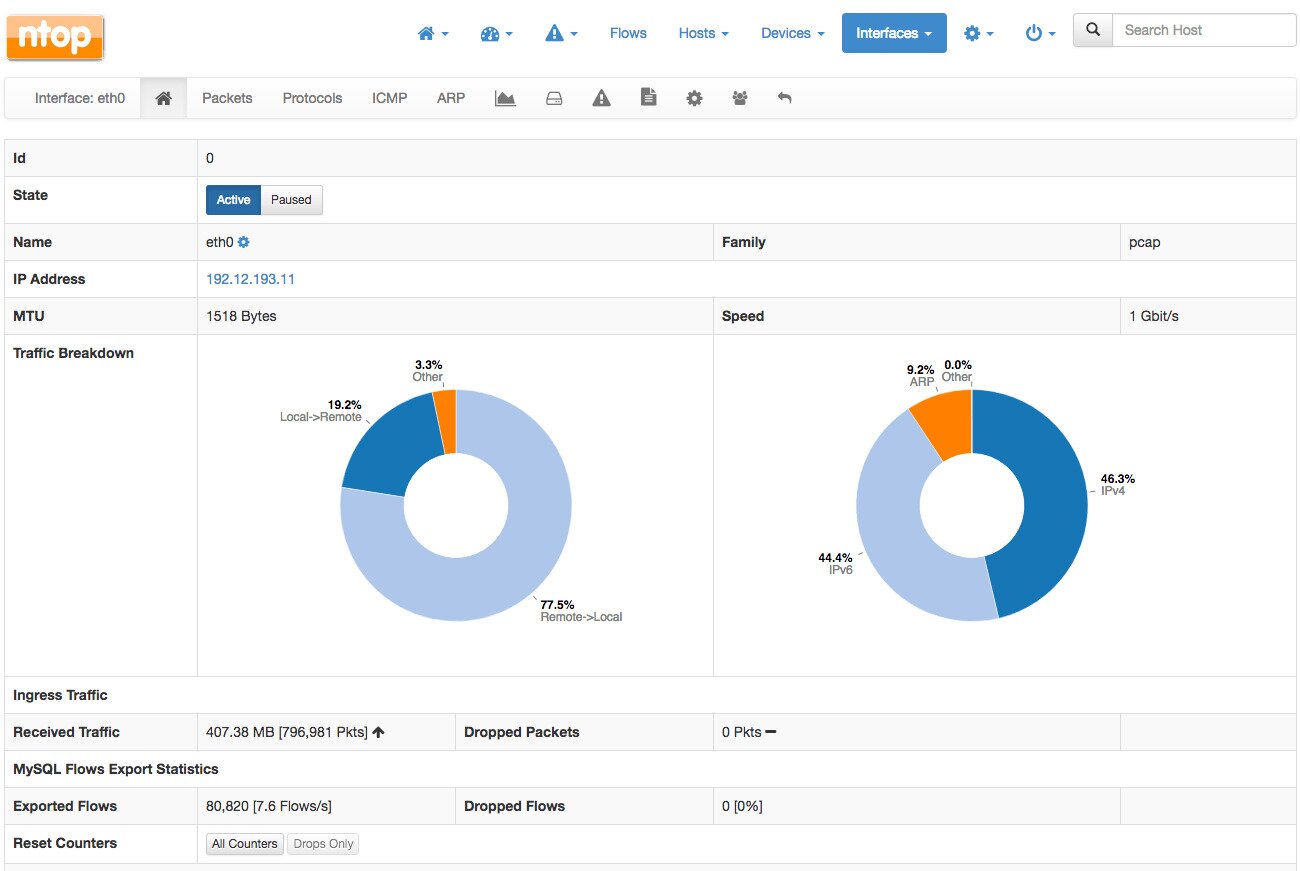
There’s a free community version of ntopng but you can also purchase the enterprise version. And while it can be expensive, it’s free to educational and non-profit organizations. As for nProbe, you can try it for free but it is limited to a total of 25 000 exported flows. Once you reach that–which can be sooner than you think–you’ll need to purchase a license.
ntopng boasts a web-based user interface which can present data in different ways such as top talkers, flows, hosts, devices, and interfaces. There are charts, tables, and graphs. many featuring drill-down options. The interface is very flexible and allows for a lot of customization.
Our Top 5 Packet Sniffers
For the most details on what’s happening on your network, packet sniffers are what you need. They work by capturing all data at a specific point on your network and will let you decode each packet and follow the details of each “conversation”. The placement of a packet sniffer is in itself a complicated matter as it will have a direct incidence into what you can see. Entire books have been written about that. Typically, a packet sniffer will be set up to capture a server’s traffic by mirroring that server’s switch port to a free port on the same device where the sniffer will be connected. Taps also exist that can be inserted between two devices and capture all traffic going by. Let’s briefly discuss what the best five packet sniffers are.
1. Wireshark
Wireshark has been around for ages. It started in the last century. And today, it is still “the world’s foremost and widely-used network protocol analyzer”. It is the de facto standard for many enterprises, government agencies, and educational institutions.
Among the product’s main features you’ll find the possibility to do live capture and offline analysis. Wireshark also supports the deep inspection of hundreds of protocols, with more being added all the time. It also has the most powerful display filters in the industry. The product will run on Windows, Linux, macOS, Solaris, FreeBSD, NetBSD, and many others.
2. Tcpdump
Tcpdump is a well-known Unix command-line utility that is built into most Unix-like systems, including most Linux distribution. Although it is quite hard to use and even harder to master, it possibly offers the best functionality and flexibility of any packet sniffer. There’s a port of tcpdump for Windows called WinDump. It is somewhat easier to use
Tcpdump won’t do packet decode like Wireshark. It will only display packets on screen as they are captured. Due to the impressive quantity of data that is transported on a network, filters are commonly used so that only the data we need to see is listed on screen. In fact, tcpdump’s filtering abilities are probably its biggest asset and why the command is still widely used today.
3. EtherApe
EtherApe is another open-source project, like Wireshark and tcpdump. However, it uses a more graphical representation of traffic and can most efficiently be used to pinpoint the source of heavy traffic causing network congestion. Actually, EtherApe is not really a packet sniffer in that it won’t decode packets or even let you capture them in a table.
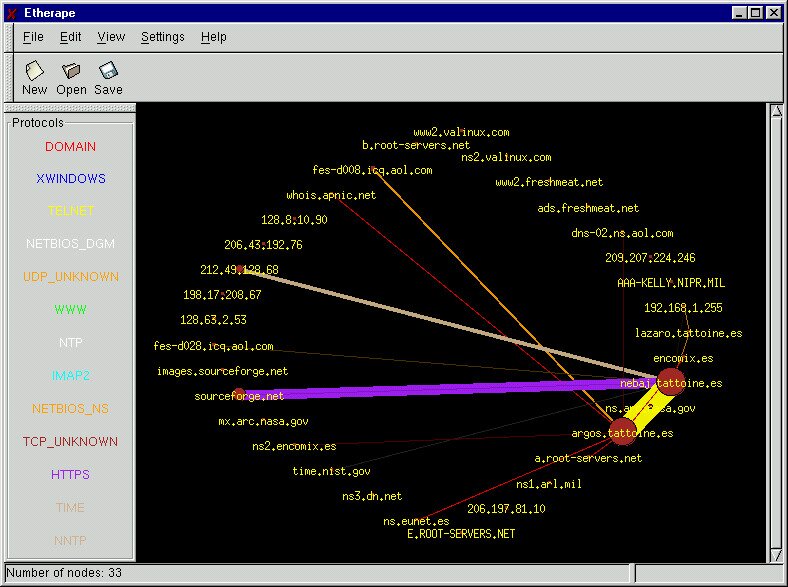
Instead, EtherApe has a more graphic approach. It will depict your network as a circle with each host at its border. Within the circle, there’s a line between any two hosts communicating. The lines are color-coded by type of traffic and their thickness shows the amount of traffic. It is a very different tool to learn and use but still, it provides a different way of viewing traffic which has proven to be useful more than once.
4. Kismet
Most products in this category are open-source and Kismet is no different in that regard. But Kismet is quite different in that it specializes in wireless networks. It, for example, can sniff and analyze the traffic of hidden networks or un-broadcasted SSIDs. When you simply don’t know what causing issues and you simply can’t find it, Kismet can probably sniff it out. In fact, Kismet is particularly well-suited for wireless networks
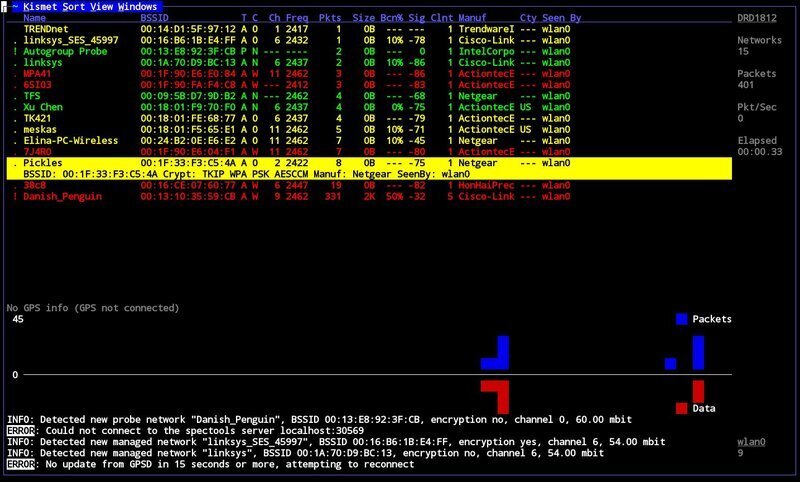
This network monitoring tool and software will mostly run on Unix-like operating systems which includes Linux and all flavors of BSD and osX. It can even run on Windows under Cygwin but this is well beyond the scope of this article. If you need to monitor wireless networks, get yourself a Mac or a Linux machine and install Kismet.
5. SolarWinds Network Performance Monitor (30-DAY TRIAL)
Although SolarWinds does not have a stand-alone packet sniffer. There is some sniffing and analyzing functionality built right into its Network Performance Monitor. The module will let you determine if a trouble is caused by the application or the network. It can calculate application and network response times, helping to troubleshoot performance issues. It can also identify over a thousand applications and let you see what traffic is on your network. Finally, you’ll be able to spot abnormal traffic to prevent potential security threats.

Pricing for SolarWinds’ Network Performance Monitor starts just shy of $1,785. Fortunately, a fully functional 30-day trial is available for free. You’ll be able to see for yourself if the tool is for you.
Wrapping Up
We’ve just presented our 15 best network monitoring software tools and solutions. You don’t need all of them but sooner or later, you’ll likely need one in each category. All of these tools are great and work very well. They are all different from one another and while we may prefer one, your experience could lead you to another.
Overall, SolarWinds Network Performance Monitor, and SolarWinds Netflow Traffic Analyzer have the edge over the other solutions and are the best network monitoring tools and software available. But since all of these tools are either free or have a free evaluation version available, what’s stopping you from trying them all and decide for yourself which one best matches your needs?