

5 Best Tools for Traffic Pattern Analysis and How it Helps your Business
Traffic pattern analysis is a process that lets network administrators and managers get an excellent depiction of not only how much a network is utilized but, more importantly, HOW it is utilized. It’s one thing to know that a given network segment suffers from congestion but it’s a different — and much more useful — one to learn what is causing that congestion. And without that information, the only option for fixing the congestion is to throw more bandwidth at it. But bandwidth is expensive and there are certainly better ways to address this type of issue. Traffic pattern analysis may hold the answer and today, we’re reviewing the top tools you can use.

We’ll begin our journey into traffic pattern analysis with some useful theory. We’ll first have a closer look at what traffic pattern analysis is. This is important as it is what will help define what constitutes a traffic pattern analysis tool. We will then discuss NetFlow and other flow-reporting systems and protocols as they are at the core of most traffic pattern analysis tools. We’ll first have a look at Cisco’s NetFlow protocol and its multiple variants before we have a look at S-Flow, a competing protocol that is somewhat different in how it operates. Armed with all this information, we’ll be ready to review the top traffic pattern analysis tools we could find.
Traffic Pattern Analysis In A Nutshell
In its simplest expression, network traffic pattern analysis is the process of recording, reviewing and/or analyzing network traffic for the purpose of performance, security and/or general network operations and management. More specifically, it is the process of using manual and automated techniques to review granular-level details and statistics within network traffic.
There are primarily two types of network traffic monitoring. The first is bandwidth utilization monitoring which can provide quantitative data. This type of monitoring will let you see how much traffic is going by at a specific point on a network but it won’t provide any data on the nature of this traffic. The second type of monitoring, the one that we’re discussing today and which is referred to as network traffic pattern analysis or just network traffic analysis, goes deeper and its primary objective is to offer in-depth insight into what type of traffic, network packets or data is flowing through a network.
Although network traffic pattern analysis can be done manually, it is most often done by means of a network monitoring tool. Doing it manually would simply require too many efforts. The traffic statistics obtained from network traffic analysis can help with understanding and evaluating the network utilization. It will reveal important data on the type, size, origin, and destination of data packets. It can even include some information on the content of data packets.
Network security teams can use network traffic pattern analysis to identify malicious or suspicious packets within the traffic. Likewise, network administrations seeking to monitor download and upload speeds, throughput, content, etc. Will use it to better understand network usage.
On the downside, network traffic pattern analysis can also be used by attackers and/or intruders to analyze network traffic patterns and identify vulnerabilities or means to break in or retrieve sensitive data. This is a double-edged sword.
NetFlow And Other Flow-Reporting Systems
NetFlow is a feature that was introduced on Cisco routers back in 1996—give or take a year or two—which offers the ability to collect IP network traffic as it enters or exits an interface. This is different from bandwidth monitoring where data is counted but not collected. By analyzing the collected data, one can determine things such as the source and destination of traffic, class, and type of service, and, ultimately use this information to identify the causes of congestion.
A typical NetFlow monitoring setup is made up of three main components:
- The flow exporter aggregates packets into flows and exports flow records towards one or more flow collectors. This is the component that resides within the networking device.
- The flow collector is responsible for the reception, storage and pre-processing of flow data received from a flow exporter.
- The flow analyzer analyzes the received flow data in the context of intrusion detection or traffic profiling, for example.
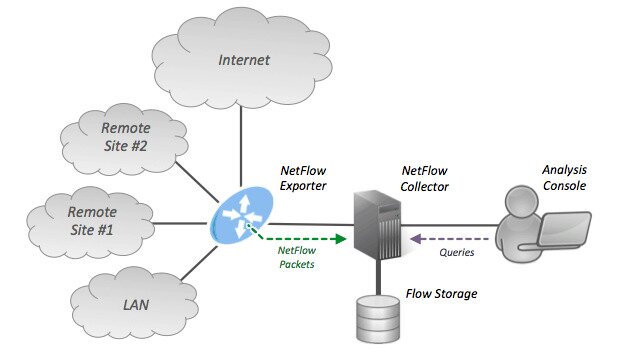
A flow, in NetFlow’s parlance, is a unidirectional sequence of packets that share a certain number of attributes such as their ingress interface, source and destination IP addresses, IP Protocol (TCP/UDP/ICMP, etc.), source and destination IP ports, and IP type of service. Detailed data about each individual flow is collected by the flow exporter before being exported to the flow collector. In most instance today, the flow collector and analyzer are two components of the same system and we rarely see them separated.
Once a Cisco-exclusive, NetFlow is now available on equipment from many vendors including Juniper, Alcatel-Lucent, and Nortel, just to name a few. Some vendors call it a different name such as J-flow for Juniper. There’s even a relatively recent IETF-standardized version called IPFIX which stands for Internet Protocol Flow Information eXport.
sFlow is a somewhat equivalent yet widely different technology. sFlow uses similar methods for collecting flow information but adds data sampling—hence the S—for even more detailed information. Very few NetFlow Analyzers and Collectors can handle sFlow data as the two are too different.
The Best Tools For Traffic Pattern Analysis
There are quite a few tools out there that offer network traffic pattern analysis. Most of them will collect NetFlow data and display it in some meaningful graphical way while some use different techniques to achieve similar goals.
1. SolarWinds NetFlow Traffic Analyzer (FREE TRIAL)
First on our list is the SolarWinds NetFlow Traffic Analyzer or NTA. If you don’t know SolarWinds, the company has carved itself a solid reputation for making some of the best network management tools. Its flagship product, the Network Performance Monitor is one of the best bandwidth monitoring tools available. And SolarWinds is also known for its great free tool addressing specific network administration needs such as one of the best subnet calculators or TFTP server.

As its name implies, the SolarWinds NetFlow Traffic Analyzer uses the NetFlow protocol to provide detailed information on what the observed traffic is. It can, for instance, report on what type of traffic is more frequent or what user is using the most bandwidth. Several different views are available on the tool’s dashboard such as top applications, top protocols or top talkers, for instance. The tool will support most NetFlow variants from different vendors
Here are some of the product’s best features.
- It can be used to can monitor network usage by application, protocol, and IP address group.
- It will monitor Cisco NetFlow, Juniper J-Flow, sFlow, Huawei NetStream, and IPFIX flow data to identify which applications and protocols are the top bandwidth consumers.
- It will collect traffic data, correlate it into a usable format, and present it on its web-based user interface
- It can help you identify which applications and categories consume the most bandwidth for better network traffic visibility and it has support for Cisco NBAR2.
The SolarWinds NetFlow Traffic Analyzer is available as an add-on to the Network Performance Monitor (NPM). Prices start at $1,915 for 100 nodes. The number of nodes you purchase must match your NPM license. If you don’t already own the NPM software, that will cost $2,995 for the same 100 nodes level. And if you want to try it before you buy it, you can download a fully functional 30-days evaluation version of either or both products,
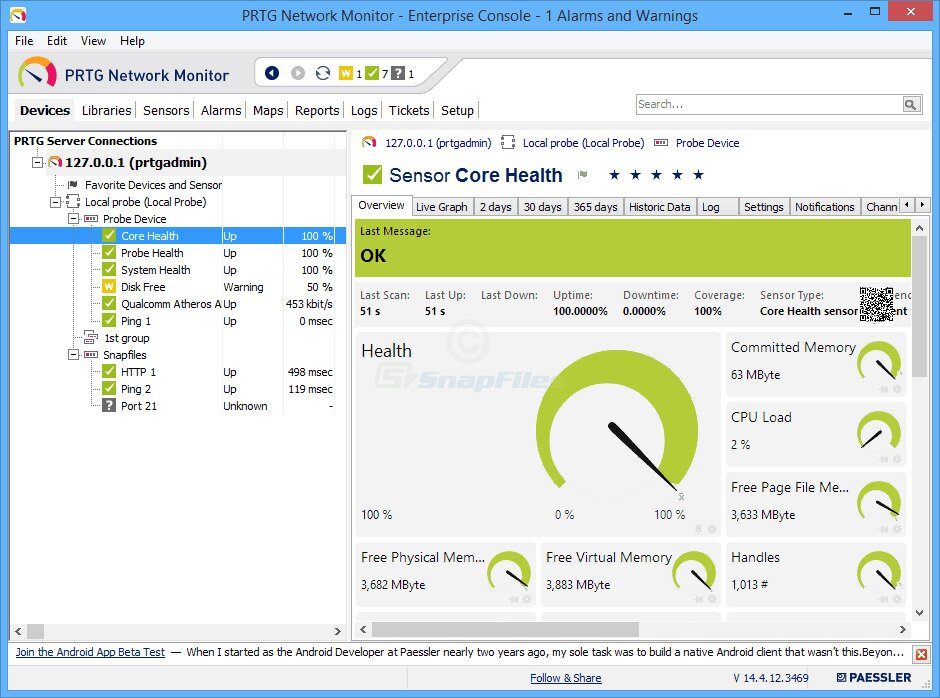
2. Paessler Router Traffic Grapher (PRTG)
The Paessler Router Traffic Grapher, or PRTG, is an all-in-one solution whose primary purpose is monitoring bandwidth utilization. As such it integrates SNMP bandwidth monitoring and NetFlow collection and analysis. But it doesn’t stop there and PRTG will use many different technologies to monitor systems, devices, traffic, and applications. Here’s a rundown of the supported monitoring protocols:
- Flows (like NetFlow or sFlow)
- SNMP with ready to use and custom options
- WMI and Windows Performance Counters
- SSH for Linux/Unix and MacOS systems
- Packet Sniffing
- Ping, SQL and many more
Installing PRTG is easy. In fact, Paessler claims you could be done within a couple of minutes. After running the installer, the auto-discovery process will discover devices and set up basic sensors. You can then add sensors–such as NetFlow collectors–manually. If you need it, there’s a detailed video that will show you how it’s done.
PRTG only runs on Windows but its user interface is web-based and can be accessed from any browser on any platform. There are also mobile apps for Android and iOS that you can install on your smartphone. Talking about the mobile apps, this tool has a unique feature in the form of QR code labels that you can print and affix on your devices. It is then a simple matter of scanning the code from the mobile apps to quickly view the device’s sensor data.
PRTG is available in two versions. There’s a free version that is limited to 100 sensors. Each and every monitored element counts as one sensor. For example, to monitor each port of a 48-port switch, you’ll need 48 sensors. For NetFlow collection and analysis, you’ll need one sensor per flow exporter. For more than 100 sensors, you need a paid license. They’re available for 500, 1000, 2500, 5000, and unlimited nodes at prices varying from around $1 600 to just under $15 000. Note that the free version will allow unlimited sensors for the first 30 days allowing you to thoroughly test-drive the product.
3. Scrutinizer
Scrutinizer from Plixer is an excellent NetFlow Analyzer. It’s actually much more than just that and it is considered by many to be a full-fledged incident response system. And with its ability to monitor different flow types such as NetFlow, J-flow, NetStream, and IPFIX, you’re not limited to monitoring only Cisco devices.
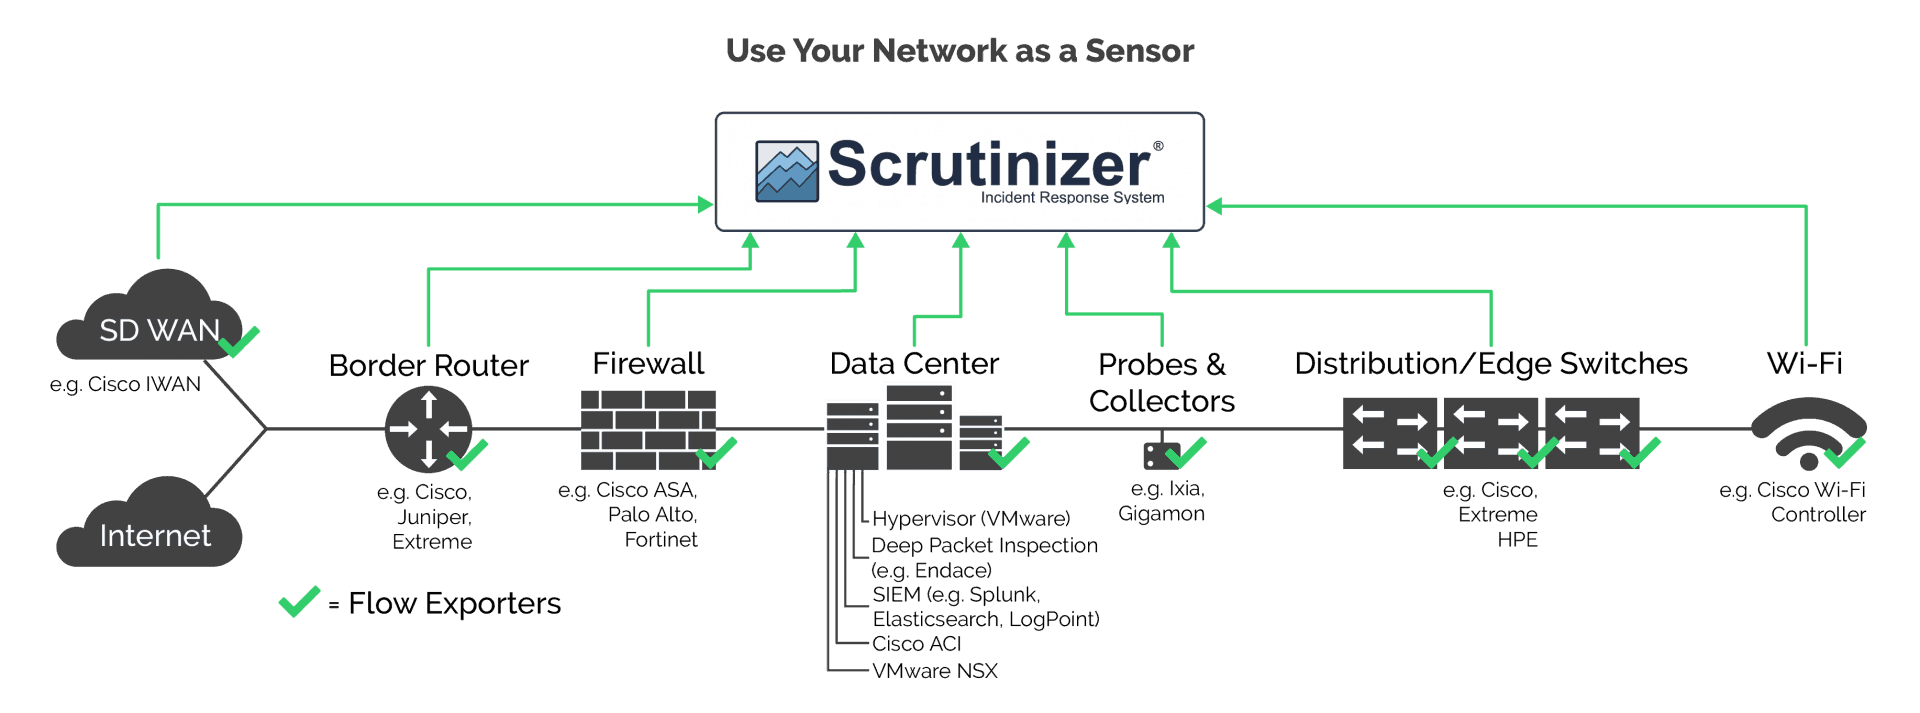
Scrutinizer features a hierarchical design and offers streamlined and efficient data collection which lets one start small and easily scale way up to millions of flows per second. Although the network is often first blamed whenever anything goes wrong, Scrutinizer will help you quickly find the real root cause of most network issues. The product can work in both physical and virtual environments and it comes with advanced reporting features.
Scrutinizer is available in four license tiers from the basic free version to the top-tier SCR level which can scale up to over ten million flows per second. The free version is limited to ten thousand flows per second and it will only keep raw flow data for 5 hours. In-between tiers are the MDX level which keeps data for 25 hours and the SSRV which keeps it forever. You can try any license tier for 30 days after which it will revert back to the free version.
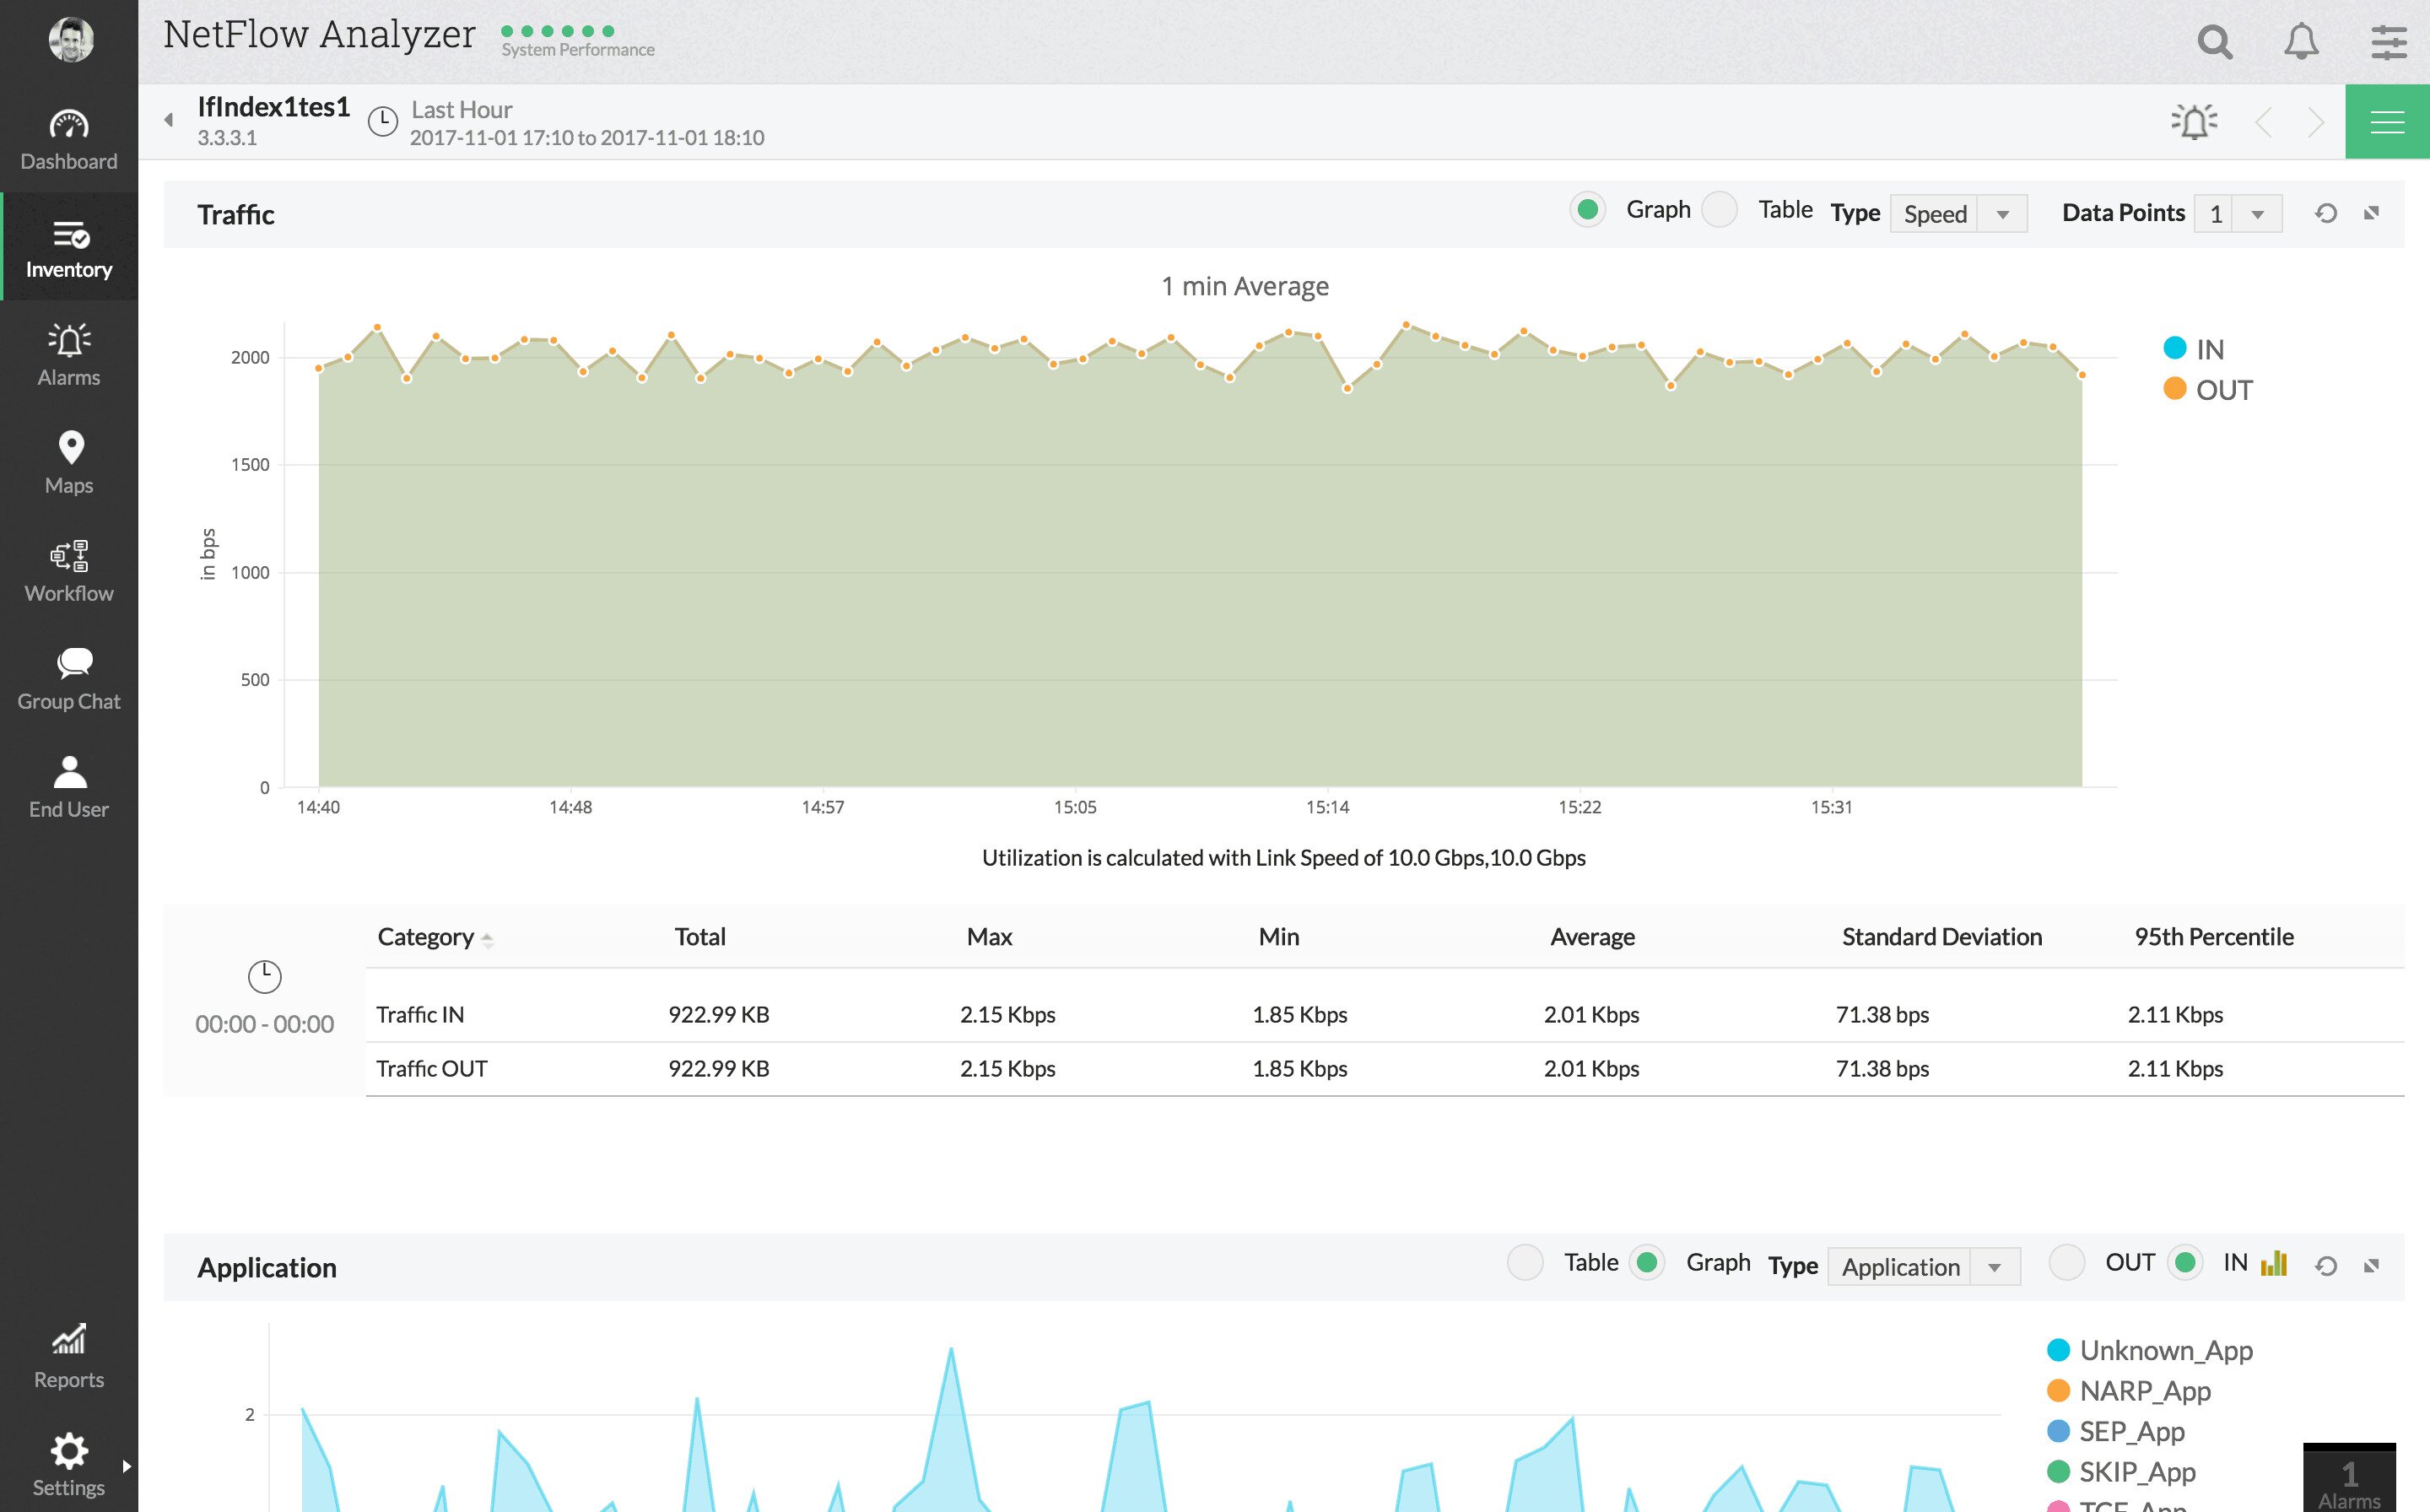
4. ManageEngine NetFlow Analyzer
ManageEngine is yet another household name in the network administration tools arena. Much like SolarWinds, the company makes a handful of excellent tools as well as several free ones. The ManageEngine NetFlow Analyzer provides a detailed view of a network’s bandwidth utilization as well as traffic patterns. The product boasts a web-based user interface which offers an impressive number of different views on your network.
This tool will let you, for instance, view traffic by application, by conversation, by protocol, and several more options. You can also set alerts to warn you of potential issues. You could, for instance, set a traffic threshold on a specific interface and be alerted whenever traffic exceeds it.
Most of the ManageEngine NetFlow Analyzer’s strength comes from its reports and dashboard. The product has several useful pre-built reports that are tailored for specific purposes such as troubleshooting, capacity planning or billing. But if you’d rather build customized reports, the tool lets administrators create them to their liking.
The ManageEngine NetFlow Analyzer’s dashboard is just as impressive as its reports. It includes several pie charts depicting top applications, top protocols or top conversations, for example. It can also display a heat map showing the status of the monitored interfaces. Dashboards can be customized to include only the information you need. For the on-the-go network administrators, there’s a smartphone app that will let you access the dashboard and reports.
The ManageEngine NetFlow Analyzer supports most flow technologies including NetFlow, IPFIX, J-flow, NetStream and a few others. As a bonus, the too has excellent integration with Cisco devices, with the possibility of adjusting traffic shaping and/or QoS policies right from the tool.
The ManageEngine NetFlow Analyzer comes in two versions. The free version limits you to monitoring only two interfaces or flow exporters. For greater capacity, licenses are available in several sizes from 100 to 2500 interfaces or flows at prices varying between about $600 to over $50K plus annual maintenance fees. A free 30-day trial is available on all paid plans.
5. sFlowTrend
While all the previous products are excellent, only PRTG, so far, supports the sFlow protocol. As we explained, the two protocols are quite different and it is rare for one tool to support both. So, if your network is primarily made of sFlow-enabled devices, here’s one of the best tools we could find.
sFlowTrend is an sFlow monitoring tool from inMon, the company behind the sFlow protocol. It is a basic and somewhat limited yet very capable tool. There’s a free version that will let you gather data from up to five sFlow-enabled devices and will only keep history data in RAM for up to an hour. While this could be enough to troubleshoot some networking issues, it’s not what you need for ongoing monitoring. For a more complete tool, you need to upgrade to the pro version which removes the number of devices limit and stores history data to disk.
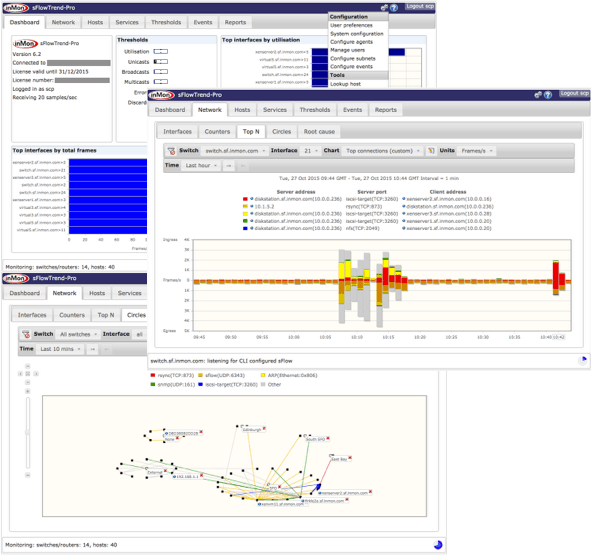
The sFlowTrend Dashboard offers a quick view of the current state of your monitored devices and networks. It will display top-level thresholds and interfaces with potential errors. Clicking on the sFLowTrend Network tab reveals summarized performance statistics and detailed traffic at the network or device level. Alerting thresholds can be used to receive alerts when higher-than-usual bandwidth usage is observed or network error happen. The software also features a Root cause tab where you can drill down on the cause of an issue such as a threshold violation.
The sFlowTrend Hosts tab is where you’ll find more detailed information about each device. It can display performance data on CPU, disk, and more, for sFlow-enabled servers. As you will have figured, sFlow is not just for monitoring network equipment. The Services tab is where you’ll find performance data for applications that export sFlow data. And on the Events tab, you’ll find a log of events such as exceeded thresholds or detected errors. Finally, the Reports tab offers several predefined reports and also supports the creation of custom reports.
sFlowTrend is written in Java and comes with both a Java-based or web-based user interface. It is available for Windows, Mac, and Linux. The software features an excellent online help system to assist you in configuring and using the tool.
In Conclusion
No matter which tool you choose, network traffic pattern analysis will give you an invaluable insight into what goes on on your network. Each of the tools we’ve reviewed provides excellent value and picking one will most likely be a matter of personal preference. There might be a specific feature in one of the tools that particularly appeals to you. With all the paid tools offering either a free trial or a free version, there’s no reason why you couldn’t try a few before making a decision.