

Best Tools for Troubleshooting Network Performance Issues
It seems like networks are never fast enough. Really, network performance is by far the single most complained-about issue when it comes to networked systems. There’s a reason for that, though. Network performance—or lack thereof—is probably the most perceptible issue from a user’s point of view. So, when tasked with troubleshooting network performance issues, network administrators needs to know what to look for, where to look for it, and they should have access to the right tools.
Today, we’re having an in-depth look at troubleshooting network performance issues.

We’ll start off, as we often do, with a mile-high view of what network performance is. Then, as we get closer, we’ll have a more detailed look at some of the factors that typically affect the performance of computer networks. We’ll first discuss bandwidth and throughput which, to a certain extent, are two sides of the same coin. Next, we’ll talk about latency and delay, two metrics that are often confused. We’ll do our best to shed some light on the subject.
Our next order of business will be jitter, one of the most performance-impacting aspects of networks. And last but not least, we’ll discuss errors which can sometimes be the consequence and sometimes the symptoms of other problems. And since having access to the proper tools is very important when troubleshooting network performance issues, we’ll have a look at a few of the best network monitoring tools that can help with your troubleshooting efforts.
About Network Performance
Wikipedia defines network performance in a very simplistic way. “Network performance refers to measures of service quality of a network as seen by the customer”. There are three important concepts in that definition. The first one has to do with measuring performance. This is critical. Network performance is something that is measured. The second important concept is quality. Performance refers to quality. And last but certainly not least, the customer. Performance is something that is seen or experienced by a user of the network, not just by measuring tools. This is why it is so important to have network performance monitoring tools that are able to take measurements from a user’s perspective.
But isn’t the user’s perspective a highly subjective concept that can be hard to evaluate? It certainly is but, using the right tools and technologies, it can be achieved. The key is to know how each metric does affect perceived performance and this is precisely our topic of the day.
Put differently, a network’s performance is its ability to meet its user’s expectations. This is important as it implies that a network’s performance is user-dependent. Some network use cases have very small performance requirements while others need more. A well-performing network is one where the actual performance matches the usage, giving users a perception that all is working well.
Factors Affecting Network Performance
Several things can affect perceived performance. Some factors are not even network-related. For instance, a server that responds slowly can be interpreted as a sign of network performance degradation. This is one more reason why we need to know what network factors are at play as it will allow, through a process of elimination, to identify non-network performance issues.
In the following paragraphs, we’ll have a look at what factors and parameters are interacting to give users the perception of good—or no so good—performance. Some of these factors are physical characteristics of networks over which we typically have no control while others are elements that can often be improved, thereby giving users the perception of better performance.
Bandwidth and Throughput
Bandwidth and throughput are, in a way, two sides of the same coin. Furthermore, there is not a clear distinction between the two terms and they are often used interchangeably. We feel this is a mistake as they are, in reality, somewhat different concepts.
Bandwidth typically refers to the data-carrying capacity of a network segment by unit of time. It is usually expressed in multiples of bits per seconds, with megabits per second (Mbps) and gigabits per second (Gbps) being the most common. For example, a legacy fast-Ethernet connection has a bandwidth of 10 Mbps. Bandwidth is not something that is measured, nor is it something that varies over time and with increased usage. It is an inherent characteristic of a network. Some circuits use technologies where bandwidth can easily be increased or reduced but, in most situations, it is a fixed parameter that cannot be modified.
As for throughput, it refers to the actual amount of data successfully transmitted by unit of time. Tshroughput is restricted by available bandwidth as well as the available signal-to-noise ratio, network errors and hardware limitations. Most of the same factors affect network performance affect throughput. In fact, throughput is a close cousin of performance. All things being equal, the higher the throughput, the higher the perceived performance.
In the context of perceived network performance, bandwidth and throughput are important because when bandwidth usage approaches the maximum capacity of a network segment, performance usually degrades significantly. This is why although bandwidth is fixed, bandwidth usage must be monitored.
Latency and Delay
Much like bandwidth and throughput, there is often a lot of confusion between latency and delay. This is another situation where two concepts are used interchangeably. Both have to do with the time it takes for data to travel from its source to its destination. Latency is often described as the time from the source sending a packet to the destination receiving it. It can also refer to the round-trip delay time which comprised the one-way latency from source to destination plus the one-way latency from the destination back to the source. In fact, round-trip latency is used more often, mainly because it can be measured from a single point. Round trip latency normally excludes the amount of time that a destination system spends processing the packet and issuing the response.
RELATED READING: 6 Tools to Manage Network Configuration for All Your Devices
Latency is another physical characteristic of networks. It is a factor of the distance between the source and the destination and the speed of light which, incidentally, it’s also the speed at which data travels over any type of media. Like bandwidth, Latency is a fixed parameter. The only way to reduce it is to move the source closer to the destination. Reducing the distance by some 100 km will remove about 1 millisecond of latency.
There are quite a few other factors that add some delay to the network transmissions. For instance, queuing delay occurs when a gateway receives multiple packets from different sources heading towards the same destination. Since only one packet can typically be transmitted at a time, some of them must be queued for transmission, incurring an additional delay. Also, processing delays are incurred while a gateway determines what to do with a newly received packet. Bufferbloat can furthermore cause increased delays of an order of magnitude or more. The combination of propagation, queuing, and processing delays often result in a complex and variable network latency profile.
Latency and delay are the main factors affecting perceived network performance. Fortunately, they can easily be measured either single- or dual-endedly. Dual-ended measurement, as described earlier, if often preferable as it ignores the destination’s processing delay and provides a true measurement of the network’s latency.
Jitter
Jitter is the biggest enemy of network communications and while it is relatively easy to explain, it is somewhat more complicated to understand how and why it can have such an adverse effect on data transmissions. Let’s try to explain. Simply put, jitter is a variation in delay. There are several factors that can cause jitter. In fact, many of the same factors affecting delay also affect jitter. For example, queuing delays are directly related to queue length. And since a typical queue constantly varies in length, so does delay, hence jitter.
The thing with jitter is that it does not affect all network traffic in the same way. When delays vary considerably between the multiple packets that compose a message (i.e. in high jitter situations), the packets could arrive at their destination out of sequence. Let’s take, for example, a transmission comprised of four packets that are transmitted at 10 ms intervals. The first one encounters 20 ms of latency, the second one 60 ms, the third one 40 ms and the last one 20 ms. I’ll spare you the boring math but in such a situation the first packet will arrive first, followed by the fourth, then the third and finally the second. In some situation, this wouldn’t be a problem. For example, if we’re dealing with a file transfer, the packets are sequentially numbered and can easily be reassembled in the proper order at the receiving end. On the other hand, if what we have is real-time traffic such as a streaming video or a VoIP conversation, we’re in trouble as packets cannot be correctly reassembled, resulting in pixelated video or garbled audio. From a user’s standpoint, we’re having a performance issue.
Errors
To a certain extent, network errors are another factor affecting network performance. Bit errors refer to the number of bits of a data stream received over a communication channel that have been altered due to noise, interference, distortion or bit synchronization issues. The bit error rate or bit error ratio (BER) is the number of bit errors divided by the total number of transferred bits during a given time interval. It is often expressed as a percentage.
While networks are very robust and resilient, they will, most of the time, recover from these errors using several methods including built-in error-correction schemes or retransmission of erroneous data. But while these can be acceptable, they often cause unnecessary delays, increased jitter and all sorts of user-perceived performance issues.
ALSO READ: Packet Loss — How to Measure And How to Fix
The Top Tools For Troubleshooting Network Performance Issues
While there are tons of tools for measuring network performance, not all of them are as feature-full as the few we’ve picked for you. The best ones will not only display bandwidth but also several bandwidth-affecting metrics such as latency or jitter thereby helping you quickly troubleshoot network performance issued.
1. SolarWinds Network Performance Monitor (FREE TRIAL)
SolarWinds is one of the best-known vendors of network and system administration tools. It is famous for its many excellent network administration tools. Among the most famous SolarWinds products are the NetFlow Traffic Analyzer and the Server and Application Monitor. The company is also recognized for making a handful of excellent free tools, each addressing a specific need of network and system administrator. The Advanced Subnet Calculator and the Kiwi Syslog Server are two excellent examples of those free tools.
SolarWinds’ flagship product is called the Network Performance Monitor, or NPM. This is a full-featured network monitoring solution with great functionality. The SolarWinds NPM polls any enabled device using the SNMP protocol to read their operational metrics and interface counters. It stores the results in an SQL database and uses the polled data to build graphs showing each WAN circuit’s usage as well as other important metrics.

The SolarWinds Network Performance Monitor boasts a user-friendly GUI. With it, adding a device is as simple as specifying its IP address or hostname and SNMP community string. The tool then queries the device, lists all the SNMP parameters that are available, and allows you to pick those you want to monitor and display on your graphs.
Prices for the SolarWinds Network Performance Monitor start at $2 995 and vary according to the number of devices to monitor. A detailed quote can be obtained by contacting the SolarWinds sales team.
If you’d want to try the product before purchasing it, a free 30-day trial is available, as it is for most SolarWinds products.
2. ManageEngine OpManager
The ManageEngine OpManager is a complete management solution that will address most monitoring needs. The tool can run on either Windows or Linux and it is loaded with excellent features. For instance, its auto-discovery feature can graphically map your network, giving you a uniquely customized dashboard.
The tool’s dashboard is another one of its strong points. It is super easy to use and navigate and has drill-down functionality. If you’re into mobile apps, they are available for tablets and smartphones and will allow you to access the system from anywhere. Overall, this is a very polished and professional product.
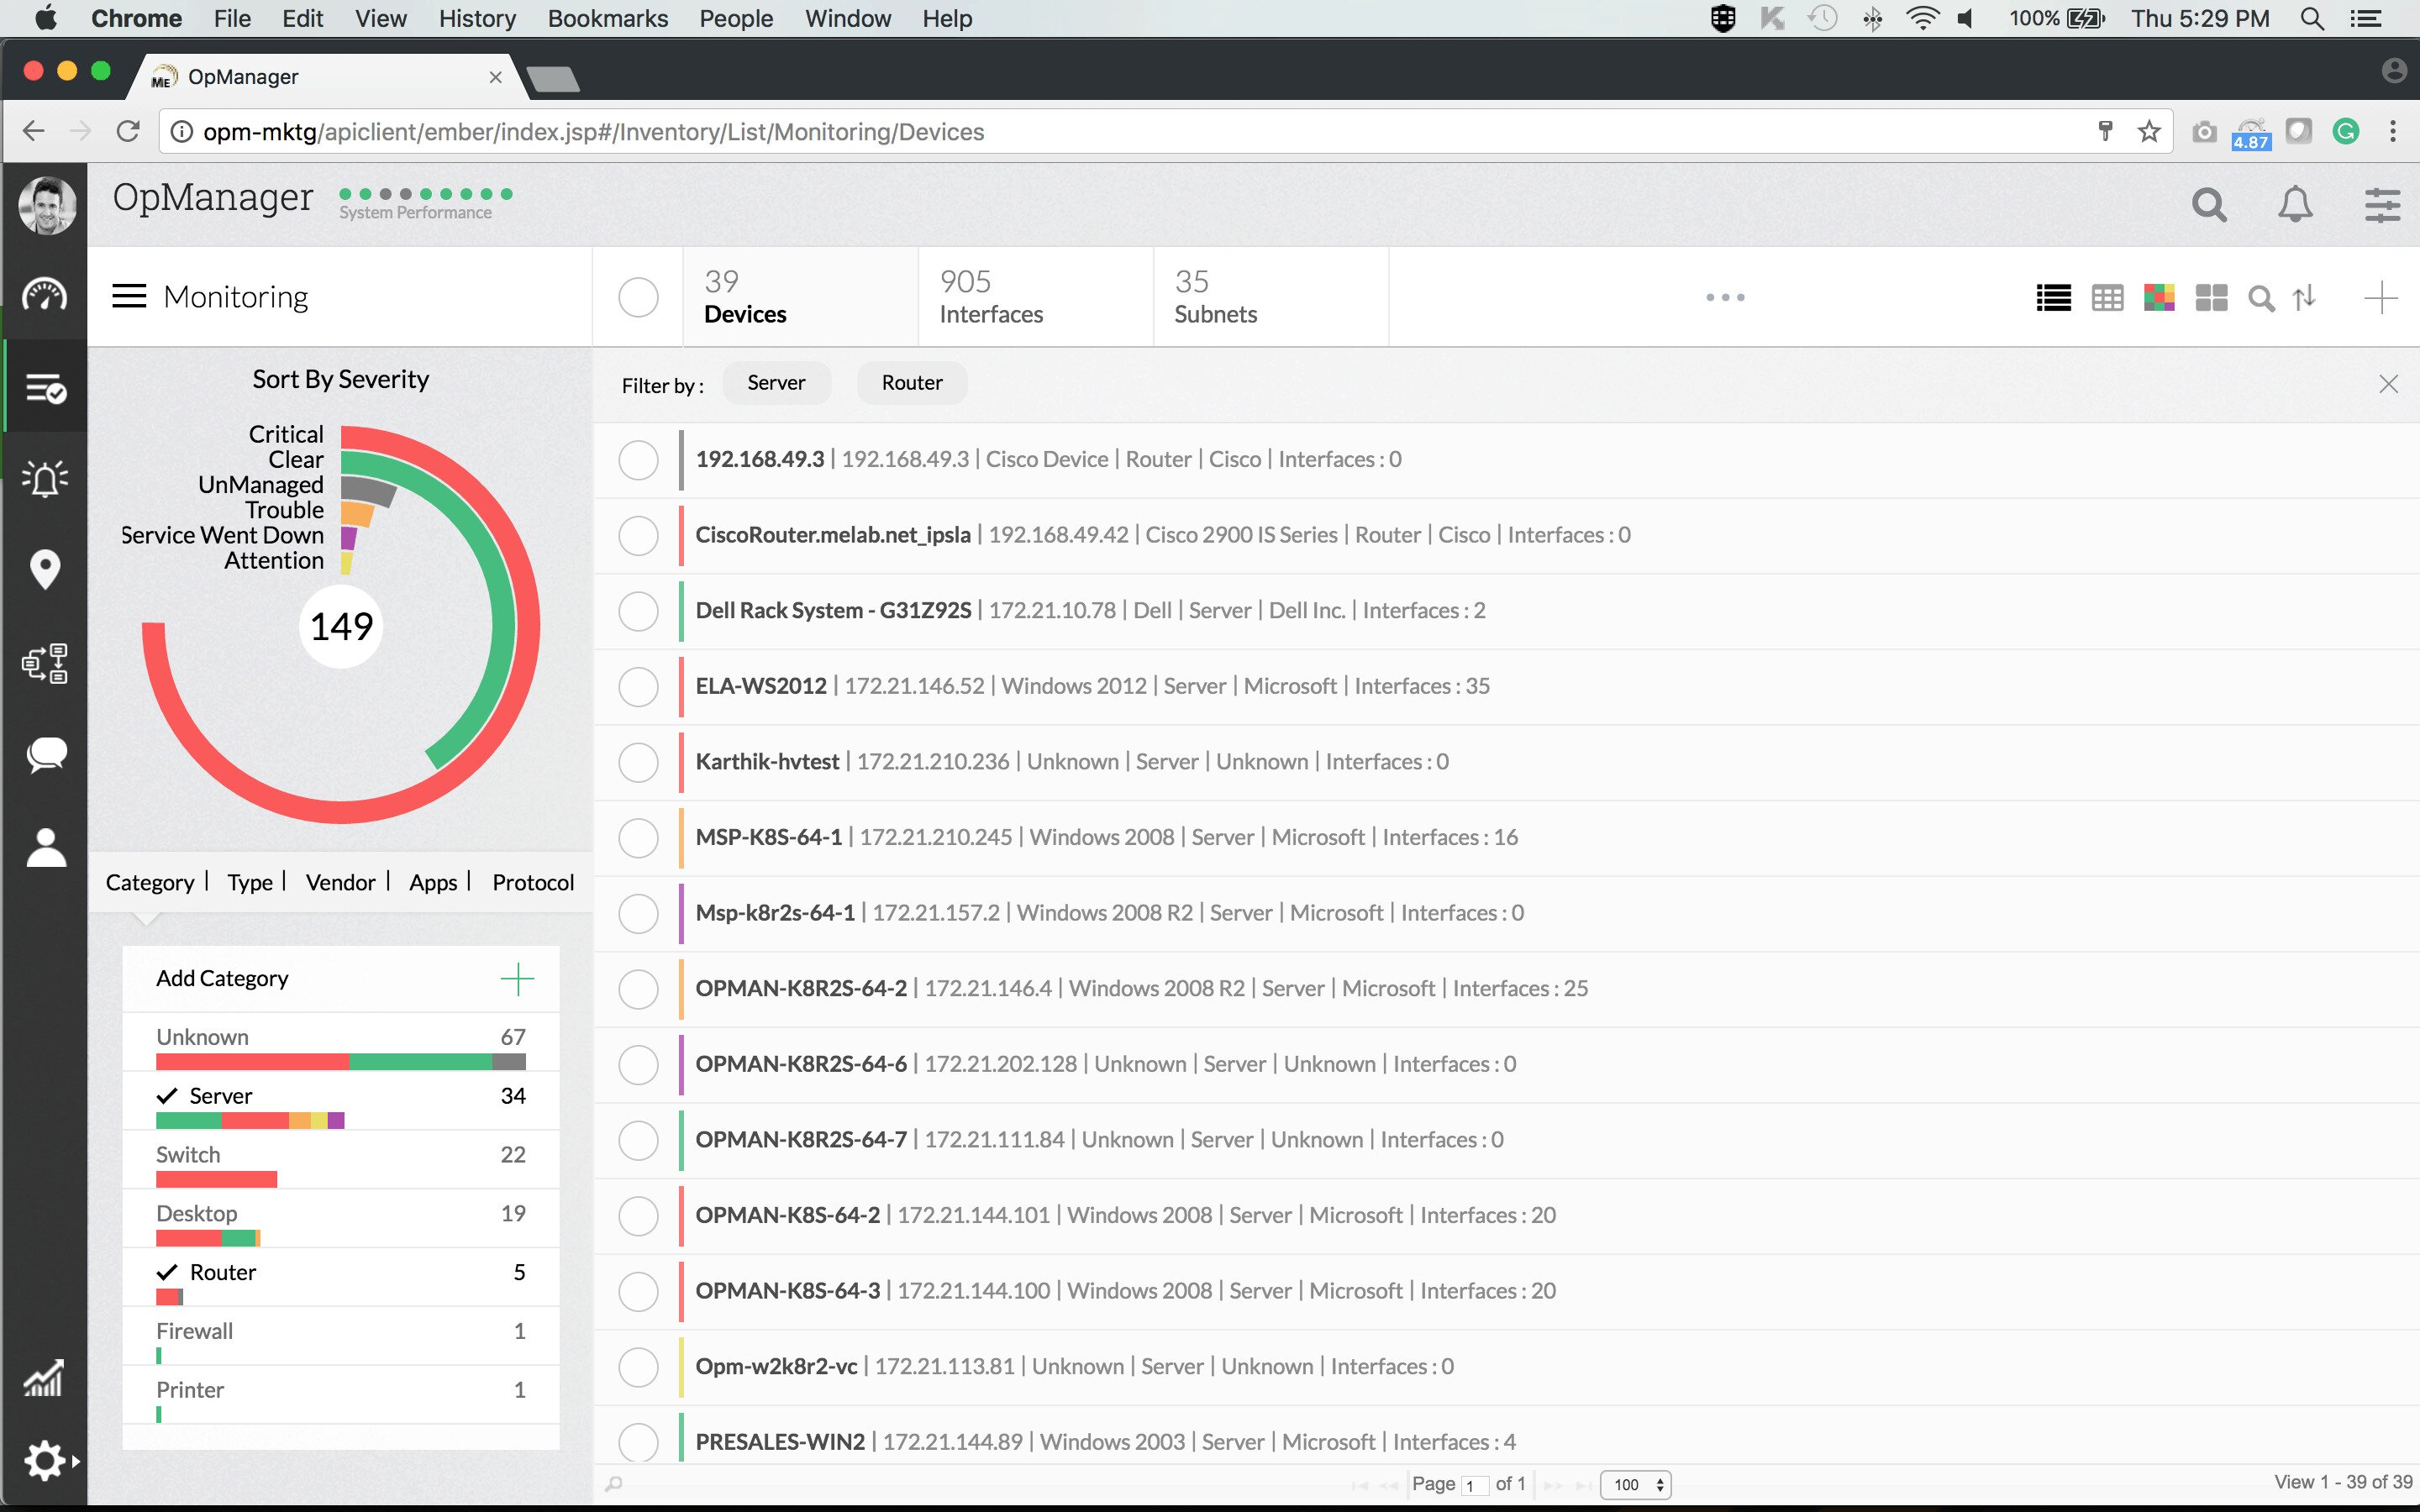
Alerting in OpManager is another of the product’s strengths. There is a full complement of threshold-based alerts that will help detect, identify, and troubleshoot network issues. Multiple thresholds with various notifications can be set for every performance metric.
If you want to try the ManageEngine OpManager, get the free version. It is not a time-limited trial version. It is, instead, feature-limited. It won’t, for instance, let you monitor more than ten devices. While this might be sufficient for testing purposes, it will only suit the smallest networks. For more devices, you can choose between the Essential or the Enterprise plans. The first will let you monitor up to 1 000 nodes while the other goes up to 10 000. Pricing information is available by contacting ManageEngine’s sales.
3. PRTG Network Monitor
The PRTG Network Monitor from Paessler AG is an agentless network monitoring system. Paessler claims that the PRTG Network Monitor can be set up in a couple of minutes. Our experience shows that it can take a bit more than that but that it is still very easy and quick, thanks to an auto-discovery feature that will scan your network, find devices, and automatically add them. The tool uses a combination of Ping, SNMP, WMI, NetFlow, jFlow, sFlow, but can also communicate via DICOM or the RESTful API.
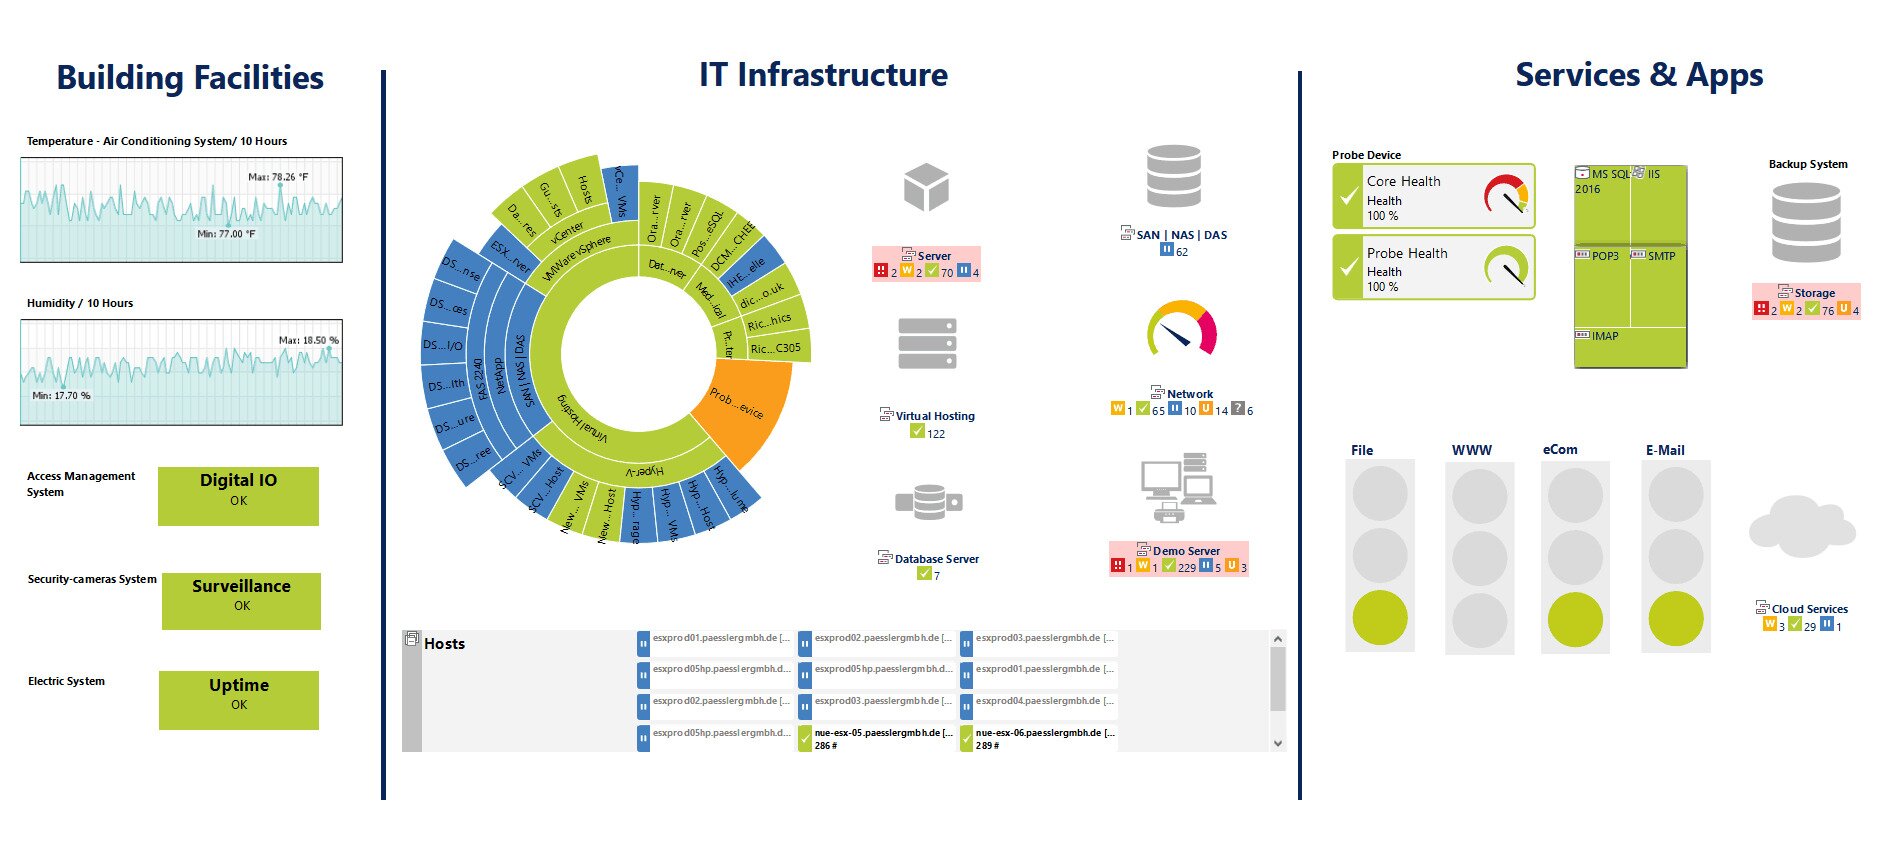
One of the strengths of the PRTG Network Monitor is its sensor-based architecture. You can think of sensors as add-ons to the product except that they are already included and don’t need to be added. There are add-ons for virtually anything. For example, there are HTTP, SMTP/POP3 (e-mail) application sensors. There are also hardware-specific sensors for switches, routers, and servers. In all, there are over 200 different predefined sensors that retrieve statistics such as response time, processor, memory, database information, temperature or system status from the monitored devices.
The PRTG Network Monitor offers a selection of user interfaces. The primary one is an Ajax-based web interface. There’s also a Windows enterprise console as well as mobile apps for Android and iOS. One nice feature of the mobile apps is that they can use push notification of any alerts triggered from PRTG. More standard SMS or email notifications are also available. Although the server only runs on Windows, it can be administered from any device with an Ajax-compatible browser.
The PRTG Network Monitor is offered in two versions. There’s a free version which is full-featured but will limit your monitoring ability to 100 sensors. Note that each monitored parameter counts as one sensor and, for example, monitor 24 interfaces on a network switch will use up 24 sensors. If you need more than 100 sensors, you must purchase a license. Their prices start at $1 600 for 500 sensors. You can also get a free, sensor-unlimited and full-featured 30-day trial version.