

The Best Network Troubleshooting Tools and Software
If you’re a network administrator, chances are one of the phrases you’ve heard the most is “the network is slow”. No matter what, it seems like everyone is always quick to blame the network whenever something doesn’t work as efficiently as expected.
There’s a simple reason for that: The network is often to blame. Modern networks are rather complex and there are so many places where things can go wrong. So, when someone complains of poor network performance, what you need are the proper troubleshooting tools to help you pinpoint exactly where the issue lies, what it is, and how to fix it. And if it turns out the problem has nothing to do with the network, those same tools can help you demonstrate it, which is often mandatory to get other teams to even acknowledge the problem.

However, with so many network troubleshooting tools to choose from, picking the right one for the job can be a challenge. We hope this post can help as we’re about to have a look at some of the very best network troubleshooting tools.
The Top Network Troubleshooting Tools
Let’s dive right into the details of the actual tools. Our list includes both GUI-based and command-line tools. It also has a good mix of local and web-based tool. Some of the tools have a single, very precise purpose while others are complete toolkits. They all have one thing in common: they can help network administrators do a better job. For each tool on our list, we’ll describe its primary features and how it can be used. Let’s go!
1. SolarWinds Engineer’s Toolset (FREE TRIAL)
First on our list is an excellent toolkit from SolarWinds simply called the Engineer’s Toolset. SolarWinds, in case you don’t already know, is one of the major players in the field of network administration tool. Their flagship product, the Network Performance Monitor is considered by many as the reference when it comes to SNMP network monitoring tools. The company is also well-known for its many free tools, each addressing a specific task. These free tools include the Network Device Monitor and Traceroute NG are two great examples of those free tools.
As its name implies, the SolarWinds Engineer’s Toolset is a set of tools. Over sixty of them, to be precise. You can use the included tools to continuously monitor servers, routers, workstations, or other devices to show response time in real-time and display response rates in graphical charts. The toolset, for example, includes a “Simple Ping” tool which is an alternative to the ping that comes with your operating system and can be used to measure a host’s response time and packet loss.

But Ping is definitely not the only tool bundled with this impressive pack, and although some of the 60+ tools that you’ll find in the Engineer’s Toolset are free tools that are also available individually, most are exclusive tools which can’t be obtained any other way. The toolset has a centralized dashboard which allows you to easily access any of the included tools. Among the different tools you’ll find, some can be used to perform network diagnostics and help resolve complex network issues quickly. Security-conscious network administrators will appreciate these other tools that can be used to simulate attacks on your network and help identify vulnerabilities.

The SolarWinds Engineer’s Toolset also includes a few more monitoring and alerting tools such as one which will monitor your devices and raise alerts when it detects availability or health issues. This will often give you enough time to react before users even notice the problem. To complete an already feature-rich suite of tools, configuration management and log consolidation tools are also included.
Describing in minute details every included tool would make for a very long—and possibly quite boring—post. Instead, here’s a list of some of the best tools you’ll find in the SolarWinds Engineer’s Toolset.
- Port Scanner
- Switch Port Mapper
- SNMP sweep
- IP Network Browser
- MAC Address Discovery
- Ping Sweep
- Response Time Monitor
- CPU Monitor
- Interface Monitor
- TraceRoute
- Router Password Decryption
- SNMP Brute Force Attack
- SNMP Dictionary Attack
- Config Compare, Downloader, Uploader, and Editor
- SNMP trap editor and SNMP trap receiver
- Subnet Calculator
- DHCP Scope Monitor
- IP Address Management
- WAN Killer
The SolarWinds Engineer’s Toolset sells for only $1495 per administrator seat. If you consider that it includes over 60 different tools, this is a very reasonable price. A free 14-day trial is available from SolarWinds so your best bet is likely to go to the SolarWinds website, download the trial and see for yourself all it can do for you.
2. Wireshark
Wireshark, which was previously known as Ethereal, has been around for 20 years. If not the best, it is certainly the most popular network sniffing tool. Whenever a need for packet analysis arises, this is often the go-to tool of most administrators. Before Wireshark, the market had essentially one GUI-based packet sniffer which was aptly called Sniffer. It was an excellent product that suffered from one major drawback, its price. Back in the late 90’s the product was about $1500 which was more than many could afford. This prompted the development of Ethereal as a free and open-source packet sniffer by a UMKC graduate named Gerald Combs who is still the primary maintainer of Wireshark twenty years later.
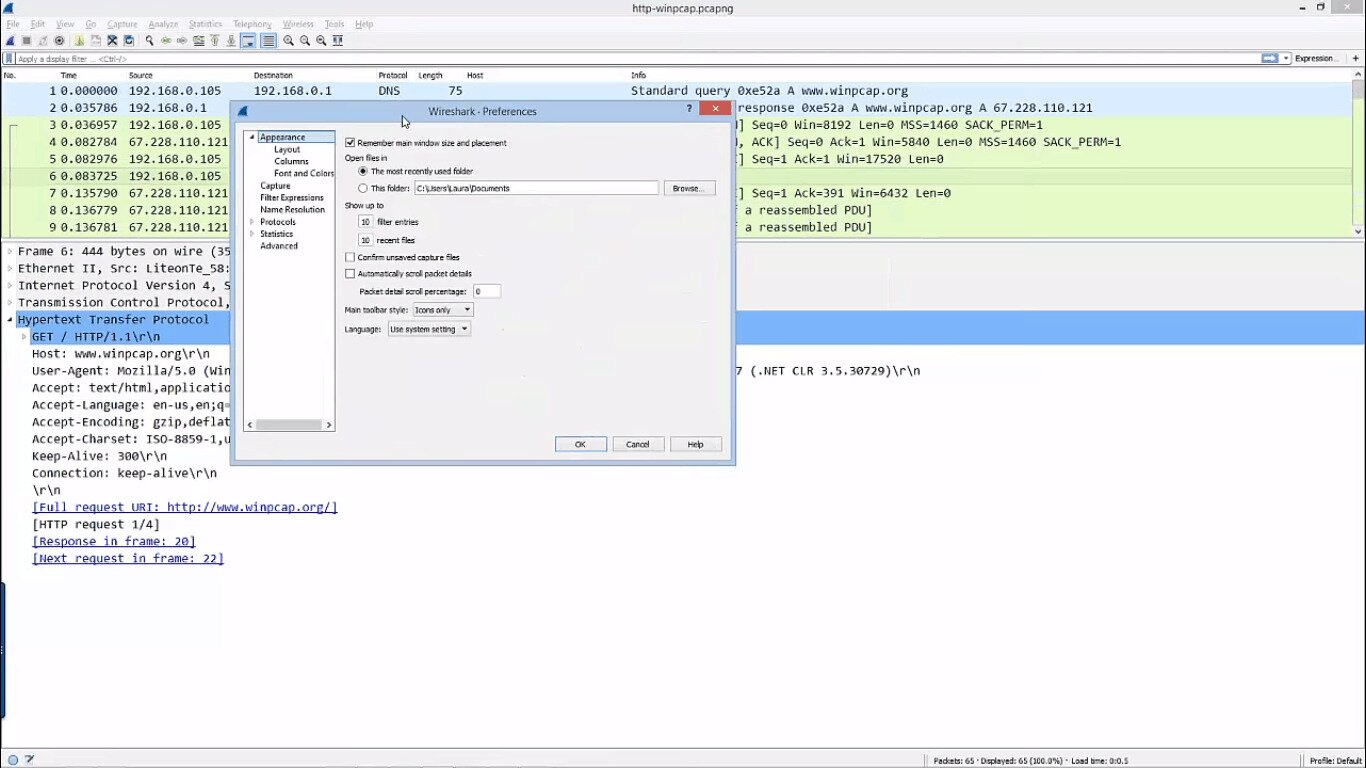
Today, Wireshark has become THE reference in packet sniffers. It is the de-facto standard and most other tools try to imitate it. Wireshark does mainly two things. First and foremost, the tool captures all traffic it sees on its interface. However, it doesn’t stop there. The product,s real strength is in its powerful analysis capabilities. They are actually so good that it’s not uncommon for users who use other tools for packet capture to run the analysis of the captured data using Wireshark. In fact, this is so common that, upon startup, you’re prompted to either open an existing capture file—potentially created with another tool—or start capturing traffic. Another strength of Wireshark is the filters it incorporates which let you zero in on exactly the data you’re interested in.
While Wireshark has a steep learning curve, it is well-worth learning at it will prove time and again to be an invaluable tool for many network troubleshooting tasks. It is definitely something that should be part of every network administrator’s toolset. And given its price—it’s free—there is no reason why not to use it.
3. Tcpdump/Windump
Before there were GUI-based capture and analysis tools, there was tcpdump. It was created back in 1987, over ten years before Wireshark and even before Sniffer. And although the tool has been constantly maintained and improved since its initial release, it still remains essentially unchanged and the way it is used has also not changed much through its evolution. It is available for installation on virtually every Unix-like operating system and has become the de-facto standard for a quick tool to capture packets. Tcpdump uses the libpcap library for the actual packet capture.
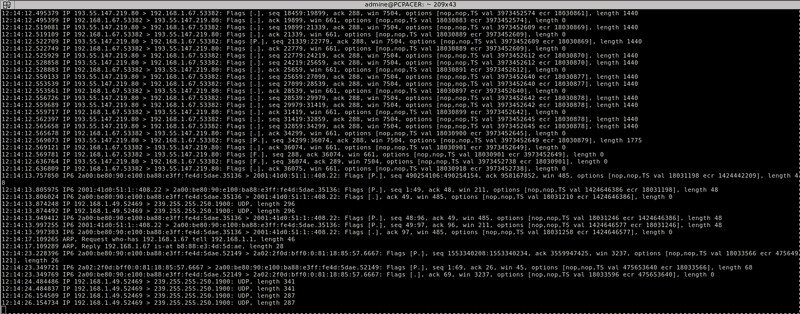
The default operation of tcpdump is relatively simple. It captures all traffic on the specified interface and “dumps” it—hence its name—on the screen. You can pipe the output to a capture file to be analyzed later using the analysis tool of your choice. In fact, it’s not uncommon for users to capture traffic with tcpdump for later analysis in Wireshark. One of the keys to tcpdump’s strength and usefulness is the possibility to apply filters and/or to pipe its output to grep—another common command-line utility—for further filtering. Anyone mastering tcpdump, grep and the command shell can get it to capture precisely the right traffic for any debugging task.
As for Windump, it is a port of tcpdump to the Windows platform. As such, it behaves in much the same way. What this means is that it brings much of the tcpdump functionality to Windows-based computers. While Windump may be a Windows application, don’t expect a fancy GUI. This is nothing more than tcpdump on Windows and as such, it is a command-line only utility.
Using Windump is basically the same as using its *nix counterpart. The command-line options are just about the same and the results also look almost identical. And just like tcpdump, the output from Windump can be saved to a file for later analysis with a third-party tool such as Wireshark. However, with grep not usually available on Windows computers, the filtering abilities of the tool are more limited although still impressive.
Another important difference between tcpdump and Windump is that it is readily available from the operating system’s package repository. You’ll have to download the software from the Windump website. It is delivered as an executable file that requires no installation, making it an ideal portable tool which could be launched from a USB key. However, just like tcpdump uses the libpcap library, Windump uses the Winpcap library which needs to be separately downloaded and installed.
4. Ping
Although it comes fourth on our list, ping is likely the best-known and most-used troubleshooting tool. It came to life back in 1983 when a developer who was seeing an abnormal network behaviour couldn’t find the right debugging tool. He then decided to create one, calling his tool ping which, by the way, refers to the sound of sonar echoes as heard from inside a submarine. Nowadays, the common utility is available on virtually every operating system with IP networking and although individual implementations vary slightly in their available options, they all serve the same basic purpose.
Differences between various ping implementations are mostly related to the available command-line options which can include specifying the size of each request’s payload, the total test count, the network hop limit of the delay between requests.
Here’s a sample run of the ping command:
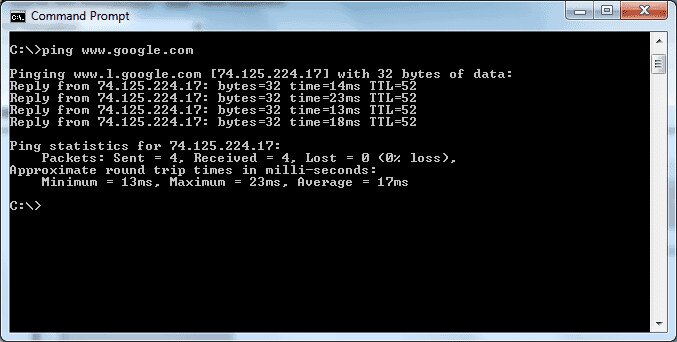
Ping is a clever and powerful yet simple utility. It works by sending a series of ICMP echo request packets to the specified target and waiting for it to send back ICMP echo replies. The process is repeated a certain number of times (by default, 5 times under windows and until it is stopped under most Unix/Linux implementations.), allowing the tool to compile statistics. Ping measures the time between the request and the reply and displays it in its results. On Unix variants, it will also display the value of the reply’s TTL field, indicating the number of hops between the source and the destination. In fact, what is displayed in the command response if another place where various implementations differ.
Ping operates under the assumption that the target host follows RFC 1122 which prescribes that any host must process ICMP echo requests and issue echo replies in return. Although most hosts do, some disable that functionality for security reasons. Firewalls will also often block ICMP traffic altogether, preventing ping from doing its job. Ping accomplishes two important diagnostic tasks: it validates that there is communication between the test device and the target and it validates that the target is responding.
5. Traceroute/Tracert
Traceroute—or tracert if you’re coming from the Windows world—is, along with ping and a few others, one of the most basic network troubleshooting tools. As its name suggests, traceroute can trace the route from one network-attached device to another. It’s a pretty useful tool that will not only test the connectivity to a host—as ping does—but it will also reveal a lot about the path to get there and issues that may be plaguing it. In a nutshell, traceroute will return the IP address of every router encountered between the source device and the target device but it will also report on the response time of each of these routers.
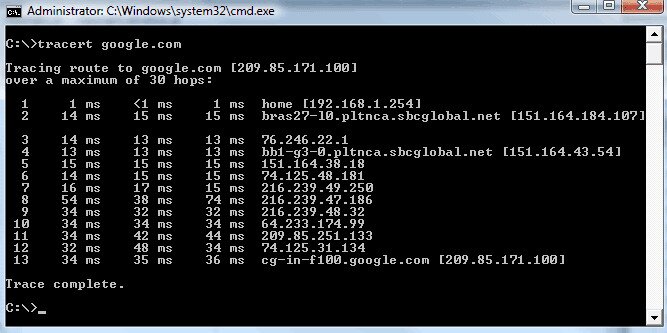
Traceroute is another old tool which dates back to 1987. This is over 30 years ago; an eternity in computer years. It is also a very common tool. First introduced on the Unix operating system, it is now present on every Unix-like OS including Linux and Mac OS X. It even eventually got ported to the Windows platform where it was renamed to tracert, possibly due to the eight character filename limitation that once plagued Microsoft’s operating systems.
Traceroute is definitely a tool that every network administrator should understand and use. It is not perfect, though and it has a few pitfalls that one needs to be aware of. For example, a path could be asymmetrical with traffic to the target taking a different route than traffic back from it, something that traceroute wouldn’t see and that could be the cause of many hard-to-troubleshoot issues.
6. Ipconfig/Ifconfig
Although ipconfig and ifconfig are two widely different tools, we’ve elected to discuss them together as, in a network troubleshooting context, both serve a similar purpose.
Ipconfig is a command-line tool that is built into the Windows operating system. It is used to display information about the IP protocol stack of the local computer. Various switches or command-line options let one display more or less details. By default, it displays the IP address, subnet mask and default gateway associated with each network interface installed on a computer. Adding the /all option will display considerably more information. It will, for instance, display the MAC address of each interface. It will also indicate if the IP address and configuration was done manually or through DHCP. And in the case of DHCP, it will tell you the details about the DHCP server and lease.
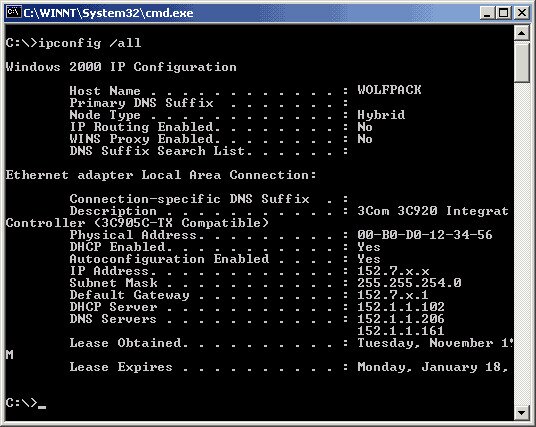
But ipconfig has another utility beyond providing information about the local machine. Some of its command-line switches give you control over certain aspects of the IP stack. For instance, DHCP leases can be modified by using the commands ipconfig /release and ipconfig /renew. Another example is the ipconfig /flushdns command which can be used to clear the DNS name resolution cache.
As for ifconfig, it is a system administration utility on Unix-like operating systems. It is used to configure, control, and query TCP/IP network interface parameters from a command line interface. Its parameters and options are different from those of ipconfig but, overall, it can be used in a similar context to verify the parameters of a suspicious network interface.
7. Netstat
On a typical computer, you can have dozens of active network connections at any given time, making it much harder to troubleshoot connectivity issue. This is precisely why netstat was created. The tool can be used to help identify the status of each connection and which service is using each one, potentially helping to narrow down your search. Netstat, which is available on most—if not all—operating systems, can quickly provide details about client services and TCP/IP communications.
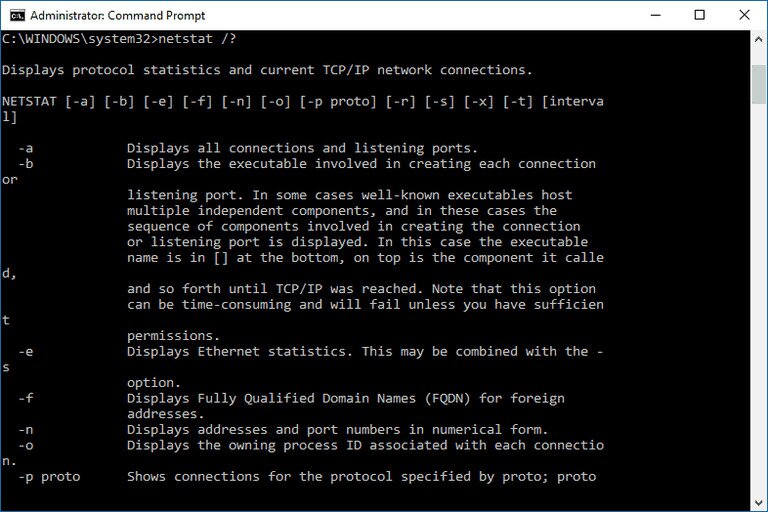
Launching netstat from a command prompt displays all active connections on the local computer, both incoming an outgoing. Actually, it won’t just list active connections, it will also list idle ones. Furthermore, netstat can also display listening ports on the computer where it’s run. Netstat is a command that accepts many options, giving you more control over what information is returned. This can lead to some confusion as the available options differ between platforms. For instance, netstat -b on Windows would display the name of the executable associated with each connection whereas on OS X or BSD, it is used in conjunction with -i to display statistics in bytes. The best way to learn about all the available parameter of your specific version on Netstat is to run it with the -? option, displaying the tool’s help screen.
8. Nslookup/dig
Nslookup and dig—we’ll see in a minute how they differ and how they are similar—are tools used to verify/test/validate DNS resolution. The Domain Name Service, or DNS, is a network service used by computers to resolve hostnames—such as www.microsoft.com, which is easier to use for us Humans—to IP addresses—such as 23.50.228.154, which is easier for a computer. Incorrect DNS resolution—where a DNS server will return an erroneous IP address or fails to respond in a timely manner—is a common problem despite being often overlooked.
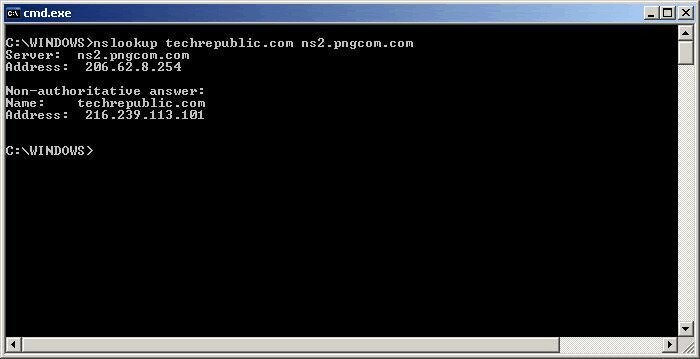
The nslookup command is usually followed by a hostname and it will normally return the corresponding IP address. There is one major drawback with this tool. Although it does, by default, interrogate the locally configured DNS server, it uses its own name resolution routines rather than calling the operating system’s name resolution libraries. Consequently, nslookup could return the correct information even in a situation where the computer’s name resolution doesn’t work.
Dig, a similar tool, was created in part to address this issue. Although it uses a very different syntax—especially when using advanced options, dig serves essentially the same purpose as nslookup but uses the operating system’s libraries. And since nothing is perfect, dig’s primary drawback is that it’s not included in most operating systems. It does come bundled with Bind—the ISC DNS server software—which can be downloaded from the ISC’s website.
In Conclusion
No matter what your exact troubleshooting need is, there are plenty of tools available to assist you. We’ve just given you a few examples of the most common ones. The tools outlined herein for what should be the basis of any network administrator’s toolkit. Most of the are available at no charge and your only investment is to learn how to use them. As for the SolarWinds Engineer’s Toolset, the only paid tool on our list, it is well-worth its reasonable price. And since a free trial is available, there’s absolutely no reason not to give it a try and see how useful it is.