3 Tools To Create And Embed Graphs Or Charts Online
Nothing beats a good graphical representation of data. You can sit and write a very well-worded explanation of what a data set represents but if you don’t have a nice graph to show the overall t rend, you may have written in vain. As far as desktop apps are concerned, you have excellent options like iWork for Mac, Office Libre for Linux, and MS Office for Windows. These are all desktop solutions that can be used to create great charts for documents and presentations. With online publishing, presenting charts is different; you can use a graph created and exported from a desktop app, or you can use the many online tools that have been created for presenting better graphs to an online audience. Here are three free tools that do just that and come with an embed feature.
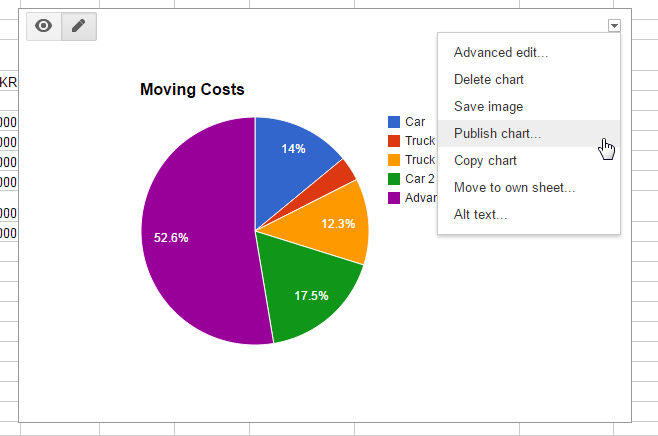
Google Spreadsheets
We usually use Google Spreadsheets to edit or create spreadsheets and nothing more but it has a chart feature and these charts can be embedded anywhere online. If you’re going to use an online tool to create and embed charts, Google Spreadsheets is possibly one of the best options to choose from because you can update a chart any time, and you have your Google Drive space to save as many charts and spreadsheets as you want. Not many tools come with as powerful features for editing and formatting data as Google Docs does so this is possibly the best option of the lot.
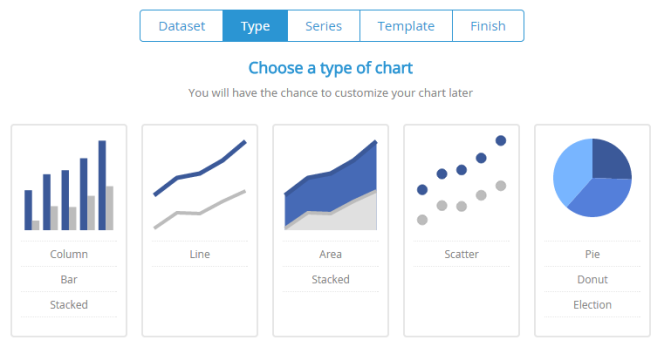
ChartBlocks
ChartBlocks is an online app with both free and premium plans which means the number of free charts you can create with it are limited. The good thing about this app is that it creates some truly gorgeous graphs. You have a selection of five common chart types to choose from and plenty of templates. You can import your own data and name charts to your liking.
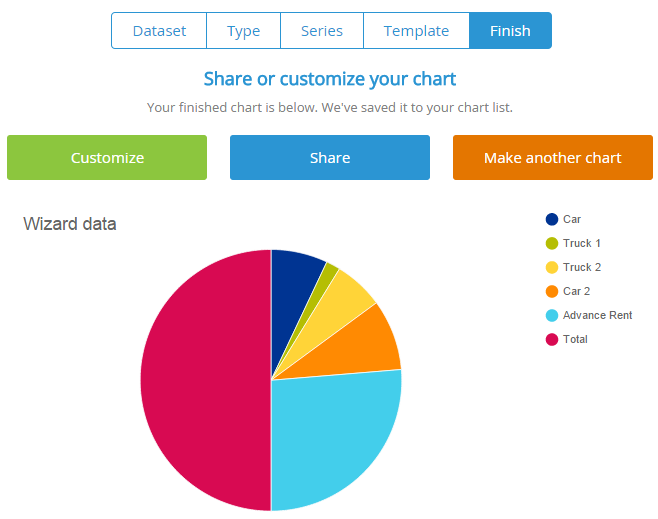
The templates make it so you don’t have to worry about which colors to use and the app has plenty of sharing options. A chart’s dimensions can be set down to the pixel, you can add more data to it, customize the colors if you don’t like a theme, and much more. Where Google Spredsheets gives you lots of control over data and how you can manipulate it, ChartBlocks gives you lots of control over the chart’s appearance.
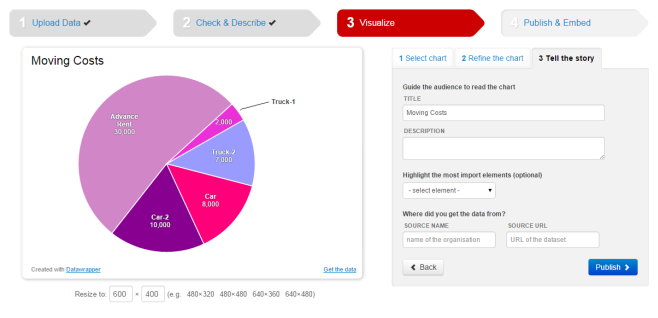
Datawrapper
Datawrapper doesn’t even require you sign up to create and publish a chart. Its data editor isn’t the most feature rich. You can paste data but editing it will more likely than not, mess with the app’s understanding of individual data points. You should have your data properly formatted before pasting it into the app. With that in mind, you might be wondering why this app is listed here.
Datawrapper is a great chart publishing tool if you’re citing a study. Not only does it let you customize your data points and how they are represented in a chart and supports different chart types, but it also lets you embed the source of the data, add a description, and even highlight an element on the chart if you want. For any academic publishing, this app is pretty good.
Bonus: Check out Vizualize.me if you would like to create a resume that is an infographic of your career.

Google Docs also lets you graph and share live and updating data using Forms or just through a spreadsheet. Their customization stinks though.