BlueScreenView: View BSOD Crash Info on Windows
When a system suffers from a BSOD aka Blue Screen of Death, it can be hard to determine its cause. Sometimes a BSOD can appear due to hard disk failure, whereas at other instances it can appear due to an incompatible driver or a specific stop code like PFN_LIST_CORRUPT. Having a reliable tool to analyze these crashes is essential for any Windows user or system administrator.
What Is BlueScreenView?
BlueScreenView
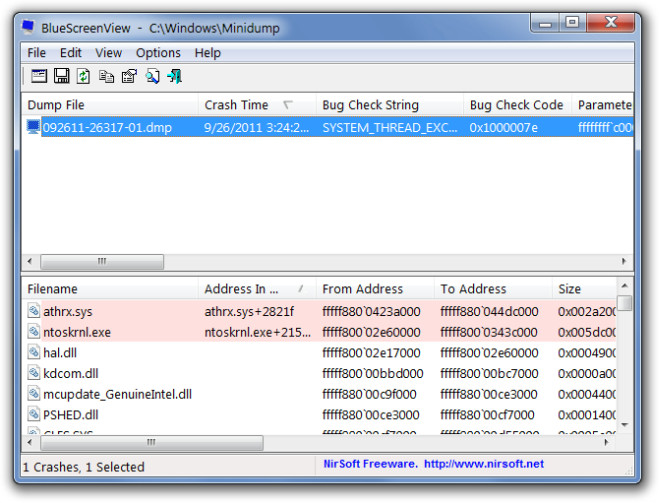
When reviewing crash data, it helps to understand what each part of the interface is telling you. The upper pane lists each recorded crash event, showing its Bug Check Code, parameters, crash time, and the name of the dump file. The lower pane displays the drivers and modules that were loaded into memory at the time of the crash. BlueScreenView highlights any driver whose memory address falls within the crash stack — these highlighted entries are your strongest leads for identifying the offending driver or module. Keep in mind, though, that the highlighted driver is not always the definitive root cause; sometimes a faulty driver triggers a crash in a different, innocent module, so further investigation may still be needed.
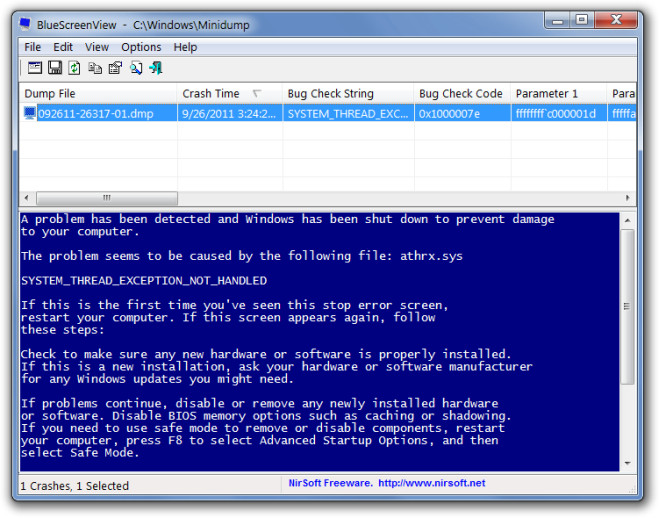
The crash details can also be viewed in the conventional Blue Screen view within the application’s interface. This makes it straightforward to replicate exactly what Windows displayed at the time of the crash, giving you important context for diagnosing the problem.
Once launched, BlueScreenView automatically scans your minidump folder and displays crash information. Driver version and resource information is extracted and displayed automatically along with file version, product, company, bug check string, bug check code, and file description. This automated scanning saves considerable time compared to manually parsing raw dump files.
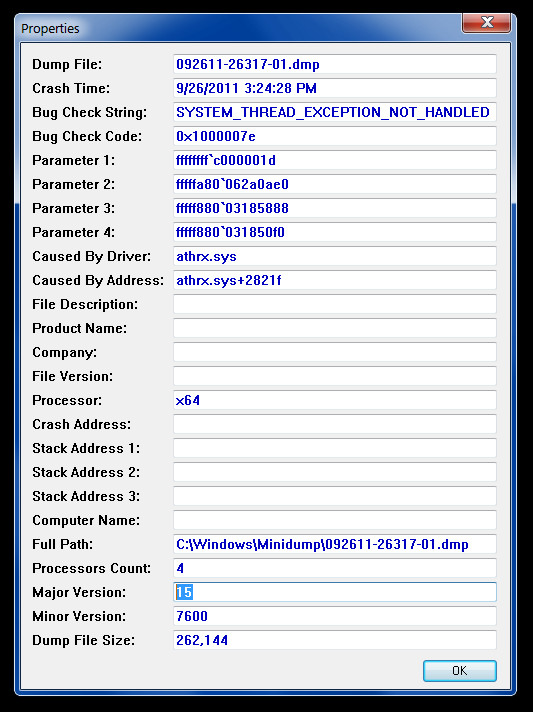
You can double click on any file name or dump file to find more details about it. The properties window reveals additional technical data, including the exact memory address where the crash occurred and the specific driver or module responsible.
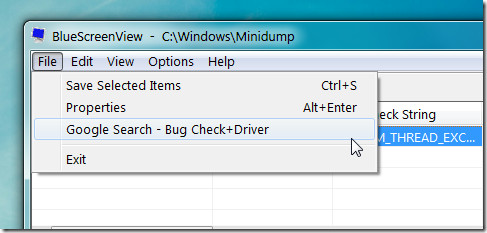
To quickly search for an available bug, check for the driver using Google Search. Head over to the File menu and select “Google Search – Bug Check+Driver”. This feature lets you look up the specific error code and driver combination directly in your browser, which is especially useful when dealing with unfamiliar stop codes.
To see the crash report in the conventional blue screen form, go to Options → Lower Pane Mode → Blue Screen in XP Style. The crash report data can also be saved in TXT, HTML, XML, and CSV format, making it easy to share with technical support or document recurring issues for further analysis.
BlueScreenView Features and System Requirements
BlueScreenView, like other Nirsoft applications, comes with many other common options, such as searching for information using matching cases, view of columns and rows, enabling/disabling of interface headers, and so on. These additional options make it flexible enough for both casual users and IT professionals who need to manage crash logs across multiple machines.
One particularly useful feature is the ability to load minidump files from a custom folder path, not just the default Windows minidump directory. This means you can analyze crash dumps copied from another computer without needing to install any software on that machine, since BlueScreenView is fully portable.
BlueScreenView is available in both 32-bit and 64-bit builds and supports Windows XP through Windows 11. The current release is version 1.55. As long as Windows is configured to save minidump files, BlueScreenView can analyze crash dumps from any supported version of Windows. To ensure minidump files are being saved, you can verify this setting by going to System Properties → Advanced → Startup and Recovery, and confirming that “Small memory dump” is selected under the Write Debugging Information section.
Because BlueScreenView requires no installation, it can be kept on a USB drive and used on any compatible Windows system at a moment’s notice. This portability makes it an invaluable addition to any troubleshooting toolkit, whether you are a home user dealing with an occasional crash or a technician supporting multiple workstations.
How to Use BlueScreenView and What to Do If No Dumps Appear
Because BlueScreenView is fully portable, getting started takes only a minute. Here is the basic workflow for your first use:
- Download the ZIP archive from the NirSoft BlueScreenView page and extract it to any folder on your PC or USB drive.
- Run BlueScreenView.exe directly — no installation is required.
- The tool will automatically scan the default Windows minidump folder (%SystemRoot%\Minidump) and populate the upper pane with any crash records it finds.
- Double-click any crash entry in the upper pane to open its properties and inspect the full details, including the exact memory address and the highlighted suspected driver.
- To research an unfamiliar stop code or driver, go to File → Google Search – Bug Check+Driver. This opens a pre-filled search in your browser so you can quickly find known fixes or community reports.
- If you need to share the results or document the crashes, go to File → Save Selected Items and export to TXT, HTML, XML, or CSV format.
What to Do If BlueScreenView Shows No Dump Files
If BlueScreenView opens but the list is empty, it usually means Windows is not saving minidump files, or the files are stored somewhere unexpected. Try these steps:
- Open File Explorer and check that the folder %SystemRoot%\Minidump (typically C:\Windows\Minidump) exists and contains .dmp files. If the folder is missing or empty, Windows has not been saving crash dumps.
- To enable minidump saving, go to Control Panel → System → Advanced System Settings → Startup and Recovery → Settings, and under Write Debugging Information select Small memory dump (256 KB). Click OK and restart your PC. The next crash will generate a dump file.
- If you have dump files in a different location — for example, copied from another machine — use File → Advanced Options in BlueScreenView to point the tool at that specific folder or an individual .dmp file.