Excel 2010: Error Bars
Data visualization tools always help the audience to understand the spreadsheet data in an interactive way but if you are able to show data variability in charts, along with other visualizations then it makes your charts more professional. With Excel 2010 Error Bars you can now show data variability and discrepancy in related data values. You can easily let Excel know the values and percentages on which Error Bars should be visible. Error Bars are great tool to aggrandize the chart showing X and Y bars, which eventually confine user to enter data values in specific range. It can be used with almost every type of chart but in this post we will be using it with Scatter and Trend lines chart.
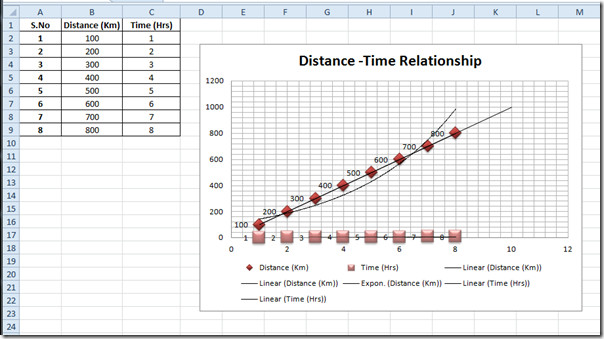
Launch Excel 2010 spreadsheet containing chart on which you want to show Error bars. For instance, we have included a spreadsheet containing simple table defining Distance-Time relationship having Distance and Time fields respectively, as shown in the screenshot below.

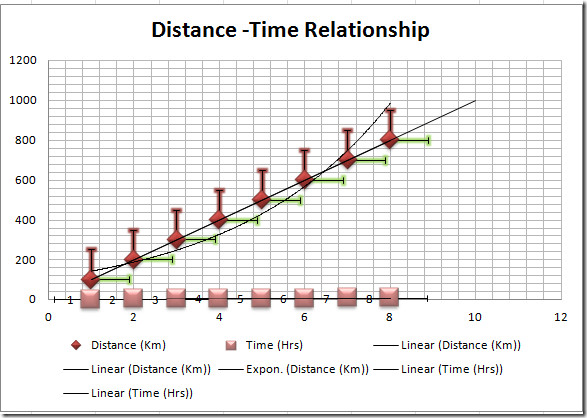
Along with the table we have also included a Scatter & Trend line graph, which made out of Distance-Time data values.
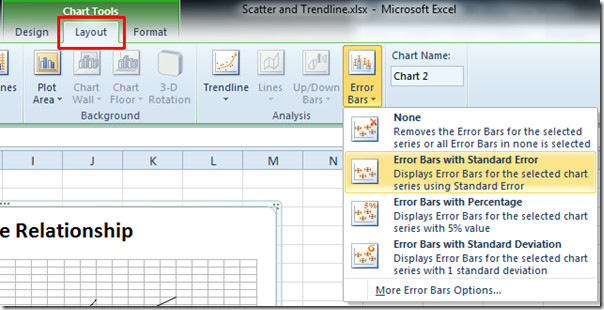
Now we want to show the Error Bars in chart. For this, select the chart area and navigate to Layout tab, from Error Bars, click Error Bars With Standard Error.
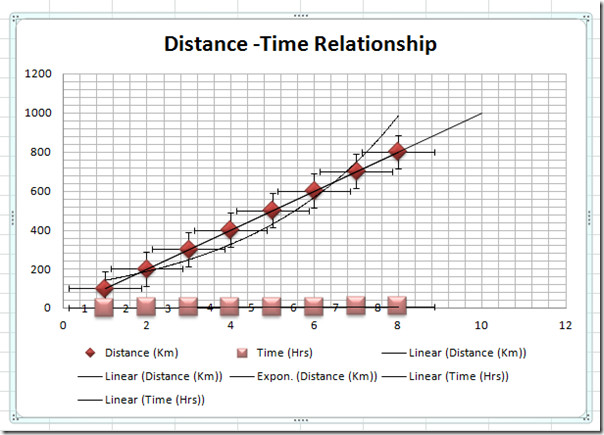
Upon click it will automatically show positive & negative and X & Y axis Error Bars in the chart.
Now from Current Selection group under drop-down options select the Error Bars axis that you want to customize. You can choose X-axis or Y-axis for showing Error Bars.
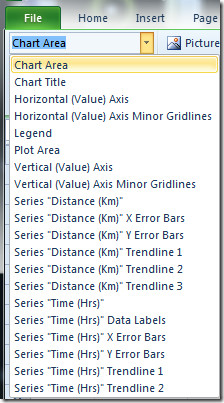
We have chosen Series Distance (Km) Y Error Bars from the list. From Error Bars menu, click More Error Bars Options. We have selected Y-axis, thus Format Errors Bars dialog will appear containing Vertical Errors Bars options only. Now from Direction you can change the direction of the Error Bars. As we want to show only the bars for positive values so we would go for Plus. From End Style, select an appropriate style and From Amount select the option that best suits your data. From left sidebar of the window select the suitable design and styling options for Error Bars to make them prominent in the chart. Hit Close to continue.
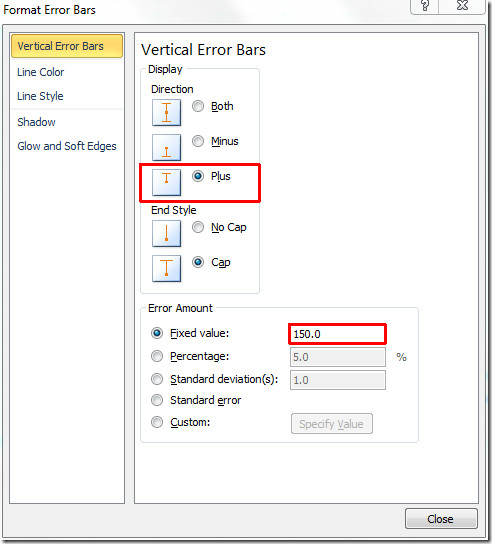
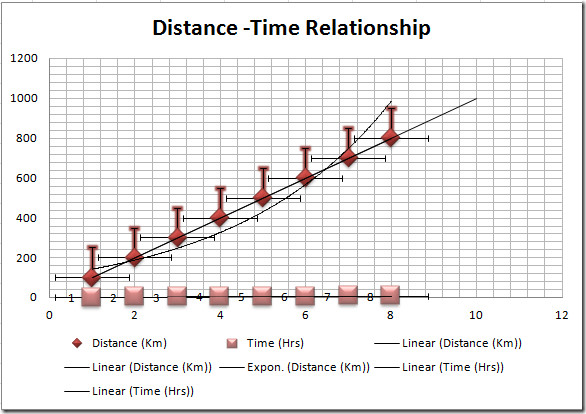
You will see that only the positive vertical direction in the chart, the fixed value shows the Error vertical line against the specified value.
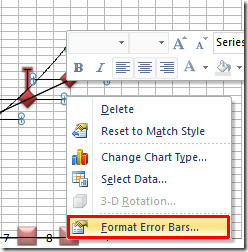
Now we will be customizing horizontal bars that are best suited for spreadsheet. Right-click On the horizontal line in Error bars and click Format Error Bars.
Format Error Bars window containing only Horizontal Error Bars options will appear. Under Direction, as we want to show only the bars for positive values so we would go for Plus. Under Error Amount, we selected Fixed Value. If you want to to show Error Bars with percentage or from Standard Deviation perspective then select the respective options.
On left sidebar of the window select the suitable design and styling for Error Bars to make them prominent in the chart. Click Close to continue.
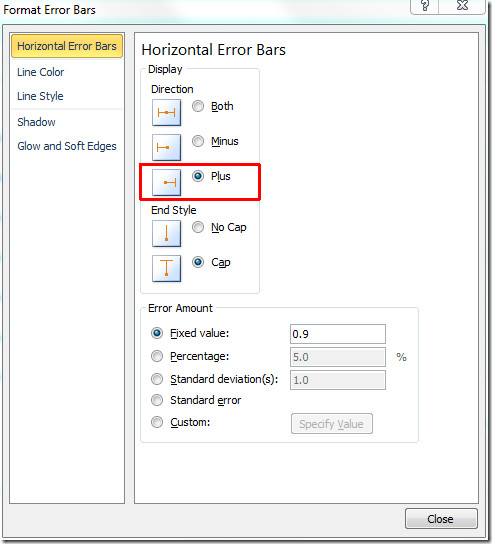
You can see the horizontal bars are only shown in the positive X-axis direction and taking range as specified in Fixed value.
You can also check out previously reviewed guides on Hyperlinks In Excel 2010 & Complete Guide on Data Consolidation in Excel 2010.

Worthless. You need to be able to select different sized error bars for each point, not the same value for each point. This advice allows only the latter.
peltier (a saviour) has a utility that does error bars pretty well in 2007
Helpful!!! thank you!
thanks, it was very useful for me.
Dear Sirs
Could you please give guide how to make, or add error bars
different for say 6 points XY -Error bars for Y in Excel 7 or 10
will be most grateful. Individually for each point
with many thanks
Vic
dear all
can i use error bars for excel 2010 in excel 2007 thanks 4your info.
Best
Atakan
we need error bars for excel 2007 could you send me the download link please? Thanks.
Best regards,
Atakan