Find Correlation Between Datasets In Excel 2010
Excel 2010 supports a multitude of statistical functions that bring ease for calculating statistical data promptly. Amongst Stats functions, finding a correlation manually between two given datasets can be cumbersome, but with built-in Excel 2010 CORREL function, finding co-relation coefficient is a cinch. The function lets you easily calculate co-relation between any two given data sets or set of values. You need to specify the data range or values, it instantly shows you the co-relation between them. You can quickly apply applied CORREL function over required data sets by just copying the cell containing the CORREL function. All it requires is two simple arguments to be filled in the form of arrays. The Correlation values range from –1.0 to +1.0, implying +1.0 as best co-relation between datasets and converse is the case with –1.0.
To begin, launch Excel 2010 and open a spreadsheet you want to use the co-relation. For instance we have created two fields namely Values 1 and Values 2.
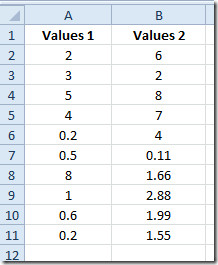
Correlation resultant values ranges from –0.1 to +0.1, where +1.00 being the best positive relationship you can get. We will find out coefficient correlation between above mentioned data values field.
To start off with, first you need to familiar with the following syntax.
=CORREL(array1,array2)
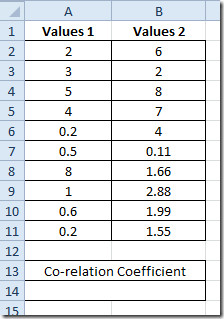
array1 in function argument is the dataset 1 and array2 refers to dataset 2. Under Values 1 and Values 2 fields, we will add a label namely Correlation Coefficient.
We will write the CORREL with the following data ranges.
=CORREL(A2:A11,B2:B11)
In function argument, A2:A11 is the range of dataset 1, in mentioned spreadsheet that is Values 1 field, and B2:B11 is the range of field Values 2. We will be putting this formula underneath the Correlation Coefficient label. This will instantly show the result for values residing in both fields.
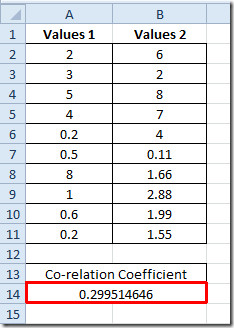
The result 0.299 shows, which is not a perfect correlation between fields but not that much negative as it is in the range of 0 to +1
You may also be interested in previously reviewed on Excel Functions; MROUND, MODULUS & QUOTIENT, RANK.AVG and RANK.EQ, WORKDAY.INTL, LARGE, CEILING, TIME, ADDRESS ,FACT (factorial), MAX,MIN, MAXA, MINA and EXACT, Logical Functions, INFO, SUMSQ, DOLLAR, SUMPRODUCT, SUMIF, COUNTIF, VLOOKUP, HLOOKUP ,PMT, & LEN.

Great work. Is this equal to R^2 used e.g. used with trend lines in diagrams?
Yes this did help me get the correlation I wanted
Can the result of this be used to create a correction factor? I.E. if i wanted to create an expression that takes the results of column A * a given factor to predict what column B would be witih a high degree of confidence?
I like the article. It’s just a little strange that you write co-relation instead of correlation. 😛
Thanks for the article!
A score of -1.0 implies a strong negative correlation (that is the value of Y decreases as X increases), so it is not correct to say that -1.0 is the opposite of the ‘best correlation’ implied by 1.0.
The closer to -1.0 the stronger the negative correlation, and the closer to 1.0 the stronger the positive correlation.
Please correct me if I’m wrong:
Correlation of 1 = perfectly directly proportional, or moving in the same direction at the same magnitude
Correlation of -1 = perfectly inversely proportional, or moving in opposite directions at the same magnitude
I LIKE IT VERY MUCH BCZ ITS VERY EASY TO LEARN AND MORE MORE BETTER THAN OTHER FUCKIN SITES
What an intellect.
🙂
*intellectual